Pay vs Performance Disclosure
|
12 Months Ended |
|
Dec. 31, 2025
USD ($)
|
Dec. 31, 2024
USD ($)
|
Dec. 31, 2023
USD ($)
|
Dec. 31, 2022
USD ($)
|
Dec. 31, 2021
USD ($)
|
| Pay vs Performance Disclosure |
|
|
|
|
|
| Pay vs Performance Disclosure, Table |
| | | | | | | | | | | | | | | | | | | | | | | | | | | | | | | | | | | | | | | | | | | | | | | | | | | | | | | | | | | | | | | | | | | Year | Summary Compensation Table Total for First PEO1 ($) | Summary Compensation Table Total for Second PEO2 ($) | Compensation Actually Paid to First PEO1,3 ($) | Compensation Actually Paid to Second PEO2,3 ($) | Average Summary Compensation Table Total for Non-PEO NEO4 ($) | Average Compensation Actually Paid to Non-PEO NEO 4,5 ($) | | Value of Initial Fixed $100
Investment Based On: | | | | | | Total Shareholder Return ($) | Peer Group Total Shareholder Return6 ($) | Net Income (Loss) ($) | Adjusted Diluted EPS7 ($) | | 2025 | | $ | 19,506,298 | | | $ | — | | | $ | 4,646,963 | | | $ | – | | | $ | 7,660,278 | | | $ | 3,190,854 | | | | $ | 68.55 | | | $ | 148.37 | | | $ | (6,674) | | | $ | 2.08 | | | 2024 | | 20,602,148 | | | — | | | 5,380,644 | | | — | | | 7,197,901 | | | 2,470,464 | | | | 100.92 | | | 129.47 | | | 3,305 | | | 7.17 | | | 2023 | | 18,556,966 | | | — | | | 13,968,419 | | | — | | | 7,571,326 | | | 6,661,957 | | | | 123.62 | | | 126.21 | | | 2,702 | | | 6.68 | | | 2022 | | 13,246,447 | | | 7,599,513 | | | 12,622,902 | | | 6,829,908 | | | 6,659,921 | | | 6,508,126 | | | | 136.62 | | | 123.67 | | | 1,202 | | | 5.78 | | | 2021 | | — | | | 20,637,990 | | | — | | | 42,314,846 | | | 9,904,692 | | | 8,682,563 | | | | 137.26 | | | 126.13 | | | 1,347 | | | 5.15 | | | | | | | | | | | | | | | | | | | | | | | | | | | | | |
|
|
|
|
|
| Company Selected Measure Name |
Adjusted Diluted EPS
|
|
|
|
|
| Named Executive Officers, Footnote |
Represents compensation for Ms. London, the Company's current CEO.Represents compensation for Mr. Neidorff, the Company's former CEO.Non-PEO NEOs for the applicable years were as follows: 2025 - Andrew Asher, Christopher Koster, Tanya McNally and Susan Smith; 2024 - Andrew Asher, Kenneth Fasola, Christopher Koster and Susan Smith; 2023 - Andrew Asher, Kenneth Fasola, Christopher Koster, David Thomas and James Murray; 2022 - Andrew Asher, Kenneth Fasola, Christopher Koster, Brent Layton, James Murray and David Thomas; and 2021 - Andrew Asher, Jesse Hunter, Christopher Koster, Brent Layton, Sarah London and Jeffrey Schwaneke.
|
|
|
|
|
| Peer Group Issuers, Footnote |
Represents the TSR for the S&P Health Care Index.
|
|
|
|
|
| PEO Total Compensation Amount |
$ 19,506,298
|
|
|
|
|
| PEO Actually Paid Compensation Amount |
$ 4,646,963
|
|
|
|
|
| Adjustment To PEO Compensation, Footnote |
PEO Compensation Actually Paid. The amounts in the following table represent each of the amounts deducted and added to the equity award values for the PEOs for 2025 for purposes of computing the "compensation actually paid" amounts appearing in this column of the Pay Versus Performance table: | | | | | | | 2025 | | PEO Summary Compensation Table Total | $ | 19,506,298 | | | SCT "Stock Awards Total" column value | (15,537,733) | | | | | Year-end fair value of outstanding equity awards granted in applicable year | 9,131,090 | | | Change in fair value of outstanding equity awards granted in prior years | (8,540,633) | | | Change in fair value of prior-year equity awards vested in applicable year | 87,941 | | | | | PEO Compensation Actually Paid | $ | 4,646,963 | |
|
|
|
|
|
| Non-PEO NEO Average Total Compensation Amount |
$ 7,660,278
|
$ 7,197,901
|
$ 7,571,326
|
$ 6,659,921
|
$ 9,904,692
|
| Non-PEO NEO Average Compensation Actually Paid Amount |
$ 3,190,854
|
2,470,464
|
6,661,957
|
6,508,126
|
8,682,563
|
| Adjustment to Non-PEO NEO Compensation Footnote |
Average Non-PEO NEO Compensation Actually Paid. The amounts in the following table represent each of the amounts deducted and added to the equity award values for the non-PEO NEOs for 2025 for purposes of computing the "compensation actually paid" amounts appearing in this column of the Pay Versus Performance table: | | | | | | | 2025 | | Average Non-PEO NEO Summary Compensation Table Total | $ | 7,660,278 | | | SCT "Stock Awards Total" column value | (6,004,885) | | | | | | Year-end fair value of outstanding equity awards granted in applicable year | 3,429,328 | | Change in fair value of outstanding equity awards granted in prior years | (1,847,766) | | Change in fair value of prior-year equity awards vested in applicable year | (46,101) | | | | | | | | | Average Non-PEO NEO Compensation Actually Paid | $ | 3,190,854 | |
|
|
|
|
|
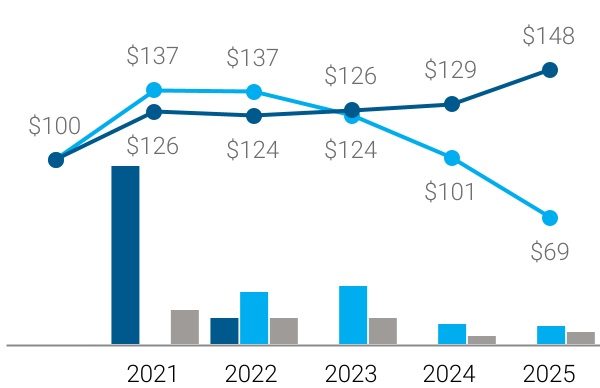
| Compensation Actually Paid vs. Total Shareholder Return |
Compensation Actually Paid
vs. TSR | | | | | | | CAP to Second PEO ($ in millions) | | CAP to First PEO ($ in millions) | | Average Compensation Actually Paid to Non-PEO NEOs ($ in millions) | | Company TSR | | S&P Health Care Index TSR |
|
|
|
|
|
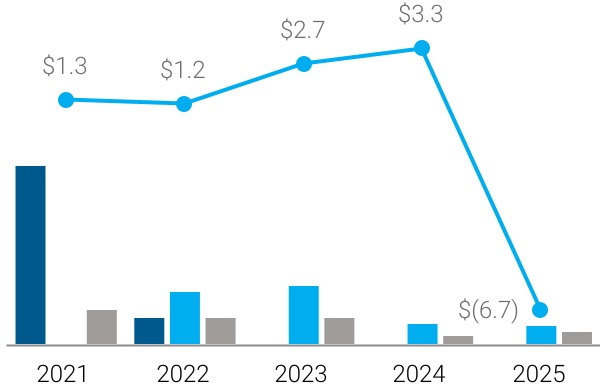
| Compensation Actually Paid vs. Net Income |
Compensation Actually Paid
vs. Net Income (Loss) | | | | | | | CAP to Second PEO ($ in millions) | | CAP to First PEO ($ in millions) | | Average Compensation Actually Paid to Non-PEO NEOs ($ in millions) | | Net Income (Loss) ($ in billions) |
|
|
|
|
|
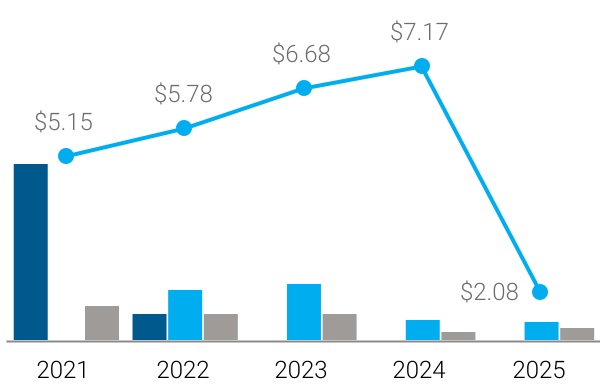
| Compensation Actually Paid vs. Company Selected Measure |
Compensation Actually Paid
vs. Adjusted Diluted EPS1 | | | | | | | CAP to Second PEO ($ in millions) | | CAP to First PEO ($ in millions) | | Average Compensation Actually Paid to Non-PEO NEOs ($ in millions) | | Adjusted Diluted EPS | | Represents non-GAAP measure. Refer to Appendix A for reconciliation of non-GAAP measures. | 1 |
|
|
|
|
|
| Total Shareholder Return Vs Peer Group |
Compensation Actually Paid
vs. TSR | | | | | | | CAP to Second PEO ($ in millions) | | CAP to First PEO ($ in millions) | | Average Compensation Actually Paid to Non-PEO NEOs ($ in millions) | | Company TSR | | S&P Health Care Index TSR |
|
|
|
|
|
| Tabular List, Table |
| | | | | | | | | | Most Important Performance Measures | | Adjusted Diluted EPS | Adjusted Net Earnings Margin | Total Shareholder Return (TSR) | | Adjusted Pre-tax Margin | Revenue Growth Compound Annual Growth | |
|
|
|
|
|
| Total Shareholder Return Amount |
$ 68.55
|
100.92
|
123.62
|
136.62
|
137.26
|
| Peer Group Total Shareholder Return Amount |
148.37
|
129.47
|
126.21
|
123.67
|
126.13
|
| Net Income (Loss) |
$ (6,674,000,000)
|
$ 3,305,000,000
|
$ 2,702,000,000
|
$ 1,202,000,000
|
$ 1,347,000,000
|
| Company Selected Measure Amount |
2.08
|
7.17
|
6.68
|
5.78
|
5.15
|
| Measure:: 1 |
|
|
|
|
|
| Pay vs Performance Disclosure |
|
|
|
|
|
| Name |
TSR
|
|
|
|
|
| Measure:: 2 |
|
|
|
|
|
| Pay vs Performance Disclosure |
|
|
|
|
|
| Non-GAAP Measure Description |
The Company has identified Adjusted Diluted EPS, a non-GAAP measure, as our company-selected measure, as it represents the most important financial performance measure used to link compensation actually paid to the PEO and the non-PEO NEOs in 2025 to the Company's performance. See Appendix A for reconciliation of non-GAAP measures.
|
|
|
|
|
| London [Member] |
|
|
|
|
|
| Pay vs Performance Disclosure |
|
|
|
|
|
| PEO Total Compensation Amount |
$ 19,506,298
|
$ 20,602,148
|
$ 18,556,966
|
$ 13,246,447
|
$ 0
|
| PEO Actually Paid Compensation Amount |
$ 4,646,963
|
$ 5,380,644
|
$ 13,968,419
|
$ 12,622,902
|
0
|
| PEO Name |
London
|
London
|
London
|
London
|
|
| Neidorff [Member] |
|
|
|
|
|
| Pay vs Performance Disclosure |
|
|
|
|
|
| PEO Total Compensation Amount |
$ 0
|
$ 0
|
$ 0
|
$ 7,599,513
|
20,637,990
|
| PEO Actually Paid Compensation Amount |
$ 0
|
$ 0
|
$ 0
|
$ 6,829,908
|
$ 42,314,846
|
| PEO Name |
|
|
|
Neidorf
|
Neidorff
|
| PEO | Measure:: 1 |
|
|
|
|
|
| Pay vs Performance Disclosure |
|
|
|
|
|
| Name |
Total Shareholder Return (TSR)
|
|
|
|
|
| PEO | Measure:: 2 |
|
|
|
|
|
| Pay vs Performance Disclosure |
|
|
|
|
|
| Name |
Adjusted Diluted EPS
|
|
|
|
|
| PEO | Measure:: 3 |
|
|
|
|
|
| Pay vs Performance Disclosure |
|
|
|
|
|
| Name |
Adjusted Pre-tax Margin
|
|
|
|
|
| PEO | Measure:: 4 |
|
|
|
|
|
| Pay vs Performance Disclosure |
|
|
|
|
|
| Name |
Adjusted Net Earnings Margin
|
|
|
|
|
| PEO | Measure:: 5 |
|
|
|
|
|
| Pay vs Performance Disclosure |
|
|
|
|
|
| Name |
Revenue Growth Compound Annual Growth
|
|
|
|
|
| PEO | Aggregate Grant Date Fair Value of Equity Award Amounts Reported in Summary Compensation Table |
|
|
|
|
|
| Pay vs Performance Disclosure |
|
|
|
|
|
| Adjustment to Compensation, Amount |
$ (15,537,733)
|
|
|
|
|
| PEO | Year-end Fair Value of Equity Awards Granted in Covered Year that are Outstanding and Unvested |
|
|
|
|
|
| Pay vs Performance Disclosure |
|
|
|
|
|
| Adjustment to Compensation, Amount |
9,131,090
|
|
|
|
|
| PEO | Year-over-Year Change in Fair Value of Equity Awards Granted in Prior Years That are Outstanding and Unvested |
|
|
|
|
|
| Pay vs Performance Disclosure |
|
|
|
|
|
| Adjustment to Compensation, Amount |
(8,540,633)
|
|
|
|
|
| PEO | Change in Fair Value as of Vesting Date of Prior Year Equity Awards Vested in Covered Year |
|
|
|
|
|
| Pay vs Performance Disclosure |
|
|
|
|
|
| Adjustment to Compensation, Amount |
87,941
|
|
|
|
|
| Non-PEO NEO | Aggregate Grant Date Fair Value of Equity Award Amounts Reported in Summary Compensation Table |
|
|
|
|
|
| Pay vs Performance Disclosure |
|
|
|
|
|
| Adjustment to Compensation, Amount |
(6,004,885)
|
|
|
|
|
| Non-PEO NEO | Year-end Fair Value of Equity Awards Granted in Covered Year that are Outstanding and Unvested |
|
|
|
|
|
| Pay vs Performance Disclosure |
|
|
|
|
|
| Adjustment to Compensation, Amount |
3,429,328
|
|
|
|
|
| Non-PEO NEO | Year-over-Year Change in Fair Value of Equity Awards Granted in Prior Years That are Outstanding and Unvested |
|
|
|
|
|
| Pay vs Performance Disclosure |
|
|
|
|
|
| Adjustment to Compensation, Amount |
(1,847,766)
|
|
|
|
|
| Non-PEO NEO | Change in Fair Value as of Vesting Date of Prior Year Equity Awards Vested in Covered Year |
|
|
|
|
|
| Pay vs Performance Disclosure |
|
|
|
|
|
| Adjustment to Compensation, Amount |
$ (46,101)
|
|
|
|
|