Pay Versus Performance Table
The following summarizes the relationship between the executive compensation actually paid by the Company and the financial performance of Newmont over a five-year performance period.
VALUE OF INITIAL FIXED | ||||||||||||||||
$100 INVESTMENT ON | ||||||||||||||||
DECEMBER 31, 2020 | ||||||||||||||||
BASED ON | ||||||||||||||||
AVERAGE | AVERAGE | |||||||||||||||
SUMMARY | COMPENSATION | |||||||||||||||
SUMMARY | COMPENSATION | ACTUALLY | PEER/INDEX | |||||||||||||
COMPENSATION | COMPENSATION | TABLE TOTAL FOR | PAID TO | TOTAL | TOTAL | COMPANY NET | ||||||||||
TABLE TOTAL | ACTUALLY PAID | NON-PEO | NON-PEO | SHAREHOLDER | SHAREHOLDER | INCOME | FREE CASH | |||||||||
PEFORMANCE YEAR | FOR PEO ($)(1) | TO PEO ($)(1)(7) | NEOS ($)(2) | NEOS ($)(2)(7) | RETURN ($)(3) | RETURN ($)(3)(4) | (LOSS) ($)(5) | FLOW($)(6) | ||||||||
2025 | $ | 15,625,168 | $ | 46,280,998 | $ | 4,537,982 | $ | 8,992,688 | $ | 195 | $ | 330 | $ | 7,167 | $ | 7,299 |
2024 | $ | 12,965,126 | $ | 3,323,357 | $ | 4,463,189 | $ | 3,119,735 | $ | 72 | $ | 156 | $ | 3,381 | $ | 2,916 |
2023 | $ | 11,747,104 | $ | 1,125,000 | $ | 3,949,153 | $ | 1,588,050 | $ | 78 | $ | 162 | $ | (2,467) | $ | 88 |
2022 | $ | 13,654,538 | $ | 3,407,020 | $ | 3,904,167 | $ | 1,166,702 | $ | 85 | $ | 154 | $ | (369) | $ | 1,067 |
2021 | $ | 12,667,106 | $ | 15,415,524 | $ | 3,922,861 | $ | 3,707,302 | $ | 107 | $ | 157 | $ | 233 | $ | 2,613 |
(1) In his capacity as Chief Executive Officer, Mr. Palmer is included as our PEO for 2021 to 2025. See the Summary Compensation Table Total versus Compensation Actually Paid Reconciliation Table for additional details.
(2) Reflects compensation for the following non-PEO NEOs:
2025: Mr. Wexler, Ms. Viljoen, Mr. Toth, Mr. Hardy and Ms. Ovelmen
2024: Ms. Ovelmen, Ms. Viljoen, Mr. Wexler, Mr. Toth and Mr. Atkinson
2023: Ms. Ovelmen, Ms. Viljoen, Mr. Atkinson, Mr. Toth, Mr. Tabolt, and Mr. Puna
2022: Mr. Tabolt, Mr. Atkinson, Ms. Lipson, Mr. Toth, and Ms. Buese
2021: Ms. Buese, Mr. Atkinson, Mr. Gottesfeld, and Ms. Lipson
See Summary Compensation Table Total versus Compensation Actually Paid Reconciliation Table for additional details.
(3) In 2025, the Company modified its approach to calculating Total Shareholder Return for purposes of the Pay Versus Performance table to reflect a more standardized calculation that aligns with the Annual Report. The updated methodology has been applied to all periods presented.
(4) The peer group used for TSR comparisons reflects our compensation benchmarking peer group as disclosed in the Newmont Annual Report for each year. The peer group is comprised of the following companies for each year:
2025: Agnico Eagle Mines Ltd (AEM US); Anglogold Ashanti Ltd (AU US); Freeport (FCX US), Gold Fields Ltd (GFI US); Barrick Gold Corp (B US); Kinross Gold Corp (KGC US); Northern Star Resources Limited (NST AU) and Harmony Gold Mining Co Ltd (HMY US). The 2025 Peer/Index Total Shareholder Return was $341 when calculated using the prior-year peer group and $330 when calculated using the updated 2025 peer group.
2024 - 2023: Agnico Eagle Mines Ltd (AEM US); Anglogold Ashanti Ltd (AU US); Freeport (FCX US), Gold Fields Ltd (GFI US); Barrick Gold Corp (B US); Kinross Gold Corp (KGC US); and Harmony Gold Mining Co Ltd (HMY US).
2022 - 2021: Agnico Eagle Mines Ltd (AEM US); Anglogold Ashanti Ltd (AU US); Freeport (FCX US), Gold Fields Ltd (GFI US); Barrick Gold Corp (B US); Kinross Gold Corp (KGC US); Harmony Gold Mining Co Ltd (HMY US); and Newcrest Mining Ltd (NCM AU).
(5) Represents Newmont's Company Net Income (Loss) in millions, calculated on a GAAP basis, as disclosed in our Annual Report of Form 10-K for the relevant year.
(6) Represents Free Cash Flow in millions, a non-GAAP metric, as disclosed in our Annual Report of Form 10-K for the relevant year.
(7) The following adjustments were made to Summary Compensation Table total compensation to determine “Compensation Actually Paid” for our NEOs:
2025 | ||||
ADJUSTMENTS(8)(9) | PEO ($) | NON-PEO NEO AVERAGE ($) | ||
Summary Compensation Table Total | 15,625,168 | 4,537,982 | ||
Deduction for amount reported in “Stock Awards” column of the Summary Compensation Table | ( - ) | 10,094,351 | ( - ) | 2,657,153 |
Addition of fair value at fiscal year (FY) end, of equity awards granted during the FY that remained outstanding | (+) | 24,625,888 | (+) | 4,853,898 |
Addition of change in fair value at FY end versus prior FY end for awards granted in prior FY that remained outstanding | (+) | 15,291,483 | (+) | 3,255,029 |
Deduction of fair value of awards granted during prior FY that were forfeited during applicable FY, determined as of prior FY end | ( - ) | 0 | ( - ) | 1,217,352 |
Addition of change in fair value at vesting date versus prior FY end for awards granted in prior FY that vested during the FY | (+) | 393,682 | (+) | 162,091 |
Addition in respect of any dividends or other earnings paid during applicable FY prior to vesting date of underlying award | (+) | 617,869 | (+) | 108,164 |
Deduction for values reported in the “Change in Pension Value and Nonqualified Deferred Compensation Earnings” column of the Summary Compensation Table | ( - ) | 694,517 | ( - ) | 161,252 |
Addition for the Service Cost attributable to services rendered during the FY | (+) | 515,776 | (+) | 111,281 |
Compensation Actually Paid | 46,280,998 | 8,992,688 | ||
(8) Equity valuations have been calculated in accordance with the requirements for Compensation Actually Paid. Adjustments for restricted stock units (“RSUs”) reflect changes in fair value during the fiscal year based on the Company’s closing stock price at fiscal year-end or the applicable vesting date. RSU awards generally vest pro-rata over three years. Adjustments for performance stock units (“PSUs”) reflect changes in fair value during the fiscal year based on the Company’s closing stock price at fiscal year-end and management’s estimate of expected performance. For PSUs with market-based conditions, fair value is determined using a Monte Carlo simulation model as described in the Company’s Annual Report on Form 10-K for the year ended December 31, 2025. PSU awards have a maximum payout opportunity of 200% of target. See the Compensation Discussion and Analysis for additional information. |
(9) The Company’s pension benefits are determined under its qualified defined benefit plan. The total pension expense for each year includes (i) the service cost for benefits earned during the year and (ii) any prior service cost arising from plan amendments, if applicable, which was $0 for all years presented. All amounts are calculated in accordance with U.S. GAAP. |
|
(1) In his capacity as Chief Executive Officer, Mr. Palmer is included as our PEO for 2021 to 2025. See the Summary Compensation Table Total versus Compensation Actually Paid Reconciliation Table for additional details.
(2) Reflects compensation for the following non-PEO NEOs:
2025: Mr. Wexler, Ms. Viljoen, Mr. Toth, Mr. Hardy and Ms. Ovelmen
2024: Ms. Ovelmen, Ms. Viljoen, Mr. Wexler, Mr. Toth and Mr. Atkinson
2023: Ms. Ovelmen, Ms. Viljoen, Mr. Atkinson, Mr. Toth, Mr. Tabolt, and Mr. Puna
2022: Mr. Tabolt, Mr. Atkinson, Ms. Lipson, Mr. Toth, and Ms. Buese
2021: Ms. Buese, Mr. Atkinson, Mr. Gottesfeld, and Ms. Lipson
See Summary Compensation Table Total versus Compensation Actually Paid Reconciliation Table for additional details.
(4) The peer group used for TSR comparisons reflects our compensation benchmarking peer group as disclosed in the Newmont Annual Report for each year. The peer group is comprised of the following companies for each year:
2025: Agnico Eagle Mines Ltd (AEM US); Anglogold Ashanti Ltd (AU US); Freeport (FCX US), Gold Fields Ltd (GFI US); Barrick Gold Corp (B US); Kinross Gold Corp (KGC US); Northern Star Resources Limited (NST AU) and Harmony Gold Mining Co Ltd (HMY US). The 2025 Peer/Index Total Shareholder Return was $341 when calculated using the prior-year peer group and $330 when calculated using the updated 2025 peer group.
2024 - 2023: Agnico Eagle Mines Ltd (AEM US); Anglogold Ashanti Ltd (AU US); Freeport (FCX US), Gold Fields Ltd (GFI US); Barrick Gold Corp (B US); Kinross Gold Corp (KGC US); and Harmony Gold Mining Co Ltd (HMY US).
2022 - 2021: Agnico Eagle Mines Ltd (AEM US); Anglogold Ashanti Ltd (AU US); Freeport (FCX US), Gold Fields Ltd (GFI US); Barrick Gold Corp (B US); Kinross Gold Corp (KGC US); Harmony Gold Mining Co Ltd (HMY US); and Newcrest Mining Ltd (NCM AU).
(7) The following adjustments were made to Summary Compensation Table total compensation to determine “Compensation Actually Paid” for our NEOs:
2025 | ||||
ADJUSTMENTS(8)(9) | PEO ($) | NON-PEO NEO AVERAGE ($) | ||
Summary Compensation Table Total | 15,625,168 | 4,537,982 | ||
Deduction for amount reported in “Stock Awards” column of the Summary Compensation Table | ( - ) | 10,094,351 | ( - ) | 2,657,153 |
Addition of fair value at fiscal year (FY) end, of equity awards granted during the FY that remained outstanding | (+) | 24,625,888 | (+) | 4,853,898 |
Addition of change in fair value at FY end versus prior FY end for awards granted in prior FY that remained outstanding | (+) | 15,291,483 | (+) | 3,255,029 |
Deduction of fair value of awards granted during prior FY that were forfeited during applicable FY, determined as of prior FY end | ( - ) | 0 | ( - ) | 1,217,352 |
Addition of change in fair value at vesting date versus prior FY end for awards granted in prior FY that vested during the FY | (+) | 393,682 | (+) | 162,091 |
Addition in respect of any dividends or other earnings paid during applicable FY prior to vesting date of underlying award | (+) | 617,869 | (+) | 108,164 |
Deduction for values reported in the “Change in Pension Value and Nonqualified Deferred Compensation Earnings” column of the Summary Compensation Table | ( - ) | 694,517 | ( - ) | 161,252 |
Addition for the Service Cost attributable to services rendered during the FY | (+) | 515,776 | (+) | 111,281 |
Compensation Actually Paid | 46,280,998 | 8,992,688 | ||
(8) Equity valuations have been calculated in accordance with the requirements for Compensation Actually Paid. Adjustments for restricted stock units (“RSUs”) reflect changes in fair value during the fiscal year based on the Company’s closing stock price at fiscal year-end or the applicable vesting date. RSU awards generally vest pro-rata over three years. Adjustments for performance stock units (“PSUs”) reflect changes in fair value during the fiscal year based on the Company’s closing stock price at fiscal year-end and management’s estimate of expected performance. For PSUs with market-based conditions, fair value is determined using a Monte Carlo simulation model as described in the Company’s Annual Report on Form 10-K for the year ended December 31, 2025. PSU awards have a maximum payout opportunity of 200% of target. See the Compensation Discussion and Analysis for additional information. |
(9) The Company’s pension benefits are determined under its qualified defined benefit plan. The total pension expense for each year includes (i) the service cost for benefits earned during the year and (ii) any prior service cost arising from plan amendments, if applicable, which was $0 for all years presented. All amounts are calculated in accordance with U.S. GAAP. |
|
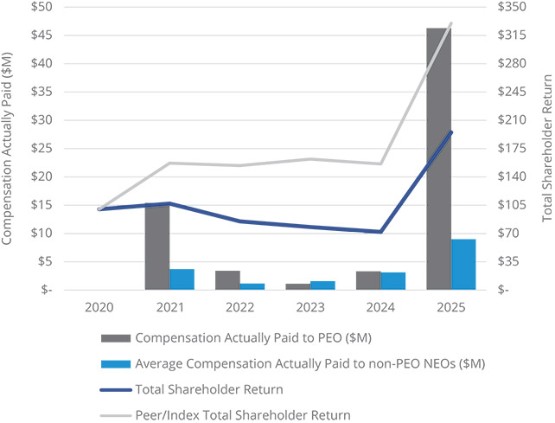
Compensation Actually Paid versus Total Shareholder Return
Compensation Actually Paid versus Free Cash Flow and Net Income
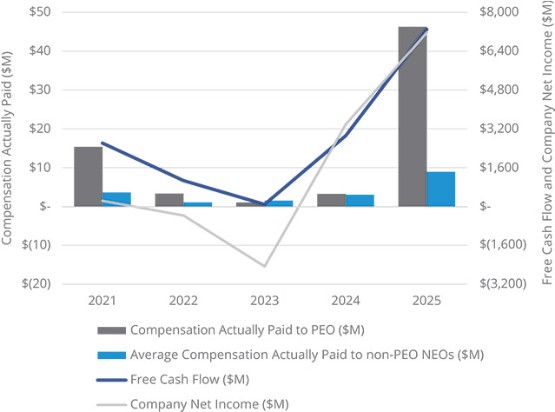
Compensation Actually Paid versus Free Cash Flow and Net Income
Compensation Actually Paid versus Total Shareholder Return
Tabular List of Financial Performance Measures
Absolute Total Shareholder Return (TSR) |
Free Cash Flow |
Relative Total Shareholder Return (rTSR) |
(6) Represents Free Cash Flow in millions, a non-GAAP metric, as disclosed in our Annual Report of Form 10-K for the relevant year.