Pay vs Performance Disclosure - USD ($)
Dec. 31, 2025
Dec. 31, 2024
Dec. 31, 2023
Dec. 31, 2022
Dec. 31, 2021
Pay Versus Performance
The following table sets forth the compensation for our CEO and the average compensation for our
Non-CEO
NEOs, as set forth in the Summary Compensation Table (“SCT”) on page 48 of this proxy statement and to reflect the Compensation Actually Paid (“CAP”) to such individuals, as defined under SEC’s pay versus performance disclosure rules, Item 402(v) of Regulation S-K,
over the last three (3) years. The table also provides information on our cumulative total shareholder return (“TSR”) and net income. We are permitted to report as a “smaller reporting company” as defined under the U.S. federal securities laws. Accordingly, we have not included a tabular list of financial performance measures, and the table below includes neither a column for a “Company-Selected Measure” nor does it include the year-end
values of $100 invested in a peer group or industry index. Compensation amounts are presented in thousands; TSR assumes a fixed $100 investment.
| Year |
Summary Compensation Table for Interim CEO ($) (1) |
Compensation Actually Paid to Interim CEO ($) (2) |
Summary Compensation Table Total for Former CEO ($) (1) |
Compensation Actually Paid Former CEO ($) (2) |
Average Summary Compensation Table Total for non-CEO NEOs ($) (3)(4) |
Average Compensation Actually Paid to non-CEO NEOs ($) (5) |
Value of Initial Fixed $100 Investment Based on Total Shareholder Return |
Net Income (Loss) |
||||||||||||||||||||||||
| 2025 |
$ | 1,261 | 2,077 | $ | 818 | (279 | ) | 496 | 529 | $ | 17.34 | ($ | 18,599 | ) | ||||||||||||||||||
| 2024 |
$ | 0 | $ | 1,334 | $ | 1,704 | $ | 654 | $ | 784 | $ | 21.05 | ($ | 24,029 | ) | |||||||||||||||||
| 2023 |
$ | 0 | $ | 3,659 | $ | 382 | $ | 880 | $ | 276 | $ | 17.97 | ($ | 98,238 | ) | |||||||||||||||||
(1) |
The dollar amount reported is the total compensation reported to Mr. Carnifax for 2025 in the Total” column of the SCT. Mr. Carnifax was appointed as the Company’s Chief Operating Officer effective May 1, 2025 and as the Company’s Interim Chief Executive Officer effective July 14, 2025. The dollar amounts reported are the total compensation reported to Mr. Arling (“Former CEO”) for each fiscal year in the “Total” column of the SCT. Mr. Arling served as our Chief Executive Officer from 2020 until his retirement in May 2025. |
(2) |
The amounts reported in this column represent the amount of CAP to our Interim CEO and Former CEO, as appliable, computed in accordance with Item 402(v) of Regulation S-K, as follows: |
Interim CEO |
Former CEO |
|||||||||||||||
| Adjustments to Determine Compensation Actually Paid (in thousands) |
2025 |
2025 |
2024 |
2023 |
||||||||||||
| Total compensation as reported in the SCT |
$ | 1,261 | $ | 818 | $ | 1,334 | $ | 3,659 | ||||||||
| Deduction for amounts reported under the “Stock Awards” column in the SCT |
— | — | (307 | ) | (1,400 | ) | ||||||||||
| Deduction for amounts reported under the “Performance Stock Awards” column in the SCT |
(630 | ) | — | (170 | ) | — | ||||||||||
| Deduction for amounts reported under the “Option Awards” column in the SCT |
(231 | ) | — | — | (1,400 | ) | ||||||||||
| Increase for fair value of awards granted during the current year that remain unvested as of year end |
1,908 | — | 646 | 782 | ||||||||||||
| Increase/deduction for change in fair value from prior year end to current year end of awards granted prior to the current year that were outstanding and unvested as of year end |
(187 | ) | (808 | ) | 177 | (1,167 | ) | |||||||||
| Increase/deduction for change in fair value from prior year end to vesting date of awards granted prior to the current year that vested during the current year |
(42 | ) | (289 | ) | 24 | (92 | ) | |||||||||
| |
|
|
|
|
|
|
|
|||||||||
| CAP (as calculated) |
$ | 2,077 | $ | (279 | ) | $ | 1,704 | $ | 382 | |||||||
| |
|
|
|
|
|
|
|
|||||||||
(3) |
The amounts reported in this column represent the average of the amounts reported for the Company’s Non-CEO NEOs as a group in the “Total” column of the SCT in each applicable year. The names of each of the Non-CEO NEOs included for purposes of calculating the average amounts in each applicable year are as follows: (i) for 2025, Messrs. Jenke, Hackworth, Ammari and Chong; (ii) for each of 2024 and 2023, Messrs. Hackworth, Ammari, Carnifax, and Chong. |
(4) |
The amounts reported in this column represent the average amount of CAP to the Non-CEO NEOs as a group, as computed in accordance with Item 402(v) of Regulation S-K, as follows: |
| Adjustments to Determine Compensation Actually Paid for Non-CEO NEOs (in thousands) |
2025 |
2024 |
2023 |
2022 |
2021 |
|||||||||||||||
| Total compensation as reported in the SCT |
$ | 496 | $ | 654 | $ | 880 | $ | 766 | $ | 818 | ||||||||||
| Deduction for amounts reported under the “Stock Awards” column in the SCT |
— | (171 | ) | (261 | ) | (226 | ) | (219 | ) | |||||||||||
| Deduction for amounts reported under the “Performance Stock Awards” column in the SCT |
(157 | ) | (94 | ) | — | — | — | |||||||||||||
| Deduction for amounts reported under the “Option Awards” column in the SCT |
(42 | ) | — | (238 | ) | (181 | ) | (219 | ) | |||||||||||
| Increase for fair value of awards granted during the current year that remain unvested as of year end |
276 | 359 | 156 | 211 | 267 | |||||||||||||||
| Increase/deduction for change in fair value from prior year end to current year end of awards granted prior to the current year that were outstanding and unvested as of year end |
(35) | 31 | (231 | ) | (573 | ) | (519 | ) | ||||||||||||
| Increase/deduction for change in fair value from prior year end to vesting date of awards granted prior to the current year that vested during the current year |
(10) | 5 | (30 | ) | (151 | ) | 10 | |||||||||||||
| |
|
|
|
|
|
|
|
|
|
|||||||||||
| CAP (as calculated) |
$ | 529 | $ | 784 | $ | 276 | $ | (154 | ) | $ | 138 | |||||||||
| |
|
|
|
|
|
|
|
|
|
|||||||||||
Non-CEO
NEOs as a group in the “Total” column of the SCT in each applicable year. The names of each of the Non-CEO
NEOs included for purposes of calculating the average amounts in each applicable year are as follows: (i) for 2025, Messrs. Jenke, Hackworth, Ammari and Chong; (ii) for each of 2024 and 2023, Messrs. Hackworth, Ammari, Carnifax, and Chong.
(2) |
The amounts reported in this column represent the amount of CAP to our Interim CEO and Former CEO, as appliable, computed in accordance with Item 402(v) of Regulation S-K, as follows: |
Interim CEO |
Former CEO |
|||||||||||||||
| Adjustments to Determine Compensation Actually Paid (in thousands) |
2025 |
2025 |
2024 |
2023 |
||||||||||||
| Total compensation as reported in the SCT |
$ | 1,261 | $ | 818 | $ | 1,334 | $ | 3,659 | ||||||||
| Deduction for amounts reported under the “Stock Awards” column in the SCT |
— | — | (307 | ) | (1,400 | ) | ||||||||||
| Deduction for amounts reported under the “Performance Stock Awards” column in the SCT |
(630 | ) | — | (170 | ) | — | ||||||||||
| Deduction for amounts reported under the “Option Awards” column in the SCT |
(231 | ) | — | — | (1,400 | ) | ||||||||||
| Increase for fair value of awards granted during the current year that remain unvested as of year end |
1,908 | — | 646 | 782 | ||||||||||||
| Increase/deduction for change in fair value from prior year end to current year end of awards granted prior to the current year that were outstanding and unvested as of year end |
(187 | ) | (808 | ) | 177 | (1,167 | ) | |||||||||
| Increase/deduction for change in fair value from prior year end to vesting date of awards granted prior to the current year that vested during the current year |
(42 | ) | (289 | ) | 24 | (92 | ) | |||||||||
| |
|
|
|
|
|
|
|
|||||||||
| CAP (as calculated) |
$ | 2,077 | $ | (279 | ) | $ | 1,704 | $ | 382 | |||||||
| |
|
|
|
|
|
|
|
|||||||||
(4) |
The amounts reported in this column represent the average amount of CAP to the Non-CEO NEOs as a group, as computed in accordance with Item 402(v) of Regulation S-K, as follows: |
| Adjustments to Determine Compensation Actually Paid for Non-CEO NEOs (in thousands) |
2025 |
2024 |
2023 |
2022 |
2021 |
|||||||||||||||
| Total compensation as reported in the SCT |
$ | 496 | $ | 654 | $ | 880 | $ | 766 | $ | 818 | ||||||||||
| Deduction for amounts reported under the “Stock Awards” column in the SCT |
— | (171 | ) | (261 | ) | (226 | ) | (219 | ) | |||||||||||
| Deduction for amounts reported under the “Performance Stock Awards” column in the SCT |
(157 | ) | (94 | ) | — | — | — | |||||||||||||
| Deduction for amounts reported under the “Option Awards” column in the SCT |
(42 | ) | — | (238 | ) | (181 | ) | (219 | ) | |||||||||||
| Increase for fair value of awards granted during the current year that remain unvested as of year end |
276 | 359 | 156 | 211 | 267 | |||||||||||||||
| Increase/deduction for change in fair value from prior year end to current year end of awards granted prior to the current year that were outstanding and unvested as of year end |
(35) | 31 | (231 | ) | (573 | ) | (519 | ) | ||||||||||||
| Increase/deduction for change in fair value from prior year end to vesting date of awards granted prior to the current year that vested during the current year |
(10) | 5 | (30 | ) | (151 | ) | 10 | |||||||||||||
| |
|
|
|
|
|
|
|
|
|
|||||||||||
| CAP (as calculated) |
$ | 529 | $ | 784 | $ | 276 | $ | (154 | ) | $ | 138 | |||||||||
| |
|
|
|
|
|
|
|
|
|
|||||||||||
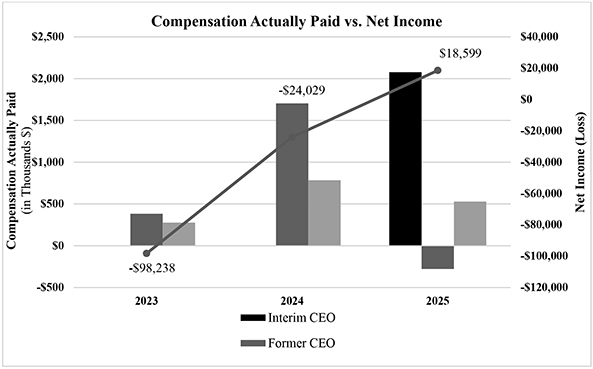
The following chart provides a graphical representation of the Compensation Actually Paid to our CEO and our
Non-CEO
NEOs (as a group) versus the Company’s five-year cumulative TSR. 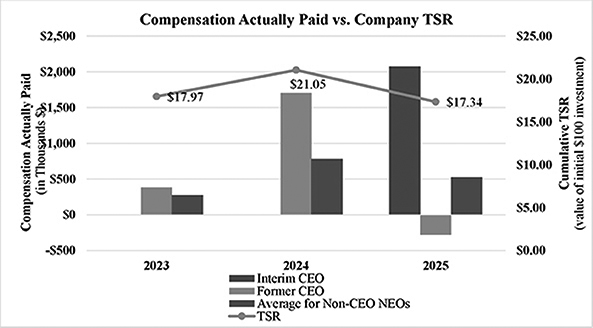
The following chart provides a graphical representation of the Compensation Actually Paid to our CEO and our
Non-CEO
NEOs (as a group) versus the Company’s Net Income.