Performance Management - Eaton Vance International Small-Cap Fund - Eaton Vance International Small-Cap Fund
Nov. 30, 2025
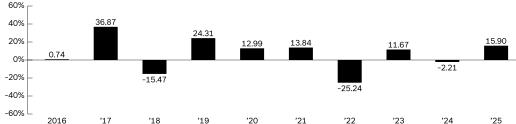
The following bar chart and table provide some indication of the risks of investing in the Fund by showing changes in the Fund’s performance from year to year and how the Fund’s average annual returns over time compare with those of one or more indexes intended to measure broad market performance. The Fund’s primary benchmark index was changed from the MSCI World ex USA Small Cap Index to the MSCI EAFE Index effective May 1, 2024 to comply with the regulation that requires the Fund’s primary benchmark to represent the overall applicable market. The additional index(es) in the table provide a means to compare the Fund’s average annual returns to a benchmark that the investment adviser believes is representative of the Fund’s investment universe. The returns in the bar chart are for Class A shares and do not reflect a sales charge. If the sales charge was reflected, the returns would be lower. Past performance (both before and after taxes) is not necessarily an indication of how the Fund will perform in the future. The Fund’s performance reflects the effects of expense reductions. Absent these reductions, performance would have been lower. Updated Fund performance information can be obtained by visiting www.eatonvance.com.
|
High Quarter
|
June 30, 2020
|
22.15%
|
|
|
Low Quarter
|
March 31, 2020
|
-26.03%
|
|
|
One Year
|
Five Years
|
Ten Years
|
|
Class A Return Before Taxes
|
9.84%
|
0.41%
|
5.26%
|
|
Class A Return After Taxes on Distributions
|
7.96%
|
-0.35%
|
4.62%
|
|
Class A Return After Taxes on Distributions and Sale of Class A Shares
|
7.33%
|
0.43%
|
4.27%
|
|
Class I Return Before Taxes
|
16.09%
|
1.72%
|
6.08%
|
|
MSCI EAFE Index (reflects net dividends, which reflect the deduction of withholding taxes)
|
31.22%
|
8.92%
|
8.18%
|
|
MSCI World ex USA Small Cap Index (reflects net dividends, which reflect the deduction of withholding taxes)
|
34.07%
|
6.49%
|
8.04%
|
These returns reflect the maximum current sales charge for Class A (5.25%). Investors cannot invest directly in an Index.
Source for MSCI EAFE Index and MSCI World ex USA Small Cap Index: MSCI. MSCI data may not be reproduced or used for any other purpose. MSCI provides no warranties, has not prepared or approved this report, and has no liability hereunder.
After-tax returns are calculated using the highest historical individual U.S. federal income tax rates and do not reflect the impact of state and local taxes. Actual after-tax returns depend on a shareholder’s tax situation and the actual characterization of distributions, and may differ from those shown. After-tax returns are not relevant to shareholders who hold shares in tax-deferred accounts or to shares held by non-taxable entities. After-tax returns for other Classes of shares will vary from the after-tax returns presented for Class A shares. Return After Taxes on Distributions for a period may be the same as Return Before Taxes for that period because no taxable distributions were made during that period. Also, Return After Taxes on Distributions and Sale of Fund Shares for a period may be greater than or equal to Return Before Taxes and/or Return After Taxes on Distributions for the same period because of losses realized on the sale of Fund shares.