Pay vs Performance Disclosure
Dec. 31, 2025
USD ($)
percent
Dec. 31, 2024
USD ($)
percent
Dec. 31, 2023
USD ($)
percent
Fiscal Year(1) | Summary Compensation Table Total for PEO Robinson, Andrew(2) | Compensation Actually Paid to PEO Robinson, Andrew(3)(4) | Average Summary Compensation Table Total for non-PEO NEOs(2) | Average Compensation Actually Paid to non-PEO NEOs(5)(6) | SKWD Total Shareholder Return(7) | Peer Group Total Shareholder Return(7) | Net Income ($M) | Internal Combined Ratio(8) | ||||||||||||||||||
| 2025 | $5,532,117 | $6,101,366 | $1,423,518 | $1,512,514 | $267.59 | $127.60 | $170.03 | 89.6% | ||||||||||||||||||
| 2024 | $4,641,869 | $17,050,183 | $1,107,150 | $2,842,640 | $264.61 | $128.30 | $118.83 | 91.6% | ||||||||||||||||||
| 2023 | $8,621,743 | $23,150,543 | $1,746,147 | $3,838,066 | $177.38 | $103.37 | $85.98 | 91.6% | ||||||||||||||||||
(1) Mr. Robinson was our PEO for each fiscal year included in the table. The following officers are included in the Non-PEO NEO group for the following fiscal years:
Year Non-PEO NEOs
2025 Mark Haushill, John Burkhart, Patricia Ryan, and Sandip Kapadia
2024 Mark Haushill, John Burkhart, Kirby Hill, and Sandip Kapadia
2023 Mark Haushill, John Burkhart, and Kirby Hill
(3) Amounts reflect the amounts reported in the “Summary Compensation Table Total for PEO” column adjusted as set forth in the table below, as determined in accordance with SEC rules. Amounts do not reflect the actual amount of compensation earned by or paid to our PEO during the applicable year. For information regarding the decisions made by the Compensation Committee with respect to the PEO’s compensation for fiscal year 2025, please see the Compensation Discussion and Analysis sections of this Proxy Statement.
The PEO Summary Compensation Table to CAP reconciliation is summarized in the following table:
PEO: Robinson, Andrew | |||||
Prior FYE | 12/31/2024 | ||||
Current FYE | 12/31/2025 | ||||
Fiscal Year | 2025 | ||||
SCT Total | $5,532,117 | ||||
- Grant Date Fair Value of Option Awards and Stock Awards Granted in Fiscal Year | ($1,563,117) | ||||
+ Fair Value at Fiscal Year-End of Outstanding and Unvested Option Awards and Stock Awards Granted in Fiscal Year | $1,740,136 | ||||
+ Change in Fair Value of Outstanding and Unvested Option Awards and Stock Awards Granted in Prior Fiscal Years | $516,831 | ||||
+ Fair Value at Vesting of Option Awards and Stock Awards Granted in Fiscal Year That Vested During Fiscal Year | $0 | ||||
+ Change in Fair Value as of Vesting Date of Option Awards and Stock Awards Granted in Prior Fiscal Years For Which Applicable Vesting Conditions Were Satisfied During Fiscal Year | ($124,602) | ||||
- Fair Value as of Prior Fiscal Year-End of Option Awards and Stock Awards Granted in Prior Fiscal Years That Failed to Meet Applicable Vesting Conditions During Fiscal Year | $0 | ||||
Compensation Actually Paid | $6,101,366 | ||||
(4) For the PEO in the table above, the foregoing amounts were added and deducted to the Summary Compensation Table (“SCT”) amount to determine the compensation actually paid (“CAP”) as determined in accordance with SEC regulations. “Compensation actually paid” does not necessarily represent cash, and/or equity value transferred to the PEO without restriction, but rather is a value calculated under applicable SEC rules. Fair values set forth in the table below are computed in accordance with ASC 718 as of the end of the respective fiscal year, other than fair values of the awards that vest in the covered year, which are valued as of the applicable vesting date. The valuation methods and underlying assumptions did not materially differ from those disclosed at the time of grant date of the equity awards.
(5) Amounts reflect the amounts reported in the “Average Summary Compensation Table Total for Non-PEO NEOs” column adjusted as set forth in the table below, as determined in accordance with SEC rules. Amounts do not reflect the actual amount of compensation earned by or paid to our Non-PEO NEOs during the applicable year. For information regarding the decisions made by the Compensation Committee in regards to the Non-PEO NEOs compensation for fiscal year 2025, please see the Compensation Discussion and Analysis sections of this Proxy Statement.
Prior FYE | 12/31/2024 | ||||
Current FYE | 12/31/2025 | ||||
Fiscal Year | 2025 | ||||
SCT Total | $1,423,518 | ||||
- Grant Date Fair Value of Option Awards and Stock Awards Granted in Fiscal Year | ($313,288) | ||||
+ Fair Value at Fiscal Year-End of Outstanding and Unvested Option Awards and Stock Awards Granted in Fiscal Year | $342,257 | ||||
+ Change in Fair Value of Outstanding and Unvested Option Awards and Stock Awards Granted in Prior Fiscal Years | $79,526 | ||||
+ Fair Value at Vesting of Option Awards and Stock Awards Granted in Fiscal Year That Vested During Fiscal Year | $0 | ||||
+ Change in Fair Value as of Vesting Date of Option Awards and Stock Awards Granted in Prior Fiscal Years For Which Applicable Vesting Conditions Were Satisfied During Fiscal Year | ($19,499) | ||||
- Fair Value as of Prior Fiscal Year-End of Option Awards and Stock Awards Granted in Prior Fiscal Years That Failed to Meet Applicable Vesting Conditions During Fiscal Year | $0 | ||||
Compensation Actually Paid | $1,512,514 | ||||
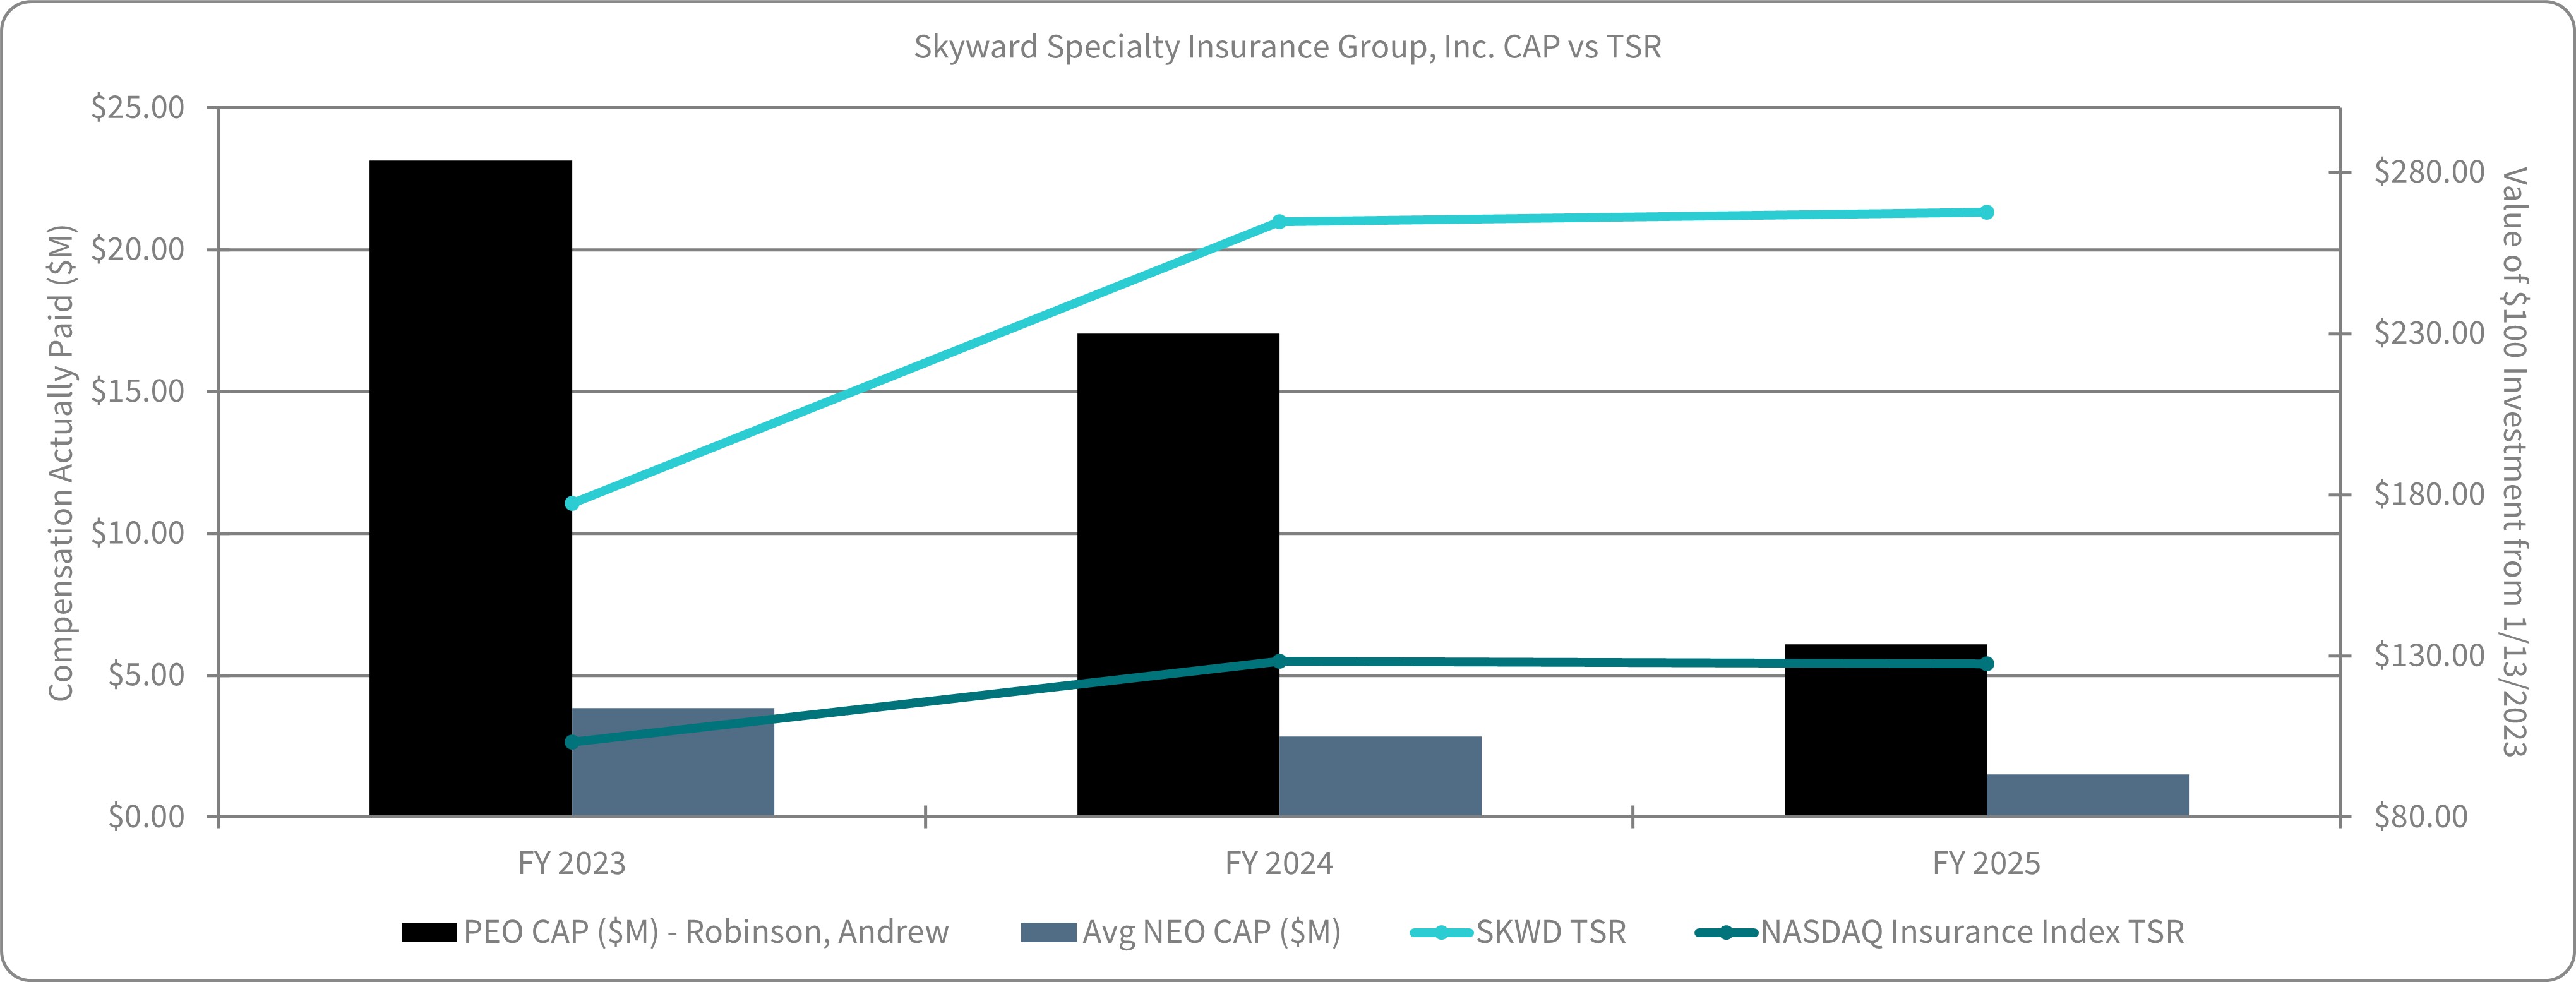
The following graph compares the compensation actually paid to our PEO, the average of the compensation actually paid to our remaining NEOs and the TSR performance of our stock price.
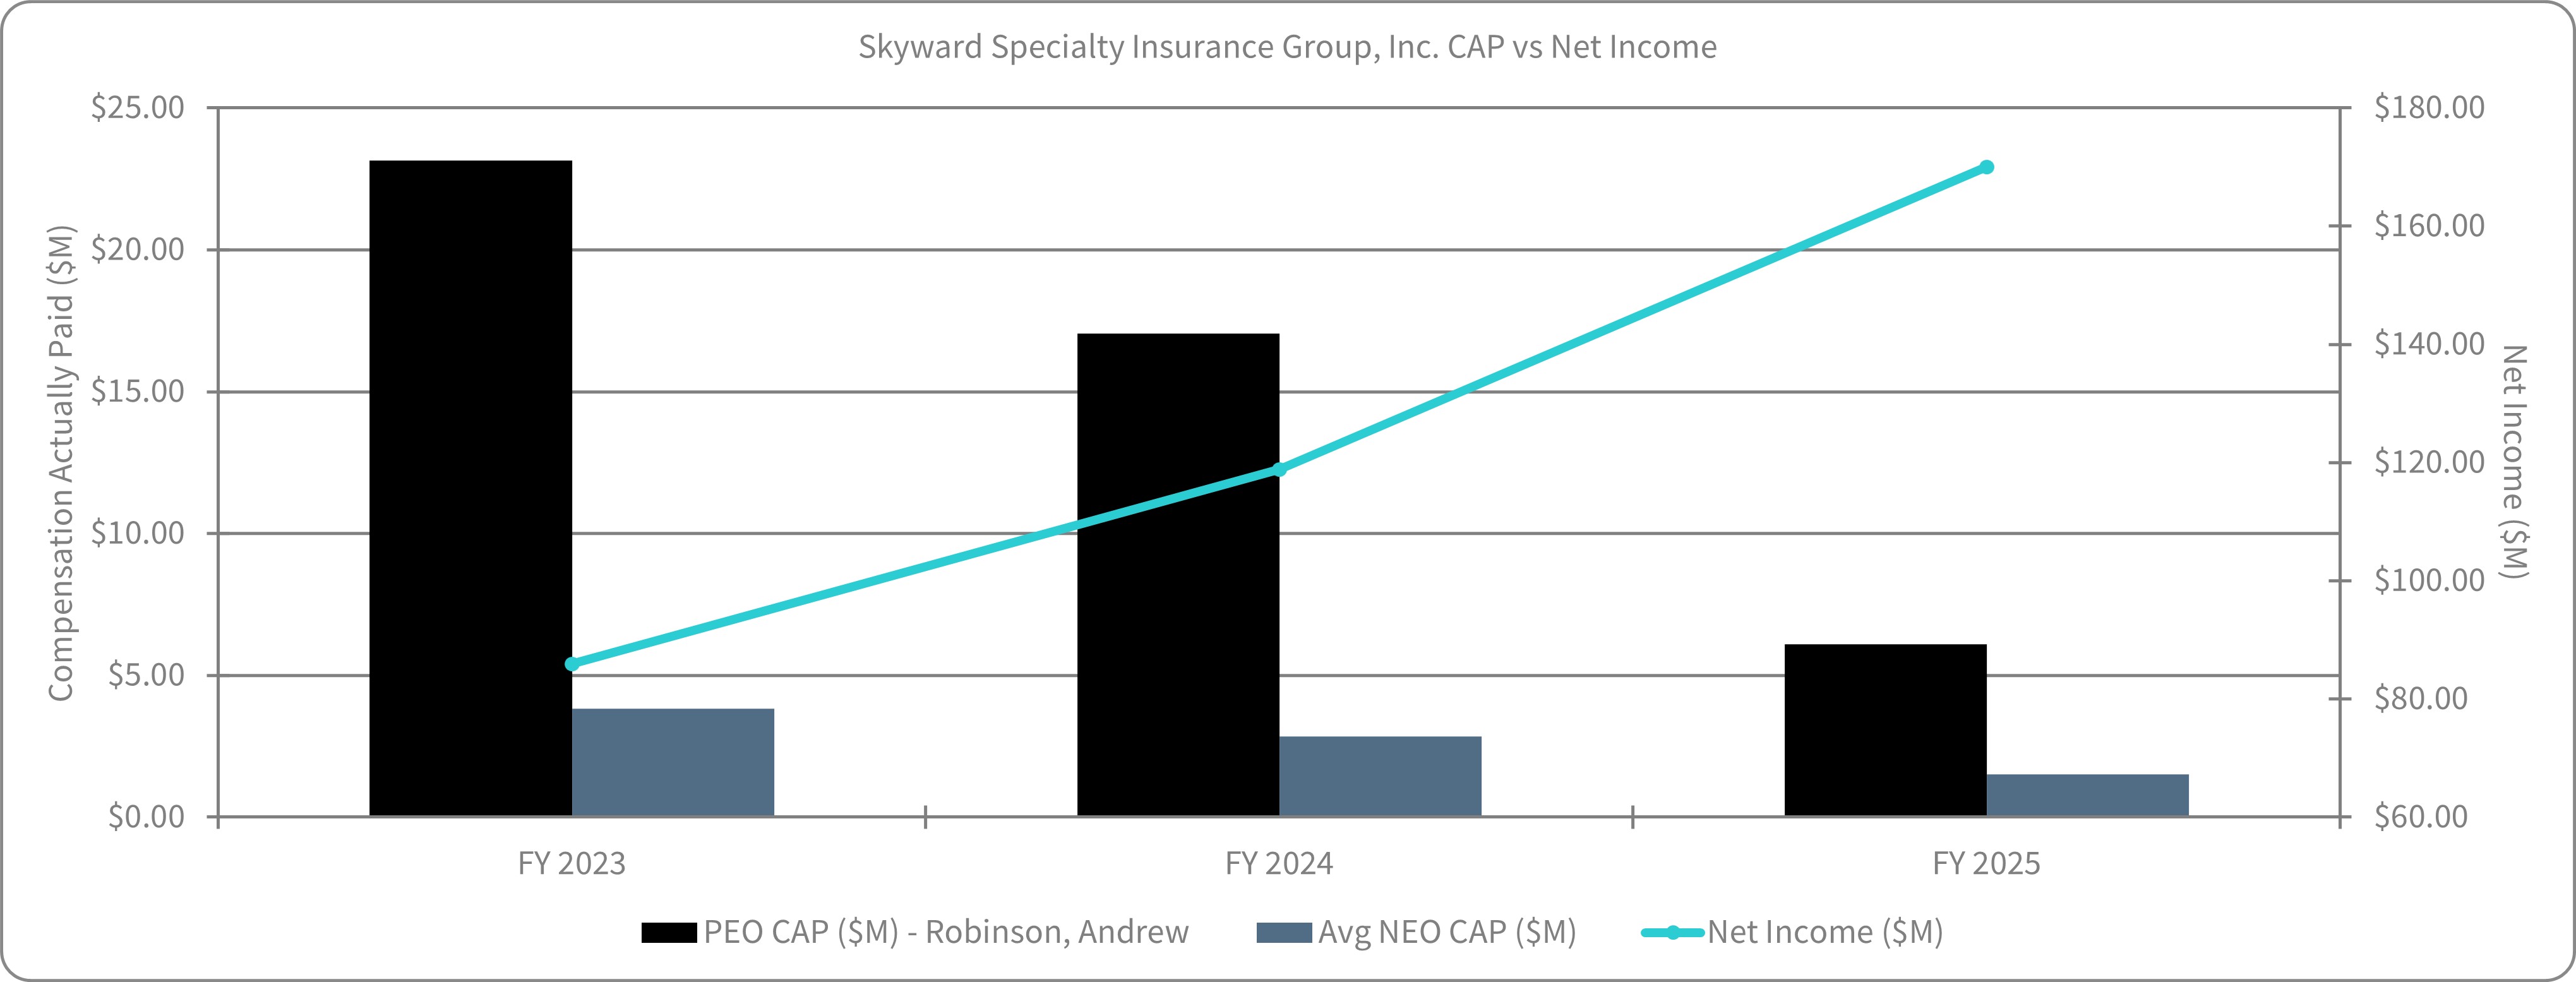
The following graph compares the compensation actually paid to our PEO and the average of the compensation actually paid to our remaining NEOs with Net Income.
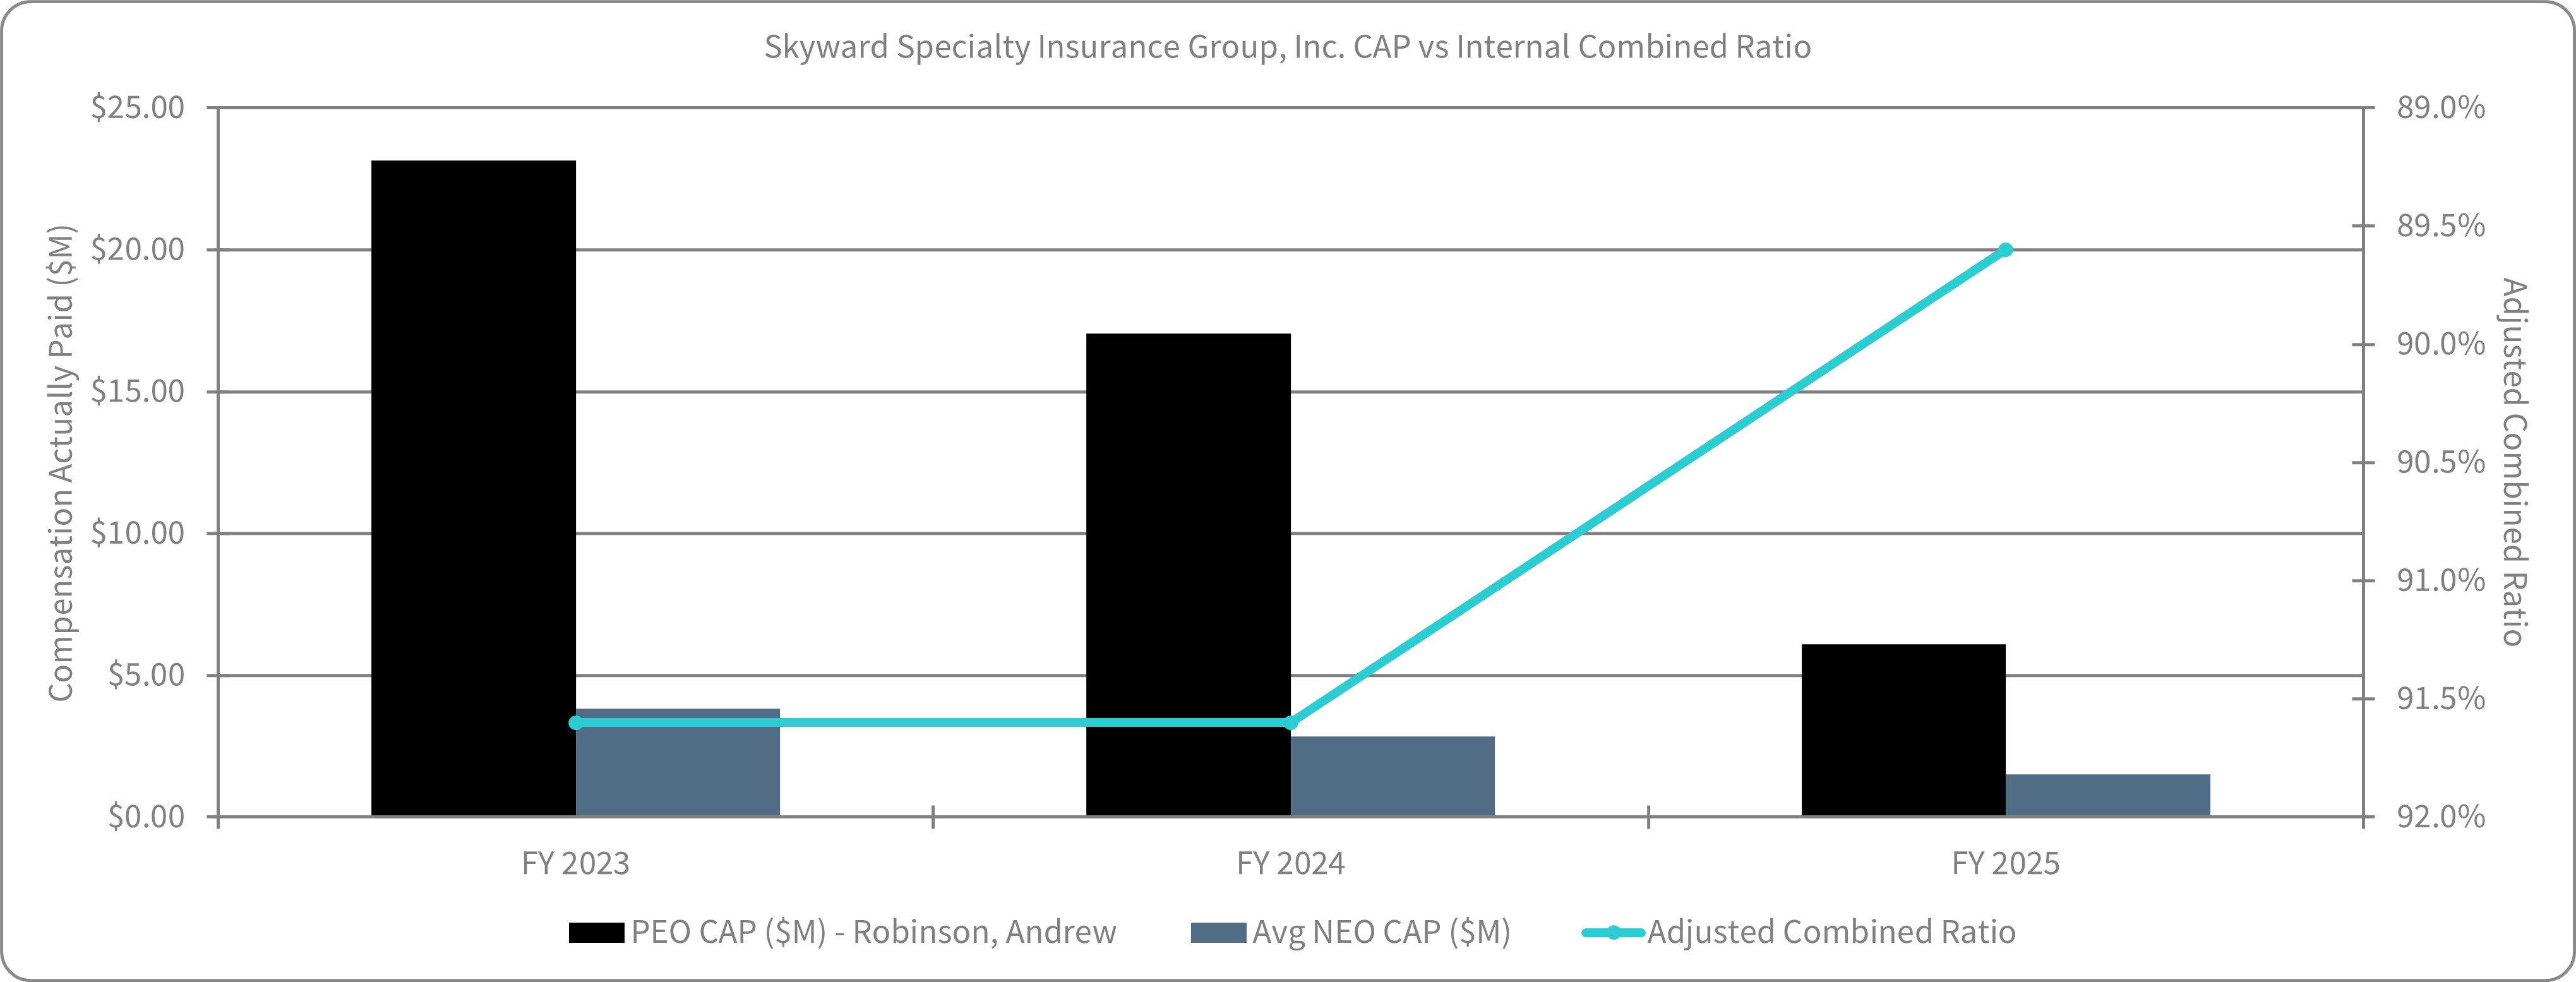
The following graph compares the compensation actually paid to our PEO and the average of the compensation actually paid to our remaining NEOs as a result of our Internal Combined Ratio performance.
| Measure | ||
| Internal Combined Ratio | ||
| Gross Written Premiums | ||
| Growth in Book Value Per Share | ||
| Absolute Stock Price | ||
(2) Reflects compensation amounts reported in the “Total” column of the Summary Compensation Table (“SCT”) for the CEO and the average of the compensation amounts reported in the "Total" column of the SCT for the Non-PEO NEOs.