Pay vs Performance Disclosure - USD ($)
|
12 Months Ended |
Dec. 31, 2025 |
Dec. 31, 2024 |
Dec. 31, 2023 |
Dec. 31, 2022 |
Dec. 31, 2021 |
| Pay vs Performance Disclosure |
|
|
|
|
|
| Pay vs Performance Disclosure, Table |
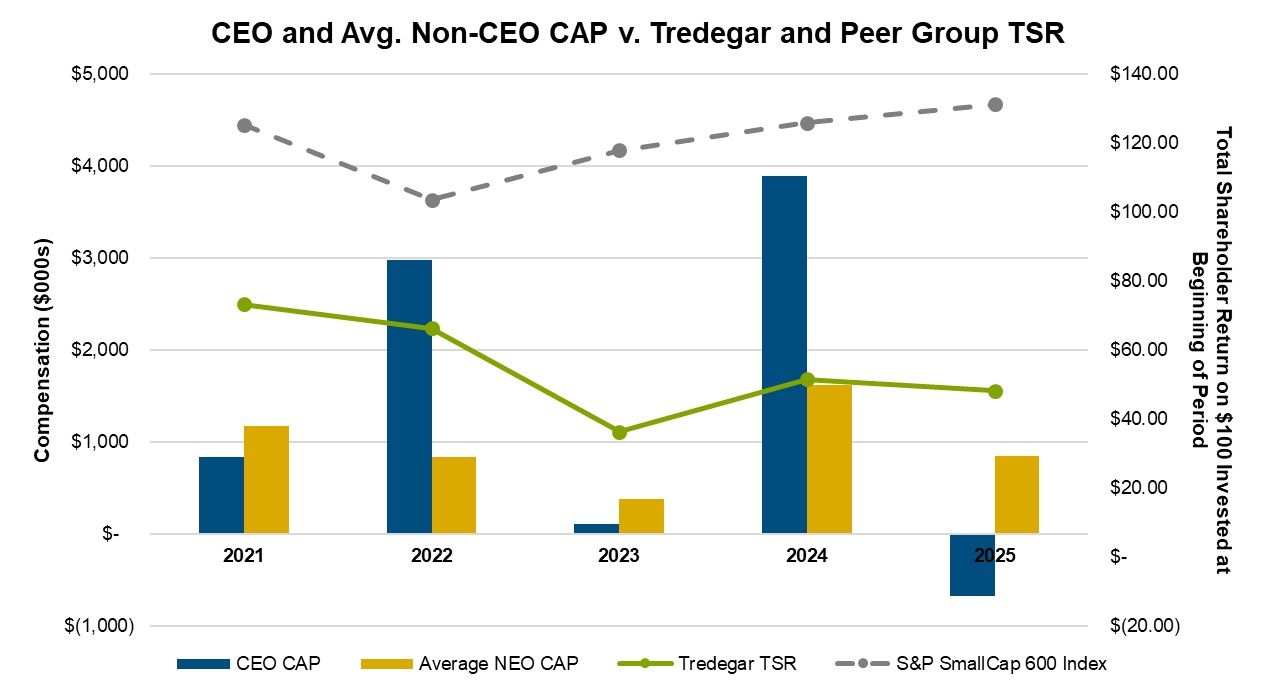
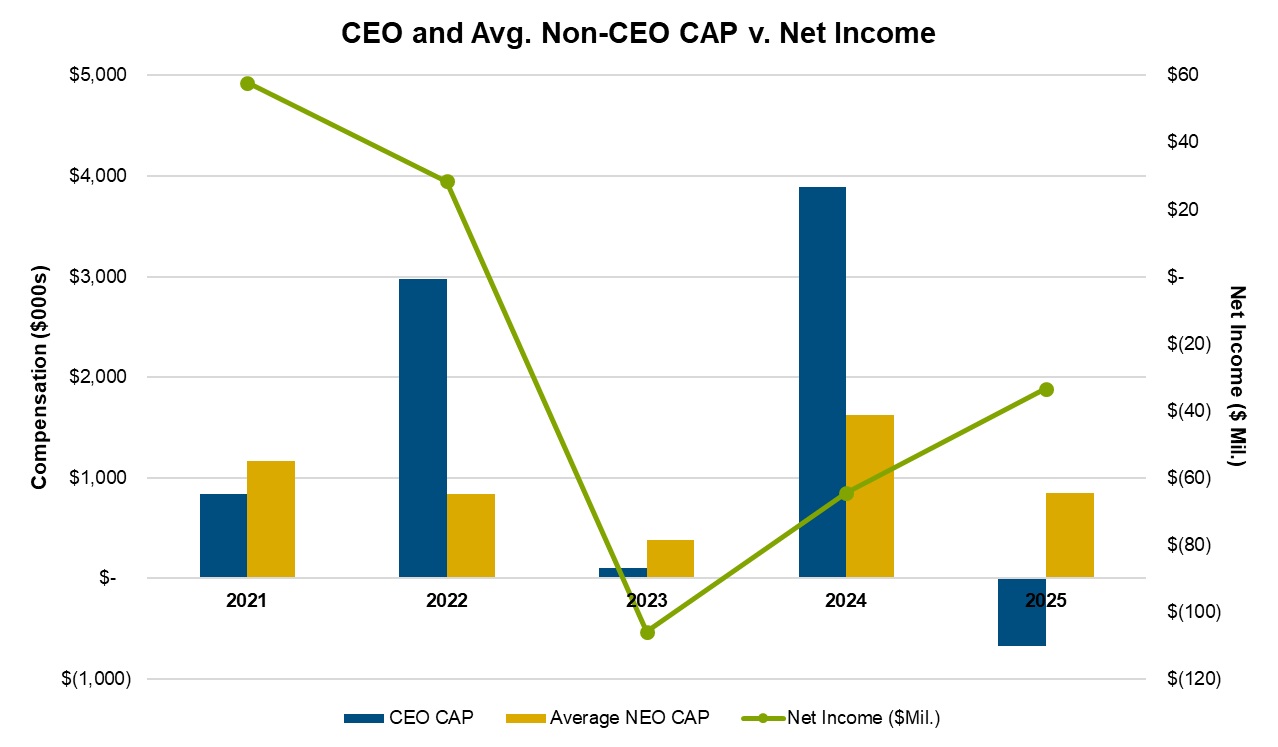
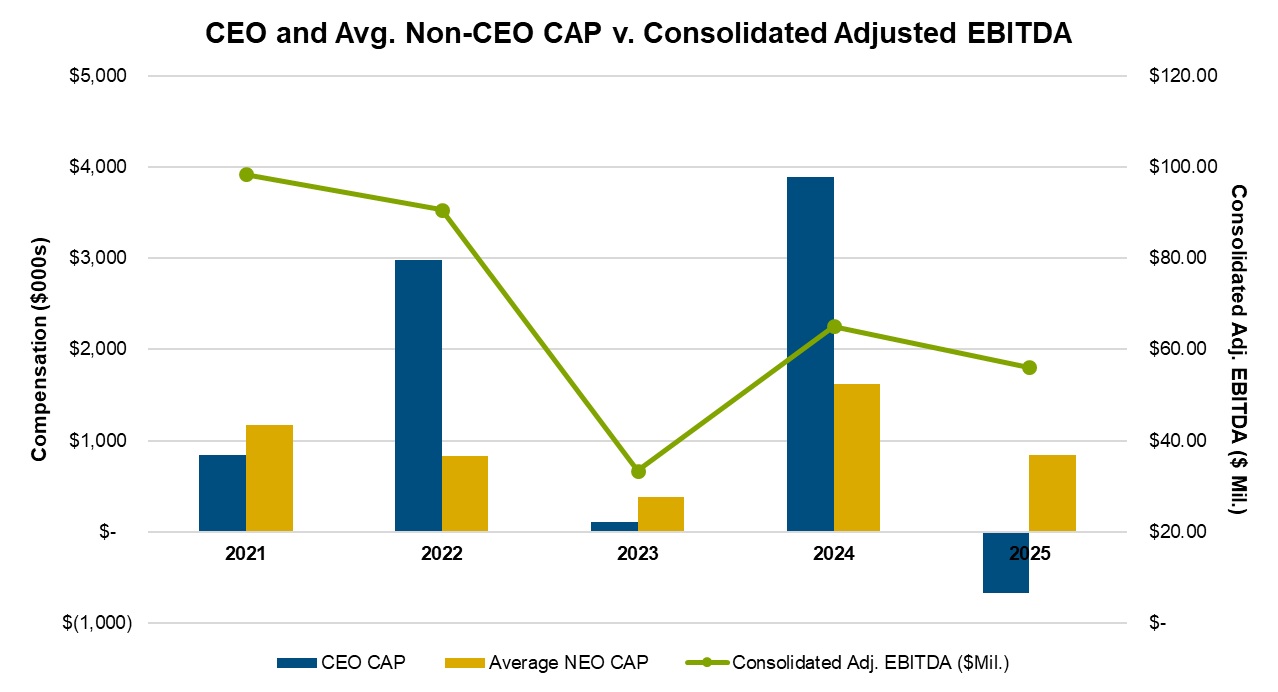
| | | | | | | | | | | | | | | | | | | | | | | | | | | | | | | | Value of Initial Fixed $100 Investment Based On: | | | | Year | Summary Compensation Table Total for CEO(1) | Compensation Actually Paid to CEO(2)(3) | Average Summary Compensa-tion Table Total for Non-CEO NEOs(1)(4) | Average Compensation Actually Paid to Non-CEO NEOs(1)(2)(3)(4) | Tredegar Corporation | S&P SmallCap 600 Index | Net Income
(in millions) | Consolidated Adjusted EBITDA (in millions)(5) | | (a) | (b) | (c) | (d) | (e) | (f) | (g) | (h) | (i) | | 2025 | $984,438 | $(670,118) | $1,320,264 | $847,739 | $48.20 | $131.18 | $(33) | $56 | | 2024 | $3,552,093 | $3,892,294 | $1,499,239 | $1,618,549 | $51.55 | $125.85 | $(65) | $65 | | 2023 | $1,902,939 | $105,227 | $869,974 | $385,321 | $36.31 | $117.81 | $(106) | $33 | | 2022 | $3,362,131 | $2,977,839 | $1,172,140 | $834,135 | $66.23 | $103.45 | $29 | $91 | | 2021 | $3,673,092 | $839,896 | $1,698,752 | $1,170,165 | $73.25 | $125.27 | $58 | $98 |
|
|
|
|
|
| Company Selected Measure Name |
Consolidated Adjusted EBITDA
|
|
|
|
|
| Named Executive Officers, Footnote |
Non-CEO NEOs reflect the average Summary Compensation Table total compensation and average Compensation Actually Paid for the following executives by year: 2025: D. Andrew Edwards, Kevin Donnelly 2024: D. Andrew Edwards, Kevin Donnelly 2023: D. Andrew Edwards, Kevin Donnelly 2022: D. Andrew Edwards, Kevin Donnelly 2021: D. Andrew Edwards, Kevin Donnelly
|
|
|
|
|
| PEO Total Compensation Amount |
$ 984,438
|
$ 3,552,093
|
$ 1,902,939
|
$ 3,362,131
|
$ 3,673,092
|
| PEO Actually Paid Compensation Amount |
$ (670,118)
|
3,892,294
|
105,227
|
2,977,839
|
839,896
|
| Adjustment To PEO Compensation, Footnote |
The numbers in this column have been revised from the numbers previously reported in last year's "Pay Versus Performance Disclosure" in order to correct an administrative error.Deductions from, and additions to, total compensation in the Summary Compensation Table by year to calculate Compensation Actually Paid consist of: | | | | | | | | | | 2025 | | John Steitz | Average Non-CEO NEOs | | Total Compensation from Summary Compensation Table | $984,438 | $1,320,264 | | Adjustments for Equity Awards | | | | Adjustment for grant date values in the Summary Compensation Table | — | $(543,773) | | Year-end fair value of unvested awards granted in the current year | — | $229,710 | | Year-over-year difference of year-end fair values for unvested awards granted in prior years | $(37,500) | $(9,958) | | Fair values at vest date for awards granted and vested in current year | — | — | | Difference in fair values between prior year-end fair values and vest date fair values for awards granted in prior years | $35,250 | $2,487 | | Forfeitures during current year equal to prior year-end fair value | $(1,652,306) | $(150,993) | | Dividends or dividend equivalents not otherwise included in the total compensation | — | — | | Total Adjustments for Equity Awards | $(1,654,556) | $(472,525) | | Compensation Actually Paid (as calculated) | $(670,118) | $847,739 |
|
|
|
|
|
| Non-PEO NEO Average Total Compensation Amount |
$ 1,320,264
|
1,499,239
|
869,974
|
1,172,140
|
1,698,752
|
| Non-PEO NEO Average Compensation Actually Paid Amount |
$ 847,739
|
1,618,549
|
385,321
|
834,135
|
1,170,165
|
| Adjustment to Non-PEO NEO Compensation Footnote |
Deductions from, and additions to, total compensation in the Summary Compensation Table by year to calculate Compensation Actually Paid consist of: | | | | | | | | | | 2025 | | John Steitz | Average Non-CEO NEOs | | Total Compensation from Summary Compensation Table | $984,438 | $1,320,264 | | Adjustments for Equity Awards | | | | Adjustment for grant date values in the Summary Compensation Table | — | $(543,773) | | Year-end fair value of unvested awards granted in the current year | — | $229,710 | | Year-over-year difference of year-end fair values for unvested awards granted in prior years | $(37,500) | $(9,958) | | Fair values at vest date for awards granted and vested in current year | — | — | | Difference in fair values between prior year-end fair values and vest date fair values for awards granted in prior years | $35,250 | $2,487 | | Forfeitures during current year equal to prior year-end fair value | $(1,652,306) | $(150,993) | | Dividends or dividend equivalents not otherwise included in the total compensation | — | — | | Total Adjustments for Equity Awards | $(1,654,556) | $(472,525) | | Compensation Actually Paid (as calculated) | $(670,118) | $847,739 |
|
|
|
|
|
| Compensation Actually Paid vs. Total Shareholder Return |
|
|
|
|
|
| Compensation Actually Paid vs. Net Income |
|
|
|
|
|
| Compensation Actually Paid vs. Company Selected Measure |
|
|
|
|
|
| Total Shareholder Return Vs Peer Group |
|
|
|
|
|
| Tabular List, Table |
Consolidated Adjusted EBITDA; ●Relative Total Shareholder Return; and ●Stock price.
|
|
|
|
|
| Total Shareholder Return Amount |
$ 48.20
|
51.55
|
36.31
|
66.23
|
73.25
|
| Peer Group Total Shareholder Return Amount |
131.18
|
125.85
|
117.81
|
103.45
|
125.27
|
| Net Income (Loss) |
$ (33,000,000)
|
$ (65,000,000)
|
$ (106,000,000)
|
$ 29,000,000
|
$ 58,000,000
|
| Company Selected Measure Amount |
56,000,000
|
65,000,000
|
33,000,000
|
91,000,000
|
98,000,000
|
| Additional 402(v) Disclosure |
Equity valuation assumptions for calculating Compensation Actually Paid are not materially different from grant date valuation assumptions.
|
|
|
|
|
| Measure:: 1 |
|
|
|
|
|
| Pay vs Performance Disclosure |
|
|
|
|
|
| Name |
Consolidated Adjusted EBITDA
|
|
|
|
|
| Non-GAAP Measure Description |
Consolidated Adjusted EBITDA from ongoing operations is a non-GAAP financial measure. Consolidated Adjusted EBITDA excludes unusual items and losses associated with plant shutdowns, asset impairments, restructurings, gains and losses from the sale of assets, investment write-downs and write-ups, gains and losses from non-manufacturing operations, stock option charges under ASC Topic 718, discontinued operations and other items that may be recognized or accrued under GAAP.
|
|
|
|
|
| Measure:: 2 |
|
|
|
|
|
| Pay vs Performance Disclosure |
|
|
|
|
|
| Name |
Relative Total Shareholder Return
|
|
|
|
|
| Measure:: 3 |
|
|
|
|
|
| Pay vs Performance Disclosure |
|
|
|
|
|
| Name |
Stock price
|
|
|
|
|
| PEO |
|
|
|
|
|
| Pay vs Performance Disclosure |
|
|
|
|
|
| Adjustment to Compensation, Amount |
$ (1,654,556)
|
|
|
|
|
| PEO | Aggregate Grant Date Fair Value of Equity Award Amounts Reported in Summary Compensation Table |
|
|
|
|
|
| Pay vs Performance Disclosure |
|
|
|
|
|
| Adjustment to Compensation, Amount |
0
|
|
|
|
|
| PEO | Year-end Fair Value of Equity Awards Granted in Covered Year that are Outstanding and Unvested |
|
|
|
|
|
| Pay vs Performance Disclosure |
|
|
|
|
|
| Adjustment to Compensation, Amount |
0
|
|
|
|
|
| PEO | Year-over-Year Change in Fair Value of Equity Awards Granted in Prior Years That are Outstanding and Unvested |
|
|
|
|
|
| Pay vs Performance Disclosure |
|
|
|
|
|
| Adjustment to Compensation, Amount |
(37,500)
|
|
|
|
|
| PEO | Vesting Date Fair Value of Equity Awards Granted and Vested in Covered Year |
|
|
|
|
|
| Pay vs Performance Disclosure |
|
|
|
|
|
| Adjustment to Compensation, Amount |
0
|
|
|
|
|
| PEO | Change in Fair Value as of Vesting Date of Prior Year Equity Awards Vested in Covered Year |
|
|
|
|
|
| Pay vs Performance Disclosure |
|
|
|
|
|
| Adjustment to Compensation, Amount |
35,250
|
|
|
|
|
| PEO | Prior Year End Fair Value of Equity Awards Granted in Any Prior Year that Fail to Meet Applicable Vesting Conditions During Covered Year |
|
|
|
|
|
| Pay vs Performance Disclosure |
|
|
|
|
|
| Adjustment to Compensation, Amount |
(1,652,306)
|
|
|
|
|
| PEO | Dividends or Other Earnings Paid on Equity Awards not Otherwise Reflected in Total Compensation for Covered Year |
|
|
|
|
|
| Pay vs Performance Disclosure |
|
|
|
|
|
| Adjustment to Compensation, Amount |
0
|
|
|
|
|
| Non-PEO NEO |
|
|
|
|
|
| Pay vs Performance Disclosure |
|
|
|
|
|
| Adjustment to Compensation, Amount |
(472,525)
|
|
|
|
|
| Non-PEO NEO | Aggregate Grant Date Fair Value of Equity Award Amounts Reported in Summary Compensation Table |
|
|
|
|
|
| Pay vs Performance Disclosure |
|
|
|
|
|
| Adjustment to Compensation, Amount |
(543,773)
|
|
|
|
|
| Non-PEO NEO | Year-end Fair Value of Equity Awards Granted in Covered Year that are Outstanding and Unvested |
|
|
|
|
|
| Pay vs Performance Disclosure |
|
|
|
|
|
| Adjustment to Compensation, Amount |
229,710
|
|
|
|
|
| Non-PEO NEO | Year-over-Year Change in Fair Value of Equity Awards Granted in Prior Years That are Outstanding and Unvested |
|
|
|
|
|
| Pay vs Performance Disclosure |
|
|
|
|
|
| Adjustment to Compensation, Amount |
(9,958)
|
|
|
|
|
| Non-PEO NEO | Vesting Date Fair Value of Equity Awards Granted and Vested in Covered Year |
|
|
|
|
|
| Pay vs Performance Disclosure |
|
|
|
|
|
| Adjustment to Compensation, Amount |
0
|
|
|
|
|
| Non-PEO NEO | Change in Fair Value as of Vesting Date of Prior Year Equity Awards Vested in Covered Year |
|
|
|
|
|
| Pay vs Performance Disclosure |
|
|
|
|
|
| Adjustment to Compensation, Amount |
2,487
|
|
|
|
|
| Non-PEO NEO | Prior Year End Fair Value of Equity Awards Granted in Any Prior Year that Fail to Meet Applicable Vesting Conditions During Covered Year |
|
|
|
|
|
| Pay vs Performance Disclosure |
|
|
|
|
|
| Adjustment to Compensation, Amount |
(150,993)
|
|
|
|
|
| Non-PEO NEO | Dividends or Other Earnings Paid on Equity Awards not Otherwise Reflected in Total Compensation for Covered Year |
|
|
|
|
|
| Pay vs Performance Disclosure |
|
|
|
|
|
| Adjustment to Compensation, Amount |
$ 0
|
|
|
|
|