| (3) | ||||||||
| Year | SCT
Total Compensation for PEO(1) |
Compensation Actually Paid to PEO(5) |
Average SCT Total Compensation, Non-PEO NEOs(1)(2) |
Average Compensation Actually Paid to Non-PEO NEOs(5) |
Value
of initial fixed $100 investment based on: |
Net Income |
Adjusted Operating Income(4) | |
| Autoliv TSR |
Peer Group TSR(3) | |||||||
| 2025 | $4,784,548 | $5,754,761 | $2,293,635 | $2,598,390 | $148 | $74 | $736M | $1,114M |
| 2024 | $3,723,999 | $3,590,250 | $1,542,439 | $1,483,879 | $113 | $65 | $648M | $1,007M |
| 2023 | $3,960,926 | $5,260,000 | $1,566,232 | $1,715,452 | $130 | $86 | $489M | $920M |
| 2022 | $2,857,991 | $1,312,652 | $1,201,076 | $789,617 | $88 | $87 | $425M | $598M |
| 2021 | $3,237,849 | $3,361,904 | $1,255,520 | $1,273,514 | $115 | $120 | $437M | $683M |
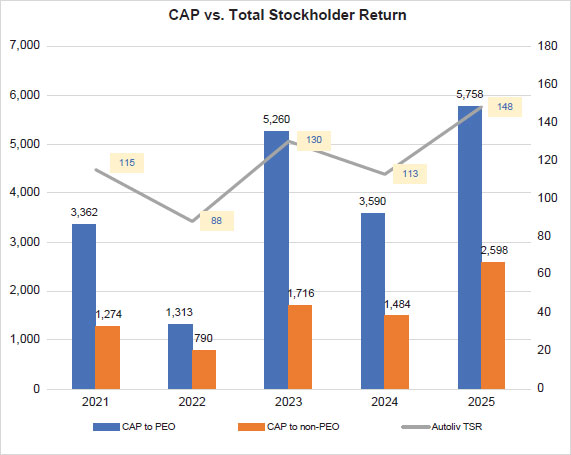
The following chart shows the correlation between CAP to our CEO and average CAP to our non-PEO NEOs in comparison to Autoliv’s cumulative TSR. A significant part of our NEOs compensation structure is stock based and changes in TSR thus have a strong correlation with CAP. During the measurement period, each year with reduction in TSR resulted in reduction in CAP, and vice versa.
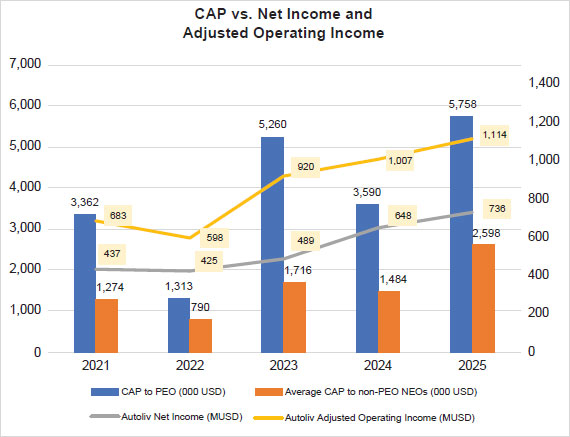
CAP VS. NET INCOME and ADJUSTED OPERATING INCOME
The following chart shows the correlation between CAP to our CEO and average CAP to our non-PEO NEOs in comparison to Autoliv’s Net Income and Adjusted Operating Income.
| ■ | Adjusted Operating Income represents 50% of the performance criteria of our annual non-equity incentive program while Earnings per Share, which is directly linked to our Net Income, represents 60% of the performance criteria related to our PSUs. Autoliv’s positive performance in both performance measures significantly affected the CAP levels. |
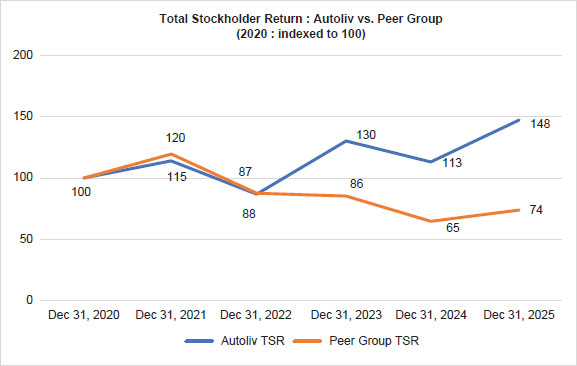
The following chart shows Autoliv’s cumulative TSR in comparison to the cumulative TSR of our selected peer group. The peer group selected for purposes of this disclosure is the Dow Jones U.S. Auto Parts Index (DJUSA-DJX), which is float market capitalization-weighted and aims to provide 95% market capitalization coverage of U.S.-traded stocks for the Auto Parts Subsection (3355). The companies included in the index are Tier 1 and Tier 2 suppliers of non-safety products to the automotive industry and are producers of very different offerings such as drivetrains, electronic and technology systems, fuel systems and many have after-market businesses. This index includes several companies included in our compensation benchmarking for our U.S. based executives.
TABULAR DISCLOSURE OF MOST IMPORTANT MEASURES LINKING CAP TO COMPANY PERFORMANCE
| Adjusted Operating Income | Relative Organic Sales Growth |
| Adjusted Cash Conversion | Greenhouse Gas Emissions |
| Adjusted Earnings Per Share (EPS) | |
| ■ | EPS, Relative Organic Sales Growth (Autoliv’s sales in relation to Light Vehicle Production Growth) and Greenhouse Gas Emissions have been the selected metrics for our PSU awards since 2022. In addition, Autoliv’s annual short-term incentive program has been based on performance related to Adjusted Operating Income and Adjusted Cash Conversion for several years. |
| ■ | Adjusted Cash Conversion converts profit into cash, allowing the company to reduce risk, support growth and strengthen the balance sheet. Availability of cash and a good liquidity allow the company to invest for the future and is vital for Autoliv to remain competitive and operate in a sustainable and efficient way. |
| ■ | Adjusted Operating Income is the general result of revenues minus costs related to the company’s operations. Adjusted Operating Income and Adjusted EPS are two critical KPIs for the company’s long-term success and for Autoliv to be able to provide value to its stockholders. Organic Sales Growth also supports this by increasing the top line and creating opportunity for increased profits. |
| ■ | The reduction of Greenhouse Gas Emissions supports the company’s long-term sustainability agenda and is critical for Autoliv to remain relevant and to deliver on the company’s overall vision of Saving More Lives. |
| [1] | The “SCT Total Compensation” figures provided in the table above for 2021 to 2024 do not match the total compensation figures provided in the SCT of this proxy statement. In the SCT table provided on page 57, we have converted the compensation paid in prior years by the same exchange rate we applied for 2025 to facilitate comparison across years as described in the footnotes to the table. Instead, the compensation figures in the table above are directly taken from each year’s respective proxy statement and reflect the actual USD compensation paid to make comparison of pay versus performance more meaningful. |
| [2] | The dollar amounts reported as CAP to the PEO and the Non-PEO NEOs, respectively, are computed in accordance with Item 402(v) of Regulation S-K. The dollar amounts do not reflect the actual amount of compensation earned by or paid to the PEO or the Non-PEO NEOs, respectively, during the applicable year. In calculating the CAP, the following amounts were deducted from and added to the SCT total compensation: |
| [3] | The Non-PEO NEOs reflected in the above table are the NEOs for each covered year as follows: 2021: Fredrik Westin, Frithjof Oldorff, Colin Naughton, Kevin Fox, and Jennifer Cheng; 2022: Fredrik Westin, Sng Yih, Frithjof Oldorff, and Anthony Nellis; 2023: Fredrik Westin, Sng Yih, Anthony Nellis, Kevin Fox, and Frithjof Oldorff; 2024 and 2025: Fredrik Westin, Magnus Jarlegren, Kevin Fox, and Anthony Nellis. |
| [4] | Represents peer group TSR, weighted according to the respective companies’ stock market capitalization at the beginning of each period for which a return is indicated. The peer group selected for purposes of this table is the Dow Jones U.S. Auto Parts Index, which is the industry peer group used in our Annual Report on Form 10-K for the fiscal year ended December 31, 2025 (see notes below for further details). |
| [5] | We have identified the “company selected measure” as Adjusted Operating Income because it constitutes 50% of the performance criteria used to calculate our annual short-term incentives payable to our NEOs. Adjusted Operating Income is calculated as provided in Annex A. |
| [6] | Represents the grant date fair value of stock-based awards granted in each year, as reported in the “Stock Awards” column of the SCT. |
| [7] | Represents amounts reported in the “Change in Pension and Nonqualified Deferred Compensation” column of the SCT, where applicable. |
| [8] | Represents the value of equity awards, calculated in accordance with the SEC rules for determining CAP for each respective year, as further detailed in the tables below. |
| [9] | Represents the pension benefit adjustments, where applicable, calculated in accordance with SEC rules for determining CAP for each respective year. Total pension benefit adjustments are equal to the “service costs” incurred during the relevant period. No “prior service costs” were incurred as no modifications were made to the pension plan during the relevant period. |