Pay vs Performance Disclosure - USD ($)
Jan. 03, 2026
Dec. 28, 2024
Dec. 30, 2023
Dec. 31, 2022
Jan. 01, 2022
Pay versus Performance
Pursuant to Item 402(v) of Regulation S-K, the Corporation provides the following disclosure regarding executive compensation for the CEO, who is the principal executive officer, and the non-CEO Named Executive Officers (“NEOs”), as well as certain performance measures and results for its five most recent fiscal years. The Compensation Committee did not consider the pay versus performance disclosure below in making its pay decisions for any of the fiscal years presented. See the CD&A, which begins on page 28, for information about the pay decisions made with respect to NEO compensation for the most recent fiscal year.
Year | Summary Compensation Table Total for CEO (1) | Compensation Actually Paid (CAP) to CEO (2) | Average Summary Compensation Table Total for Non-CEO Named Executive Officers (1) | Average Compensation Actually Paid (CAP) for Non- CEO Named Executive Officers (2) | Value of Initial Fixed $100 Investment Based on: | Net Income ($000) (4) | Company- Selected Performance Measure Adjusted EBIT ($000) (5) | |||||||||||||||||||
Total Shareholder Return (3) | Peer Group Total Shareholder Return (3) | |||||||||||||||||||||||||
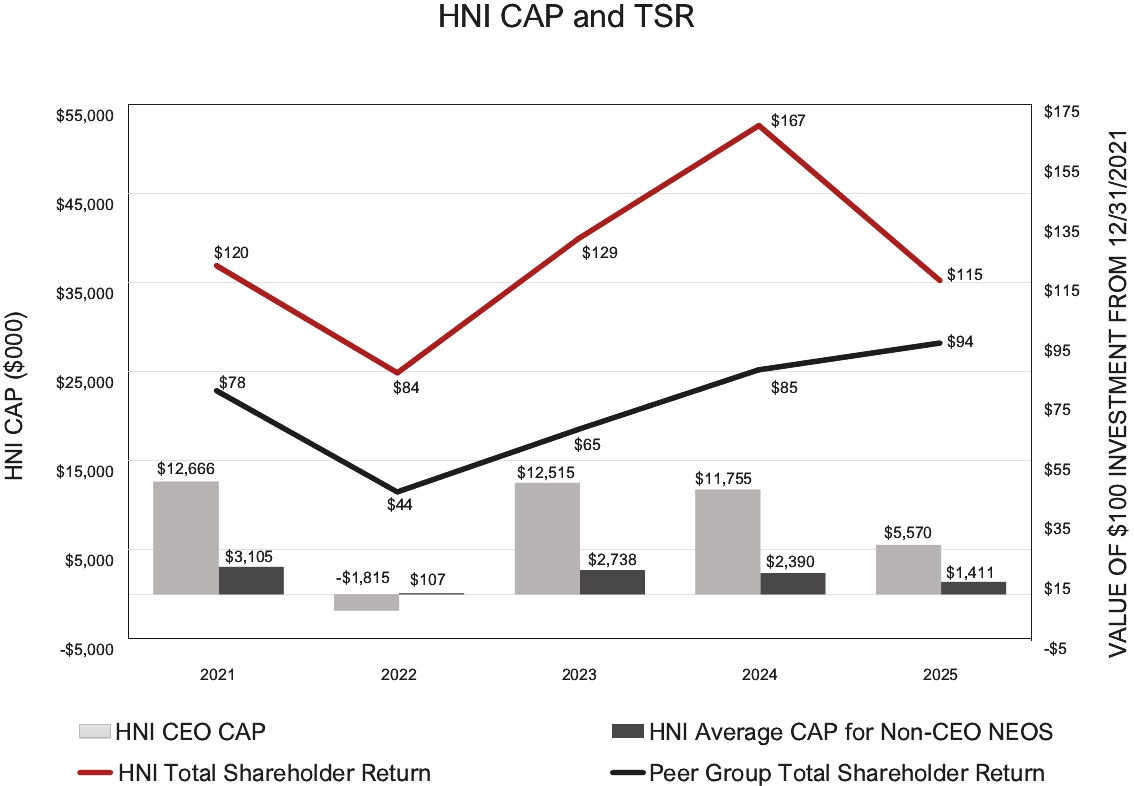
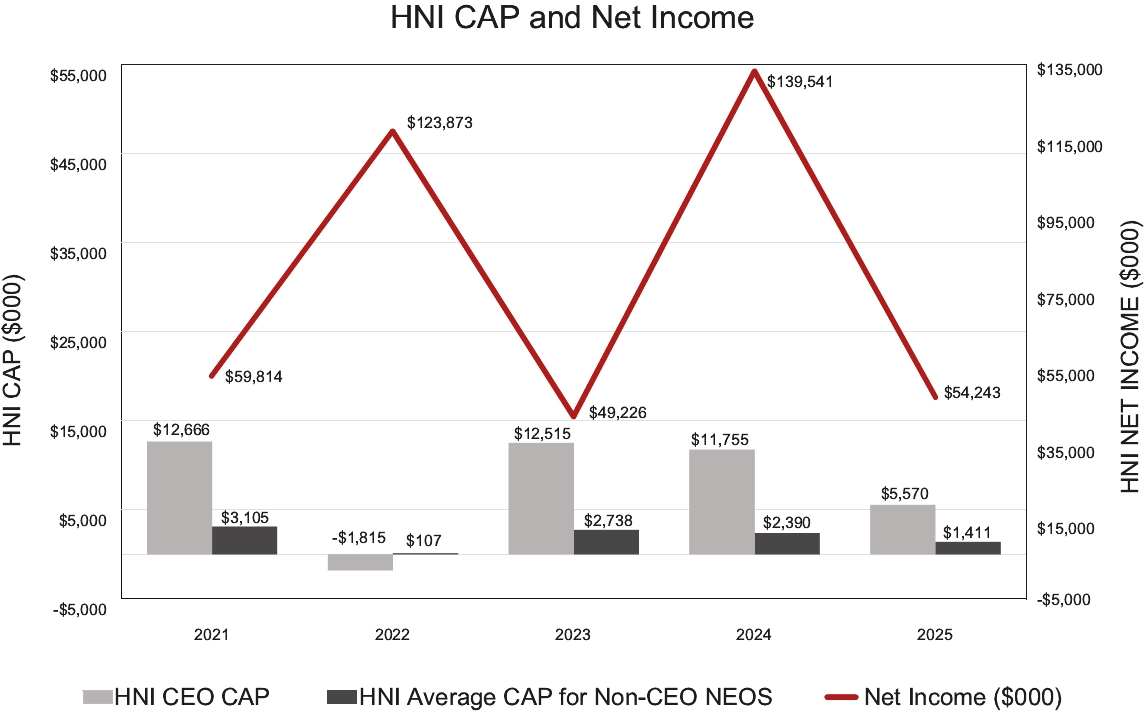
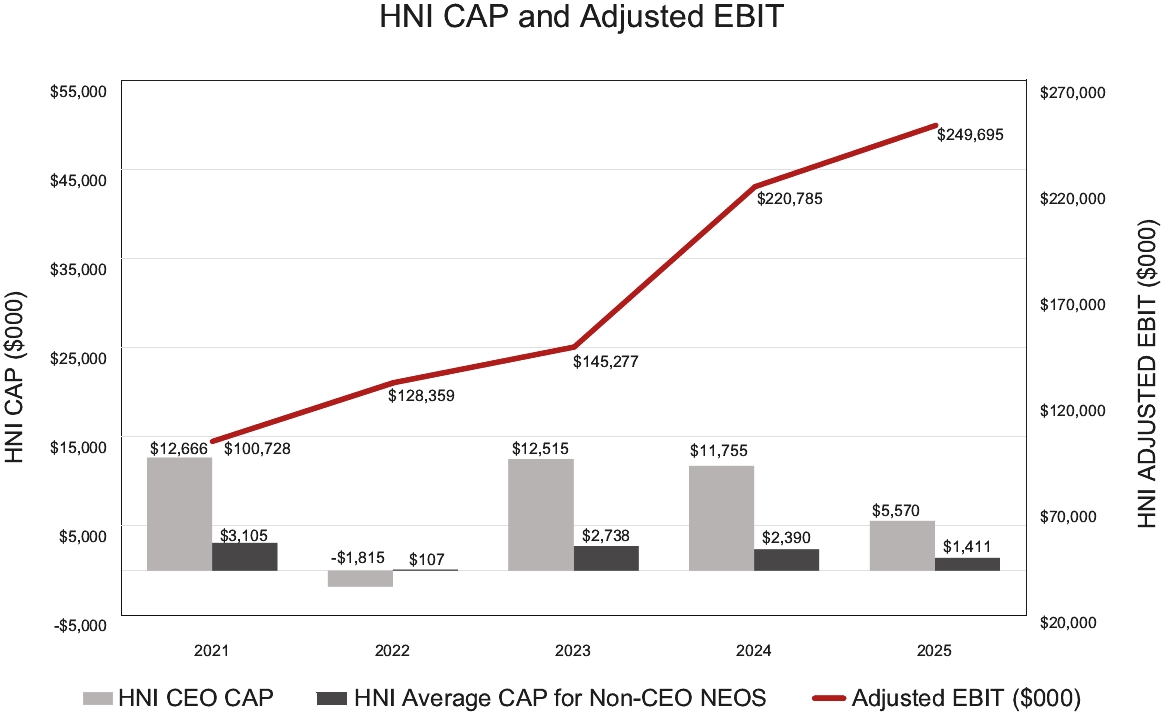
2025 | 8,218,947 | 5,569,589 | 1,735,472 | 1,410,781 | 115 | 94 | 54,243 | 249,695 | ||||||||||||||||||
2024 | 7,060,819 | 11,755,485 | 1,637,707 | 2,389,792 | 167 | 85 | 139,541 | 220,785 | ||||||||||||||||||
2023 | 7,102,944 | 12,515,492 | 1,781,035 | 2,738,287 | 129 | 65 | 49,226 | 145,277 | ||||||||||||||||||
2022 | 5,675,554 | (1,815,166) | 1,405,252 | 106,684 | 84 | 44 | 123,873 | 128,359 | ||||||||||||||||||
2021 | 9,132,815 | 12,666,026 | 2,352,863 | 3,104,883 | 120 | 78 | 59,814 | 100,728 | ||||||||||||||||||
Notes
1. | For each year shown, the CEO was Mr. Lorenger. For 2025, the other NEOs were Mr. Berger, Mr. Bradford, Mr. Bullock, and Mr. Hagedorn. For 2024 and 2023, the other NEOs were Marshall H. Bridges, Mr. Berger, Mr. Bradford, and Mr. Bullock. For 2022, the other NEOs were Mr. Bridges, Mr. Berger, Mr. Bradford, Mr. Bullock, and Kurt A. Tjaden. For 2021, the other NEOs were Mr. Bridges, Mr. Berger, Mr. Bradford, and Mr. Tjaden. The values reflected in this column reflect the “Total” compensation set forth in the Summary Compensation Table (SCT) for each applicable year. See the footnotes to the SCT for further detail regarding the amounts in this column. |
2. | Calculated in accordance with Item 402(v) of Regulation S-K. Compensation actually paid (“CAP”) is defined under SEC rules and computed by subtracting the amounts in the “Stock Awards” and “Option Awards” columns of the SCT for each year from the “Total” column of the SCT and then making the equity award adjustments described below, all of which are computed in a manner consistent with the fair value methodology used to account for share-based payments in the Company’s GAAP financial statements. The following tables reflect the adjustments made to SCT total compensation to compute CAP for the CEO and average CAP for the other NEOs. |
CEO
SCT Total Comp | SCT Equity Awards | Equity Award Adjustments (a) | CAP | |||||||||||
2025 | 8,218,947 | (5,092,316) | 2,442,958 | 5,569,589 | ||||||||||
2024 | 7,060,819 | (4,429,015) | 9,123,681 | 11,755,485 | ||||||||||
2023 | 7,102,944 | (3,553,470) | 8,966,018 | 12,515,492 | ||||||||||
2022 | 5,675,554 | (3,399,987) | (4,090,733) | (1,815,166) | ||||||||||
2021 | 9,132,815 | (6,783,691) | 10,316,902 | 12,666,026 | ||||||||||
Other Named Executive Officers (Average)
SCT Total Comp | SCT Equity Awards | Equity Award Adjustments (a) | CAP | |||||||||||
2025 | 1,735,472 | (598,531) | 273,841 | 1,410,781 | ||||||||||
2024 | 1,637,707 | (616,716) | 1,368,801 | 2,389,792 | ||||||||||
2023 | 1,781,035 | (593,461) | 1,550,714 | 2,738,287 | ||||||||||
2022 | 1,405,252 | (453,537) | (845,031) | 106,684 | ||||||||||
2021 | 2,352,863 | (1,362,756) | 2,114,776 | 3,104,883 | ||||||||||
a. | The equity award adjustments for each applicable year include the addition (or subtraction, as applicable) of the following: (i) the year-end fair value of any equity awards granted in the applicable year that are outstanding and unvested as of the end of the year; (ii) the amount of change in fair value as of the end of the applicable year (from the end of the prior fiscal year) of any awards granted in prior years that are outstanding and unvested as of the end of the applicable year; (iii) for awards granted in prior years that vest in the applicable year, the amount equal to the change in fair value as of the vesting date (from the end of the prior fiscal year); (iv) for awards granted in prior years that are determined to fail to meet the applicable vesting conditions during the applicable year, a deduction for the amount equal to the fair value at the end of the prior fiscal year; and (v) the value of dividends or other earnings paid on stock or option awards not otherwise reflected in fair value or total compensation. The amounts deducted or added in calculating the equity award adjustments are as follows: |
CEO
YE Fair Value of Equity Awards Granted During the Year | Year Over Year Change in Fair Value of Outstanding and Unvested Equity Awards | Change in Fair Value of Equity Awards Granted in Prior Years That Vested in the Year | Fair Value at the End of the Prior Year of Equity Awards That Failed to Meet Vesting Conditions in the Year | Value of Dividends Paid on Equity Awards Not Otherwise Reflected In Fair Value or Total Compensation | Total Equity Award Adjustments | |||||||||||||||
2025 | 4,495,767 | (2,094,333) | (178,055) | — | 219,579 | 2,442,958 | ||||||||||||||
2024 | 6,119,467 | 2,136,289 | 278,392 | — | 589,533 | 9,123,681 | ||||||||||||||
2023 | 6,591,071 | 3,018,854 | 446,310 | (1,192,184) | 101,967 | 8,966,018 | ||||||||||||||
2022 | 1,593,082 | (5,564,969) | (169,450) | — | 50,604 | (4,090,733) | ||||||||||||||
2021 | 8,150,404 | 2,057,167 | 92,762 | — | 16,569 | 10,316,902 | ||||||||||||||
Other Named Executive Officers (Average)
YE Fair Value of Equity Awards Granted During the Year | Year Over Year Change in Fair Value of Outstanding and Unvested Equity Awards | Change in Fair Value of Equity Awards Granted in Prior Years That Vested in the Year | Fair Value at the End of the Prior Year of Equity Awards That Failed to Meet Vesting Conditions in the Year | Value of Dividends Paid on Equity Awards Not Otherwise Reflected in Fair Value or Total Compensation | Total Equity Award Adjustments | |||||||||||||||
2025 | 529,482 | (261,618) | (23,237) | — | 29,213 | 273,841 | ||||||||||||||
2024 | 852,102 | 356,681 | 51,058 | — | 108,960 | 1,368,801 | ||||||||||||||
2023 | 1,100,768 | 560,603 | 75,157 | (203,203) | 17,388 | 1,550,714 | ||||||||||||||
2022 | 212,507 | (948,659) | 14,620 | (132,820) | 9,321 | (845,031) | ||||||||||||||
2021 | 1,637,440 | 437,900 | 36,177 | — | 3,259 | 2,114,776 | ||||||||||||||
3. | Reflects the cumulative TSR of the Corporation and the cumulative TSR of the Office Furniture Industry Group (OFIG) peer group used for the purposes of the stock performance graph in our 2025 Annual Report for the fiscal year ended December 31, 2022, the two fiscal years ended December 30, 2023, the three years ended December 28, 2024, and the four years ended January 3, 2026 assuming a $100 investment at the closing price on December 31, 2021, the last day of fiscal 2021, and the reinvestment of all dividends. The OFIG consists of MillerKnoll, Inc. and Steelcase Inc. |
4. | GAAP Net Income as disclosed in our Annual Report on Form 10-K. |
5. | See the CD&A, which begins on page 28, for a description of the manner in which the Corporation has calculated Adjusted EBIT from its audited financial statements. |
1. | For each year shown, the CEO was Mr. Lorenger. For 2025, the other NEOs were Mr. Berger, Mr. Bradford, Mr. Bullock, and Mr. Hagedorn. For 2024 and 2023, the other NEOs were Marshall H. Bridges, Mr. Berger, Mr. Bradford, and Mr. Bullock. For 2022, the other NEOs were Mr. Bridges, Mr. Berger, Mr. Bradford, Mr. Bullock, and Kurt A. Tjaden. For 2021, the other NEOs were Mr. Bridges, Mr. Berger, Mr. Bradford, and Mr. Tjaden. The values reflected in this column reflect the “Total” compensation set forth in the Summary Compensation Table (SCT) for each applicable year. See the footnotes to the SCT for further detail regarding the amounts in this column. |
3. | Reflects the cumulative TSR of the Corporation and the cumulative TSR of the Office Furniture Industry Group (OFIG) peer group used for the purposes of the stock performance graph in our 2025 Annual Report for the fiscal year ended December 31, 2022, the two fiscal years ended December 30, 2023, the three years ended December 28, 2024, and the four years ended January 3, 2026 assuming a $100 investment at the closing price on December 31, 2021, the last day of fiscal 2021, and the reinvestment of all dividends. The OFIG consists of MillerKnoll, Inc. and Steelcase Inc. |
2. | Calculated in accordance with Item 402(v) of Regulation S-K. Compensation actually paid (“CAP”) is defined under SEC rules and computed by subtracting the amounts in the “Stock Awards” and “Option Awards” columns of the SCT for each year from the “Total” column of the SCT and then making the equity award adjustments described below, all of which are computed in a manner consistent with the fair value methodology used to account for share-based payments in the Company’s GAAP financial statements. The following tables reflect the adjustments made to SCT total compensation to compute CAP for the CEO and average CAP for the other NEOs. |
CEO
SCT Total Comp | SCT Equity Awards | Equity Award Adjustments (a) | CAP | |||||||||||
2025 | 8,218,947 | (5,092,316) | 2,442,958 | 5,569,589 | ||||||||||
2024 | 7,060,819 | (4,429,015) | 9,123,681 | 11,755,485 | ||||||||||
2023 | 7,102,944 | (3,553,470) | 8,966,018 | 12,515,492 | ||||||||||
2022 | 5,675,554 | (3,399,987) | (4,090,733) | (1,815,166) | ||||||||||
2021 | 9,132,815 | (6,783,691) | 10,316,902 | 12,666,026 | ||||||||||
a. | The equity award adjustments for each applicable year include the addition (or subtraction, as applicable) of the following: (i) the year-end fair value of any equity awards granted in the applicable year that are outstanding and unvested as of the end of the year; (ii) the amount of change in fair value as of the end of the applicable year (from the end of the prior fiscal year) of any awards granted in prior years that are outstanding and unvested as of the end of the applicable year; (iii) for awards granted in prior years that vest in the applicable year, the amount equal to the change in fair value as of the vesting date (from the end of the prior fiscal year); (iv) for awards granted in prior years that are determined to fail to meet the applicable vesting conditions during the applicable year, a deduction for the amount equal to the fair value at the end of the prior fiscal year; and (v) the value of dividends or other earnings paid on stock or option awards not otherwise reflected in fair value or total compensation. The amounts deducted or added in calculating the equity award adjustments are as follows: |
CEO
YE Fair Value of Equity Awards Granted During the Year | Year Over Year Change in Fair Value of Outstanding and Unvested Equity Awards | Change in Fair Value of Equity Awards Granted in Prior Years That Vested in the Year | Fair Value at the End of the Prior Year of Equity Awards That Failed to Meet Vesting Conditions in the Year | Value of Dividends Paid on Equity Awards Not Otherwise Reflected In Fair Value or Total Compensation | Total Equity Award Adjustments | |||||||||||||||
2025 | 4,495,767 | (2,094,333) | (178,055) | — | 219,579 | 2,442,958 | ||||||||||||||
2024 | 6,119,467 | 2,136,289 | 278,392 | — | 589,533 | 9,123,681 | ||||||||||||||
2023 | 6,591,071 | 3,018,854 | 446,310 | (1,192,184) | 101,967 | 8,966,018 | ||||||||||||||
2022 | 1,593,082 | (5,564,969) | (169,450) | — | 50,604 | (4,090,733) | ||||||||||||||
2021 | 8,150,404 | 2,057,167 | 92,762 | — | 16,569 | 10,316,902 | ||||||||||||||
2. | Calculated in accordance with Item 402(v) of Regulation S-K. Compensation actually paid (“CAP”) is defined under SEC rules and computed by subtracting the amounts in the “Stock Awards” and “Option Awards” columns of the SCT for each year from the “Total” column of the SCT and then making the equity award adjustments described below, all of which are computed in a manner consistent with the fair value methodology used to account for share-based payments in the Company’s GAAP financial statements. The following tables reflect the adjustments made to SCT total compensation to compute CAP for the CEO and average CAP for the other NEOs. |
Other Named Executive Officers (Average)
SCT Total Comp | SCT Equity Awards | Equity Award Adjustments (a) | CAP | |||||||||||
2025 | 1,735,472 | (598,531) | 273,841 | 1,410,781 | ||||||||||
2024 | 1,637,707 | (616,716) | 1,368,801 | 2,389,792 | ||||||||||
2023 | 1,781,035 | (593,461) | 1,550,714 | 2,738,287 | ||||||||||
2022 | 1,405,252 | (453,537) | (845,031) | 106,684 | ||||||||||
2021 | 2,352,863 | (1,362,756) | 2,114,776 | 3,104,883 | ||||||||||
a. | The equity award adjustments for each applicable year include the addition (or subtraction, as applicable) of the following: (i) the year-end fair value of any equity awards granted in the applicable year that are outstanding and unvested as of the end of the year; (ii) the amount of change in fair value as of the end of the applicable year (from the end of the prior fiscal year) of any awards granted in prior years that are outstanding and unvested as of the end of the applicable year; (iii) for awards granted in prior years that vest in the applicable year, the amount equal to the change in fair value as of the vesting date (from the end of the prior fiscal year); (iv) for awards granted in prior years that are determined to fail to meet the applicable vesting conditions during the applicable year, a deduction for the amount equal to the fair value at the end of the prior fiscal year; and (v) the value of dividends or other earnings paid on stock or option awards not otherwise reflected in fair value or total compensation. The amounts deducted or added in calculating the equity award adjustments are as follows: |
Other Named Executive Officers (Average)
YE Fair Value of Equity Awards Granted During the Year | Year Over Year Change in Fair Value of Outstanding and Unvested Equity Awards | Change in Fair Value of Equity Awards Granted in Prior Years That Vested in the Year | Fair Value at the End of the Prior Year of Equity Awards That Failed to Meet Vesting Conditions in the Year | Value of Dividends Paid on Equity Awards Not Otherwise Reflected in Fair Value or Total Compensation | Total Equity Award Adjustments | |||||||||||||||
2025 | 529,482 | (261,618) | (23,237) | — | 29,213 | 273,841 | ||||||||||||||
2024 | 852,102 | 356,681 | 51,058 | — | 108,960 | 1,368,801 | ||||||||||||||
2023 | 1,100,768 | 560,603 | 75,157 | (203,203) | 17,388 | 1,550,714 | ||||||||||||||
2022 | 212,507 | (948,659) | 14,620 | (132,820) | 9,321 | (845,031) | ||||||||||||||
2021 | 1,637,440 | 437,900 | 36,177 | — | 3,259 | 2,114,776 | ||||||||||||||
Financial Performance Measures
The most important financial performance measures used by the Corporation in 2025 related to CAP based on Corporation performance are listed below.
• | Adjusted EBIT |
• | Adjusted EBITDA |
For 2025, Adjusted EBITDA and Adjusted EBIT were the only two financial performance measures utilized by the Corporation. See the CD&A, which begins on page 28, for a description of the manner in which the Corporation has calculated Adjusted EBIT and Adjusted EBITDA from its audited financial statements.
a. | The equity award adjustments for each applicable year include the addition (or subtraction, as applicable) of the following: (i) the year-end fair value of any equity awards granted in the applicable year that are outstanding and unvested as of the end of the year; (ii) the amount of change in fair value as of the end of the applicable year (from the end of the prior fiscal year) of any awards granted in prior years that are outstanding and unvested as of the end of the applicable year; (iii) for awards granted in prior years that vest in the applicable year, the amount equal to the change in fair value as of the vesting date (from the end of the prior fiscal year); (iv) for awards granted in prior years that are determined to fail to meet the applicable vesting conditions during the applicable year, a deduction for the amount equal to the fair value at the end of the prior fiscal year; and (v) the value of dividends or other earnings paid on stock or option awards not otherwise reflected in fair value or total compensation. The amounts deducted or added in calculating the equity award adjustments are as follows: |
CEO
YE Fair Value of Equity Awards Granted During the Year | Year Over Year Change in Fair Value of Outstanding and Unvested Equity Awards | Change in Fair Value of Equity Awards Granted in Prior Years That Vested in the Year | Fair Value at the End of the Prior Year of Equity Awards That Failed to Meet Vesting Conditions in the Year | Value of Dividends Paid on Equity Awards Not Otherwise Reflected In Fair Value or Total Compensation | Total Equity Award Adjustments | |||||||||||||||
2025 | 4,495,767 | (2,094,333) | (178,055) | — | 219,579 | 2,442,958 | ||||||||||||||
2024 | 6,119,467 | 2,136,289 | 278,392 | — | 589,533 | 9,123,681 | ||||||||||||||
2023 | 6,591,071 | 3,018,854 | 446,310 | (1,192,184) | 101,967 | 8,966,018 | ||||||||||||||
2022 | 1,593,082 | (5,564,969) | (169,450) | — | 50,604 | (4,090,733) | ||||||||||||||
2021 | 8,150,404 | 2,057,167 | 92,762 | — | 16,569 | 10,316,902 | ||||||||||||||
Other Named Executive Officers (Average)
YE Fair Value of Equity Awards Granted During the Year | Year Over Year Change in Fair Value of Outstanding and Unvested Equity Awards | Change in Fair Value of Equity Awards Granted in Prior Years That Vested in the Year | Fair Value at the End of the Prior Year of Equity Awards That Failed to Meet Vesting Conditions in the Year | Value of Dividends Paid on Equity Awards Not Otherwise Reflected in Fair Value or Total Compensation | Total Equity Award Adjustments | |||||||||||||||
2025 | 529,482 | (261,618) | (23,237) | — | 29,213 | 273,841 | ||||||||||||||
2024 | 852,102 | 356,681 | 51,058 | — | 108,960 | 1,368,801 | ||||||||||||||
2023 | 1,100,768 | 560,603 | 75,157 | (203,203) | 17,388 | 1,550,714 | ||||||||||||||
2022 | 212,507 | (948,659) | 14,620 | (132,820) | 9,321 | (845,031) | ||||||||||||||
2021 | 1,637,440 | 437,900 | 36,177 | — | 3,259 | 2,114,776 | ||||||||||||||