Fiscal 2025 Pay Versus Performance ("PvP")
A key principle of the Company’s compensation philosophy, incorporated throughout our compensation policies and programs, is pay for performance. The Company leverages variable pay elements tied to challenging Company goals that are aligned to the business strategy, while ensuring no adverse risk taking by offering appropriate and competitive fixed pay elements. The following tables, supporting footnotes, and narrative and graphic disclosure aim to demonstrate the link between compensation actually paid, as defined in the applicable SEC rules, for CNH NEOs to the Company’s performance, both in absolute terms and as compared to the market for the fiscal years 2025, 2024, 2023, 2022, and 2021.
Specifically, this PvP section discusses the relationship between:
Year |
SCT Total for |
CAP to |
SCT Total for |
CAP to |
Average SCT Total for non-PEO NEOs(1) |
Average CAP to non-PEO NEOs(1) |
CNH TSR(2) |
Peer Group TSR(3) |
Net Income $(4) |
Company Selected Measure: Adjusted Diluted EPS(5) |
2025 |
11,724,767 |
4,022,372 |
N/A |
N/A |
5,308,977 |
3,627,935 |
93 |
191 |
505 |
0.55 |
2024 |
19,497,596 |
22,112,448 |
3,579,162 |
(16,076,876) |
2,253,123 |
1,143,300 |
112 |
170 |
1,259 |
1.05 |
2023 |
N/A |
N/A |
18,098,605 |
(8,909,832) |
3,137,619 |
(788,144) |
115 |
149 |
2,287 |
1.63 |
2022 |
N/A |
N/A |
22,915,662 |
24,697,237 |
3,298,580 |
3,502,374 |
148 |
114 |
2,039 |
1.46 |
2021 |
N/A |
N/A |
44,804,287 |
108,388,604 |
2,782,334 |
11,403,669 |
153 |
128 |
1,801 |
1.28 |
2021-2022 |
2023 |
2024 |
2025 |
Kevin Barr |
Oddone Incisa |
Oddone Incisa |
Oddone Incisa |
Oddone Incisa |
Marc Kermisch |
Kelly Manley |
James Nickolas |
Derek Neilson |
Derek Neilson |
Stefano Pampalone |
Stefano Pampalone |
Stefano Pampalone |
Stefano Pampalone |
Roberto Russo |
Jay Schroeder |
|
|
Tom Verbaeten |
Francesco Tutino |
To calculate CAP for the PEO and NEOs, the following adjustments were made to SCT total:
2025 Adjustments |
PEO |
Average NEO |
Summary Compensation Table Total |
11,724,767 |
5,308,977 |
Deduction for amount reported in “Stock Awards” column of the Summary Compensation Table |
8,147,756 |
3,134,527 |
Addition of fair value at fiscal year (FY) end, of equity awards granted during the FY that remained outstanding |
4,606,238 |
2,230,869 |
Addition of fair value at vesting date, of equity awards granted during the FY that vested during the FY |
- |
71,256 |
Addition of change in fair value at FY end versus prior FY end for awards granted in prior FY that remained outstanding |
(5,148,640) |
(196,638) |
Addition of change in fair value at vesting date versus prior FY end for awards granted in prior FY that vested during the FY |
987,763 |
91,563 |
Deduction of the fair value at the prior FY end for awards granted in prior FY that failed to meet their vesting conditions |
- |
743,565 |
Deduction for values reported in the “Change in Pension Value and Nonqualified Deferred Compensation Earnings” column of the Summary Compensation Table |
- |
- |
Addition for the Service Cost attributable to services rendered during the FY |
- |
- |
Compensation Actually Paid |
4,022,372 |
3,627,935 |
Memo: Total Equity Value for CAP |
445,361 |
1,453,485 |
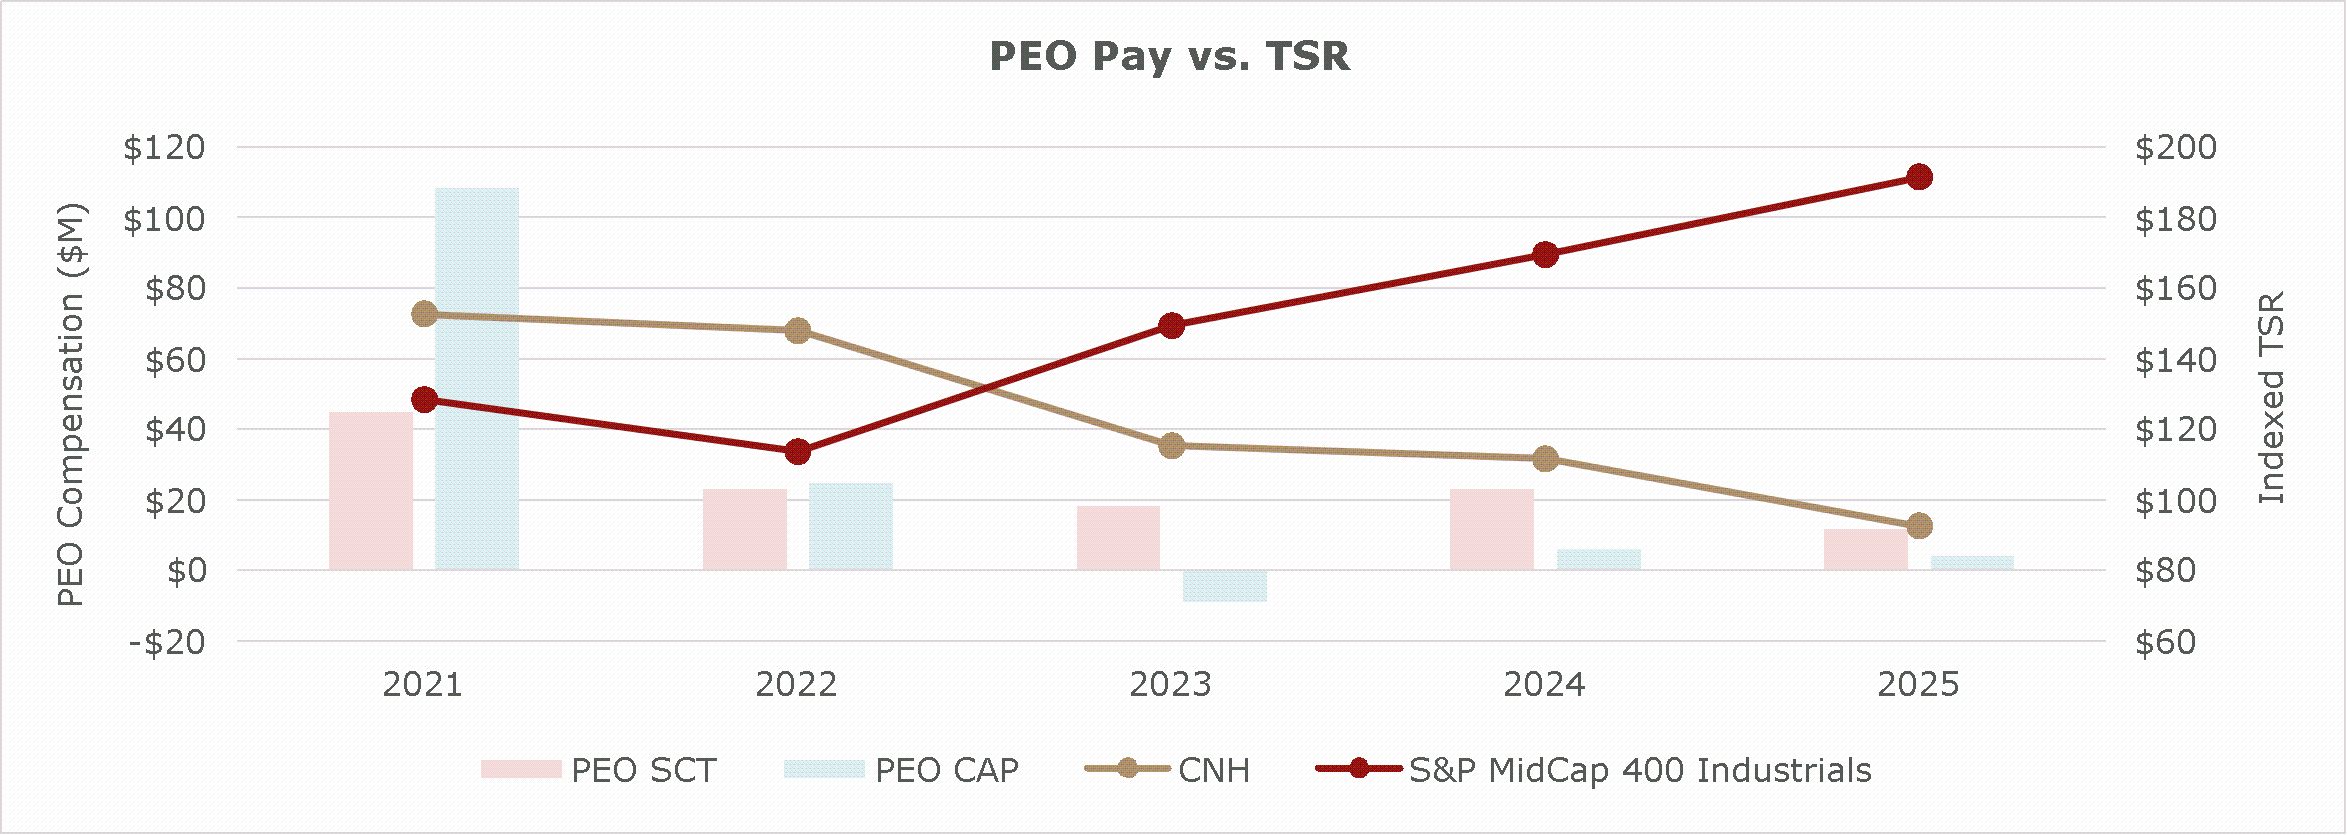
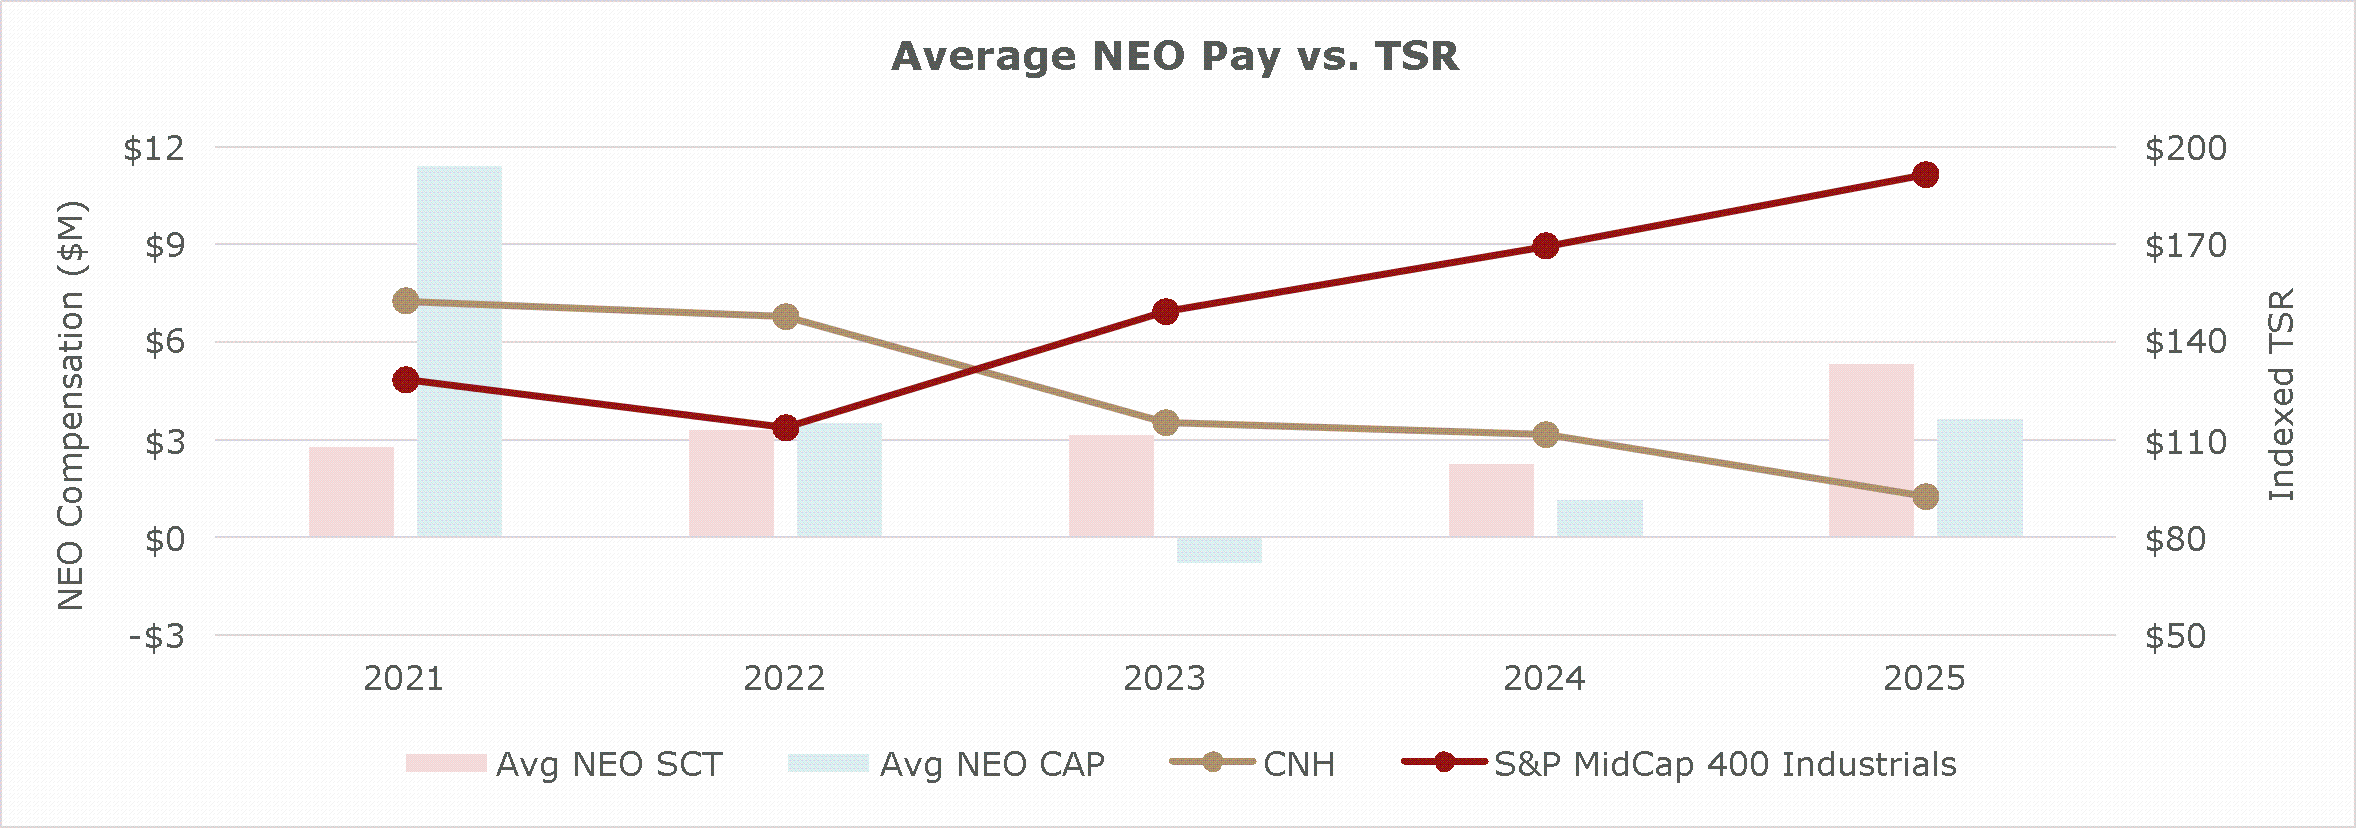
PEO and Average NEO CAP Versus TSR 2021-2025
The following charts show the TSR trend of the Company’s PvP peers versus the PEO’s SCT compensation and CAP, and non-PEO NEOs’ average SCT compensation and CAP, respectively.
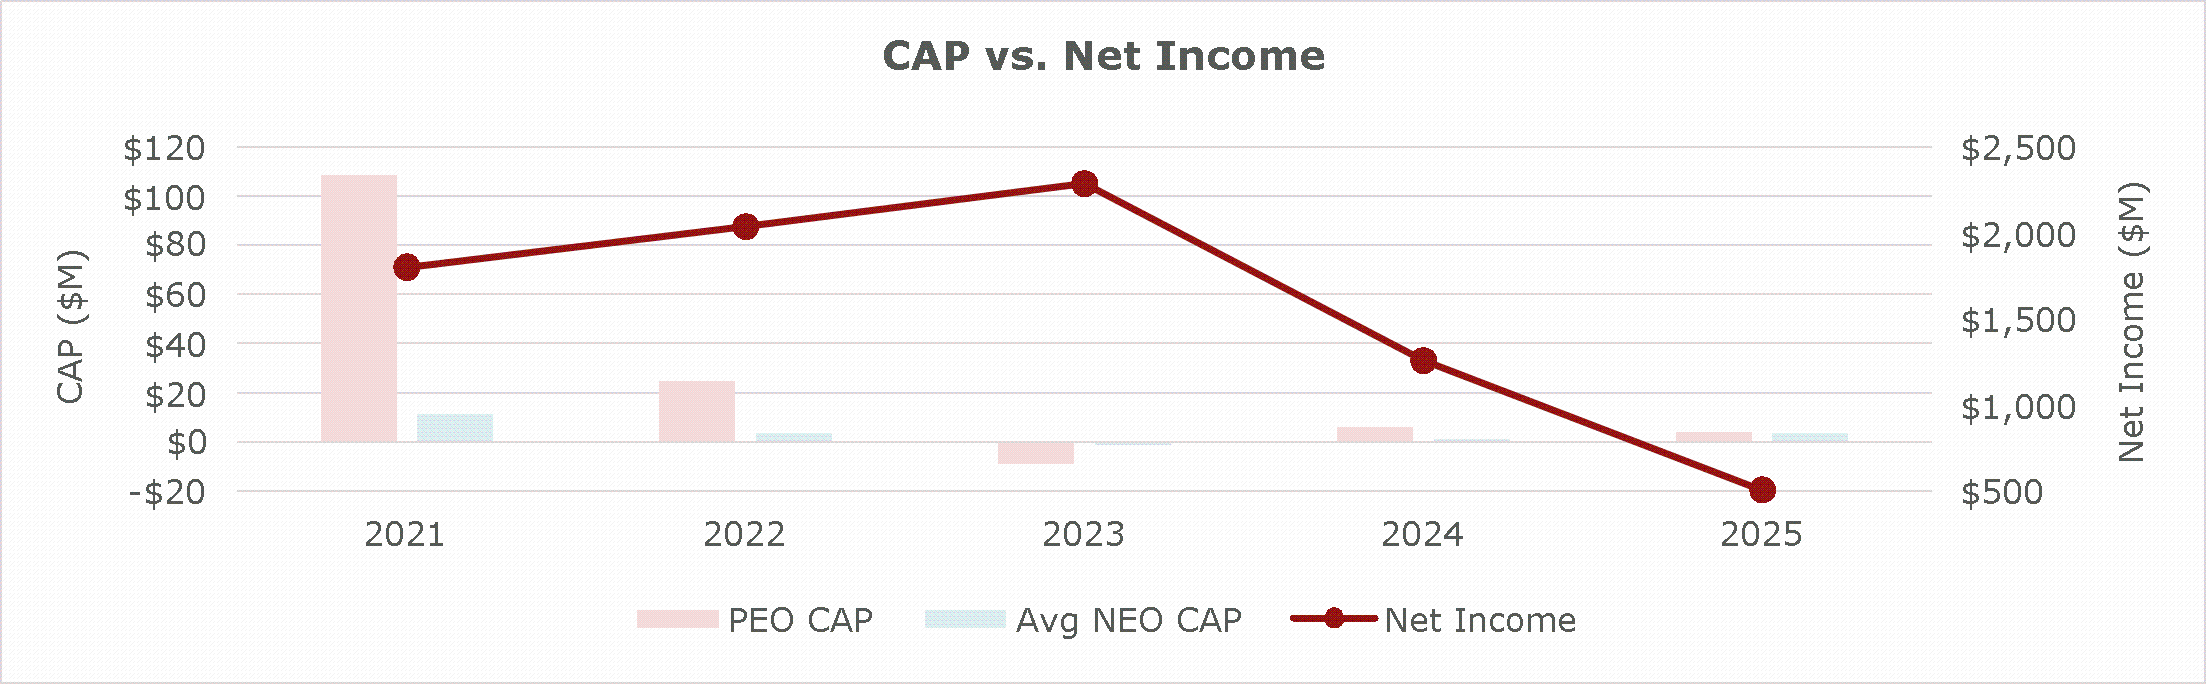
PEO and Average NEO CAP Versus U.S. GAAP Net Income
The chart below shows the relationship between cumulative PEO CAP and average non-PEO NEO CAP, and U.S. GAAP Net Income. The Company does not use U.S. GAAP Net Income in the compensation program.
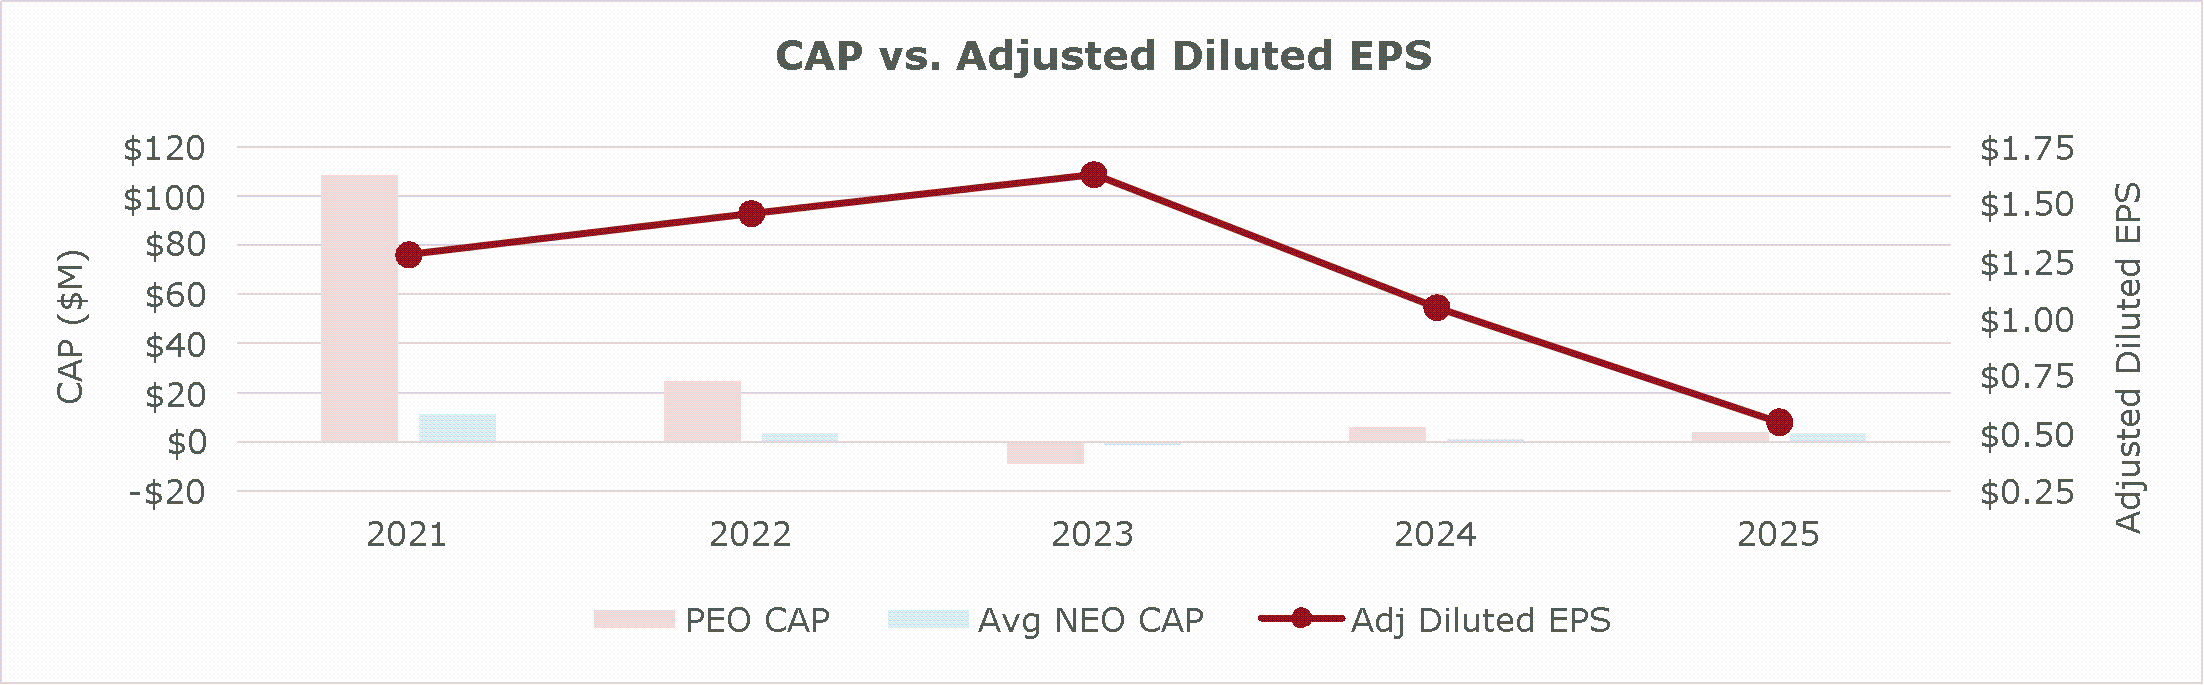
PEO and Average NEO CAP Versus Adjusted Diluted EPS
The chart below shows the relationship between cumulative PEO CAP and average non-PEO NEO CAP, and the Company selected measure of Adjusted Diluted EPS, which features in the PSU performance measures for LTI from 2021-2025.
Tabular List of Company Performance Measures
The following table alphabetically lists the measures the Company believes are most important in linking compensation actually paid to company performance during 2025.