Pay vs Performance Disclosure - USD ($)
Apr. 18, 2022
Dec. 31, 2022
Dec. 31, 2025
Dec. 31, 2024
Dec. 31, 2023
Dec. 31, 2022
Dec. 31, 2021
PAY-VERSUS-PERFORMANCE
As required by Item 402(v) of Regulation S-K, we are providing the following information regarding the relationship between certain executive compensation and certain elements of our financial performance for each of the last five completed calendar years for our 2025 principal executive officer (“PEO”) and our 2025 NEOs other than our PEO (“Other NEOs”). In determining the “compensation actually paid” to our PEO and the Other NEOs, we are required to make various adjustments to amounts that have been reported in the Summary Compensation Table this year and in previous years, as the SEC’s valuation methods for this section differ from those required in the Summary Compensation Table. The table below summarizes certain compensation values reported in our 2025 and prior Summary Compensation Tables, as well as the adjusted values required in this section for the 2025, 2024, 2023, 2022, and 2021 calendar years. Note that for our Other NEOs, compensation is reported as an average.
• | In 2025, the Other NEOs were Messrs. Jennings, Manning, and Collins and Ms. Gunning. |
• | In 2024, the Other NEOs were Messrs. Wood, Manning, Collins and Zhu; |
• | In 2023, the Other NEOs were Messrs. Wood, Collins, Manning, Patel and Hottinger; |
• | In 2022, the Other NEOs were Messrs. Patel, Collins, Hottinger and Rose; and |
• | In 2021, the Other NEOs were Messrs. Patel, Hottinger, Krantz and Stacherski. |
YEAR | SUMMARY COMPENSATION TABLE TOTAL FOR PEO ($)(1) | COMPENSATION ACTUALLY PAID TO PEO ($)(1)(2) | AVERAGE SUMMARY COMPENSATION TABLE TOTAL FOR OTHER NEOs ($)(2) | AVERAGE COMPENSATION ACTUALLY PAID TO OTHER NEOs ($)(2) | VALUE OF INITIAL FIXED $100 INVESTMENT BASED ON: | NET INCOME ($ IN THOUSANDS)(5) | REVENUE ($ IN THOUSANDS)(5) | |||||||||||||||||||||||||
FUSARO | HOSTETLER | FUSARO | HOSTETLER | ARRAY TOTAL STOCKHOLDER RETURN ($)(3) | PEER GROUP TOTAL RETURN ($)(4) | |||||||||||||||||||||||||||
2025 | — | 6,803,799 | — | 11,404,764 | 2,139,100 | 2,926,501 | 21.37 | 16.28 | (52,235) | 1,284,141 | ||||||||||||||||||||||
2024 | — | 8,862,712 | — | (1,262,681) | 1,977,334 | 1,101,333 | 14.00 | 23.82 | (240,394) | 915,807 | ||||||||||||||||||||||
2023 | — | 5,716,945 | — | 5,147,609 | 1,372,133 | 1,248,586 | 38.94 | 55.69 | 137,240 | 1,576,551 | ||||||||||||||||||||||
2022 | 2,148,071 | 5,772,123 | 3,036,259 | 7,256,684 | 1,214,022 | 1,692,131 | 44.81 | 121.12 | 4,432 | 1,637,546 | ||||||||||||||||||||||
2021 | 4,271,575 | — | 570,878 | — | 1,414,459 | 557,975 | 36.37 | 97.32 | (50,403) | 853,318 | ||||||||||||||||||||||
1. | Mr. Fusaro served as our PEO during 2021, and he resigned from the Company on April 18, 2022. On that same date, Mr. Hostetler was appointed as our PEO and continues to serve in such capacity. |
2. | In accordance with the requirements of Item 402(v) of Regulation S-K, the adjustments in the table entitled “PEO” below (following footnote 5) were made to Mr. Hostetler’s total compensation for each year as reported in the applicable Summary Compensation Tables to determine the compensation actually paid. The valuation assumptions used to calculate the fair values of RSUs and PSUs include the stock price as of the applicable measuring date and, in the case of PSUs, determined using a Monte-Carlo model for each award on the applicable measuring date and based on the probable outcome of the performance conditions as of the applicable measuring date (or actual performance results approved by the Human Capital Committee as of the applicable vesting date). Otherwise, the valuation assumptions used to calculate fair values did not materially differ from those used in our disclosures of fair value as of the grant date. |
Similarly, in accordance with the requirements of Item 402(v) of Regulation S-K, the adjustments in the table entitled “Other NEOs” below (following footnote 5) were made to the Other NEOs’ average total compensation for each year as reported in the applicable Summary Compensation Tables to determine the compensation actually paid. The equity award adjustments for each applicable year include the same methodology described above for Mr. Hostetler.
3. | The values disclosed in this column represent the value of an investment of $100 in our common stock as of December 31, 2020, measured at December 31, 2025, 2024, 2023, 2022, and 2021, respectively. |
4. | Represents the weighted peer group total stockholder return, weighted according to the respective companies’ stock market capitalization at the beginning of each period for which a return is indicated. The peer group used for this purpose is the customized peer group used by the Company for purposes of Item 201(e) of Regulation S-K (Enphase Energy, Solaredge Technologies, Shoals Technologies Group and FTC Solar). |
5. | Represents Net Income and Revenue as disclosed in our Annual Report on Form 10-K for the years ended December 31, 2025, 2024, 2023, 2022, and 2021, as applicable. The fiscal 2023 Net Income included in last year’s comparable disclosure reflected Net Income to Common Shareholders of $85,546,000; in this Proxy Statement, this figure has been updated to reflect actual fiscal 2023 Net Income of $137,240,000. |
PEO | 2025 | ||||
Total compensation as reported in Summary Compensation Table (SCT) | 6,803,799 | ||||
Subtract SCT “Stock Awards” value for 2025 | 4,776,334 | ||||
Add Year-end fair value of outstanding equity compensation granted in current year | 7,500,308 | ||||
Add Change in fair value (from end of prior fiscal year to vesting date) for awards granted in prior fiscal years that vested during current fiscal year | (65,032) | ||||
Add Change in fair value (from end of prior fiscal year to end of current fiscal year) for awards granted in prior fiscal years that remained unvested and outstanding at end of current fiscal year | 1,942,023 | ||||
Subtract Fair value of awards forfeited in current fiscal year determined at end of prior fiscal year | — | ||||
Compensation Actually Paid to PEO | 11,404,764 | ||||
OTHER NEOs | 2025 | ||||
Total compensation as reported in Summary Compensation Table (SCT) | 2,139,100 | ||||
Subtract SCT “Stock Awards” value for 2025 | 1,187,709 | ||||
Add Year-end fair value of outstanding equity compensation granted in current year | 1,815,849 | ||||
Add Change in fair value (from end of prior fiscal year to vesting date) for awards granted in prior fiscal years that vested during current fiscal year | 852 | ||||
Add Change in fair value (from end of prior fiscal year to end of current fiscal year) for awards granted in prior fiscal years that remained unvested and outstanding at end of current fiscal year | 158,410 | ||||
Subtract Fair value of awards forfeited in current fiscal year determined at end of prior fiscal year | — | ||||
Compensation Actually Paid to Other NEOs | 2,926,501 | ||||
• | In 2025, the Other NEOs were Messrs. Jennings, Manning, and Collins and Ms. Gunning. |
• | In 2024, the Other NEOs were Messrs. Wood, Manning, Collins and Zhu; |
• | In 2023, the Other NEOs were Messrs. Wood, Collins, Manning, Patel and Hottinger; |
• | In 2022, the Other NEOs were Messrs. Patel, Collins, Hottinger and Rose; and |
• | In 2021, the Other NEOs were Messrs. Patel, Hottinger, Krantz and Stacherski. |
1. | Mr. Fusaro served as our PEO during 2021, and he resigned from the Company on April 18, 2022. On that same date, Mr. Hostetler was appointed as our PEO and continues to serve in such capacity. |
4. | Represents the weighted peer group total stockholder return, weighted according to the respective companies’ stock market capitalization at the beginning of each period for which a return is indicated. The peer group used for this purpose is the customized peer group used by the Company for purposes of Item 201(e) of Regulation S-K (Enphase Energy, Solaredge Technologies, Shoals Technologies Group and FTC Solar). |
2. | In accordance with the requirements of Item 402(v) of Regulation S-K, the adjustments in the table entitled “PEO” below (following footnote 5) were made to Mr. Hostetler’s total compensation for each year as reported in the applicable Summary Compensation Tables to determine the compensation actually paid. The valuation assumptions used to calculate the fair values of RSUs and PSUs include the stock price as of the applicable measuring date and, in the case of PSUs, determined using a Monte-Carlo model for each award on the applicable measuring date and based on the probable outcome of the performance conditions as of the applicable measuring date (or actual performance results approved by the Human Capital Committee as of the applicable vesting date). Otherwise, the valuation assumptions used to calculate fair values did not materially differ from those used in our disclosures of fair value as of the grant date. |
PEO | 2025 | ||||
Total compensation as reported in Summary Compensation Table (SCT) | 6,803,799 | ||||
Subtract SCT “Stock Awards” value for 2025 | 4,776,334 | ||||
Add Year-end fair value of outstanding equity compensation granted in current year | 7,500,308 | ||||
Add Change in fair value (from end of prior fiscal year to vesting date) for awards granted in prior fiscal years that vested during current fiscal year | (65,032) | ||||
Add Change in fair value (from end of prior fiscal year to end of current fiscal year) for awards granted in prior fiscal years that remained unvested and outstanding at end of current fiscal year | 1,942,023 | ||||
Subtract Fair value of awards forfeited in current fiscal year determined at end of prior fiscal year | — | ||||
Compensation Actually Paid to PEO | 11,404,764 | ||||
Similarly, in accordance with the requirements of Item 402(v) of Regulation S-K, the adjustments in the table entitled “Other NEOs” below (following footnote 5) were made to the Other NEOs’ average total compensation for each year as reported in the applicable Summary Compensation Tables to determine the compensation actually paid. The equity award adjustments for each applicable year include the same methodology described above for Mr. Hostetler.
OTHER NEOs | 2025 | ||||
Total compensation as reported in Summary Compensation Table (SCT) | 2,139,100 | ||||
Subtract SCT “Stock Awards” value for 2025 | 1,187,709 | ||||
Add Year-end fair value of outstanding equity compensation granted in current year | 1,815,849 | ||||
Add Change in fair value (from end of prior fiscal year to vesting date) for awards granted in prior fiscal years that vested during current fiscal year | 852 | ||||
Add Change in fair value (from end of prior fiscal year to end of current fiscal year) for awards granted in prior fiscal years that remained unvested and outstanding at end of current fiscal year | 158,410 | ||||
Subtract Fair value of awards forfeited in current fiscal year determined at end of prior fiscal year | — | ||||
Compensation Actually Paid to Other NEOs | 2,926,501 | ||||
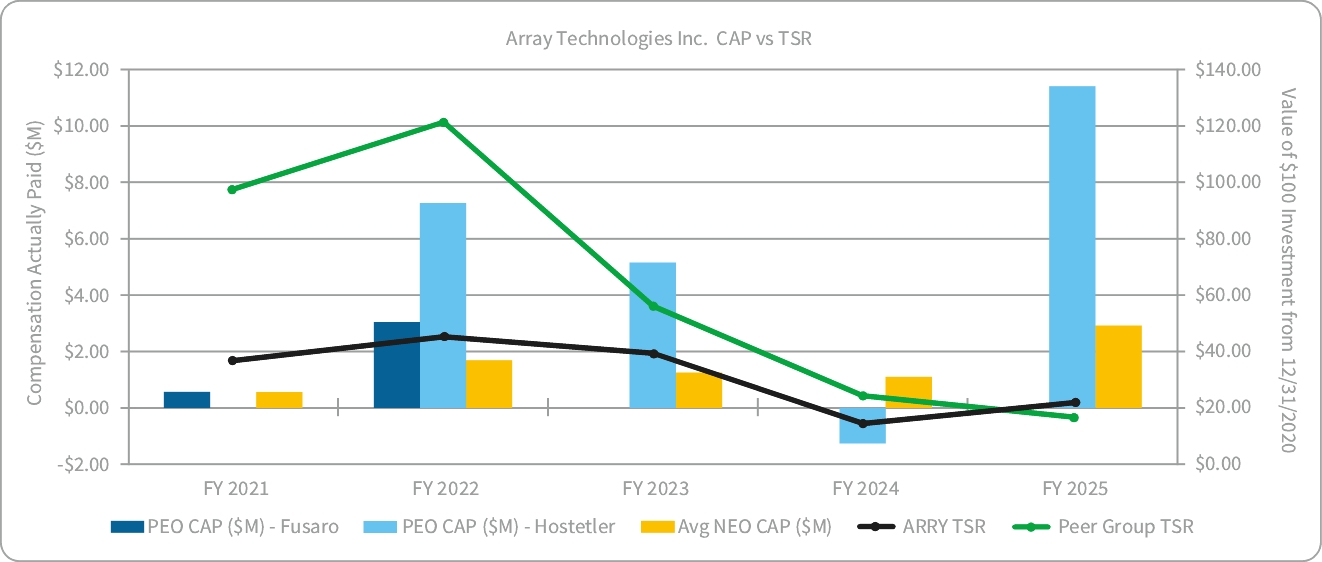
Compensation Actually Paid vs TSR
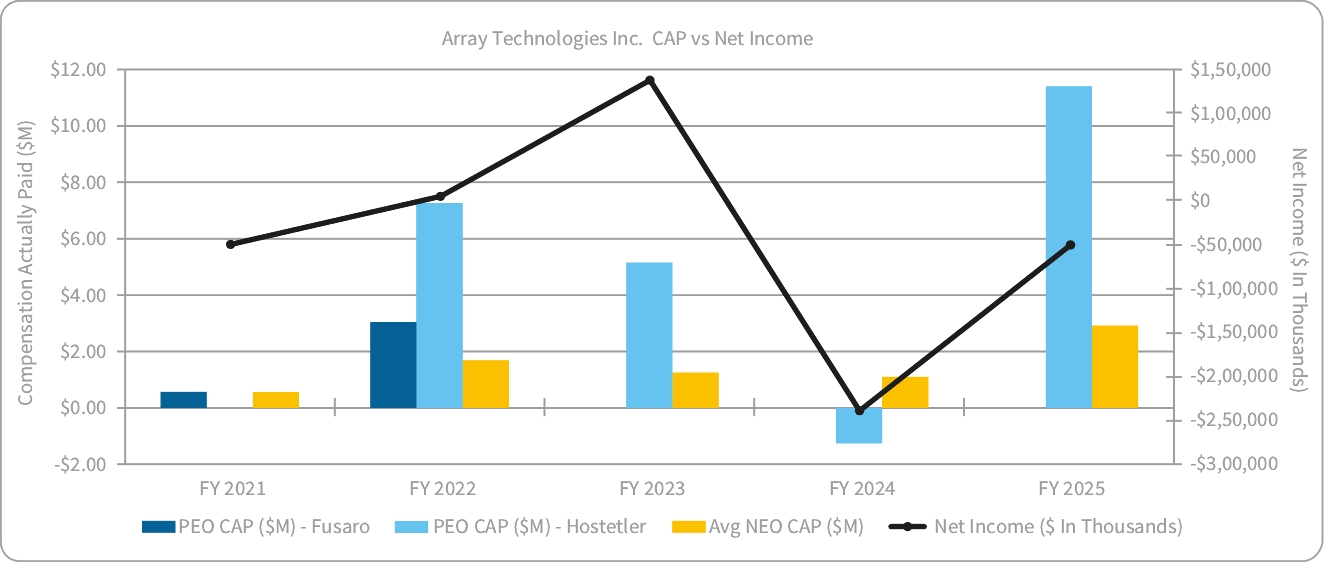
Compensation Actually Paid vs Net Income
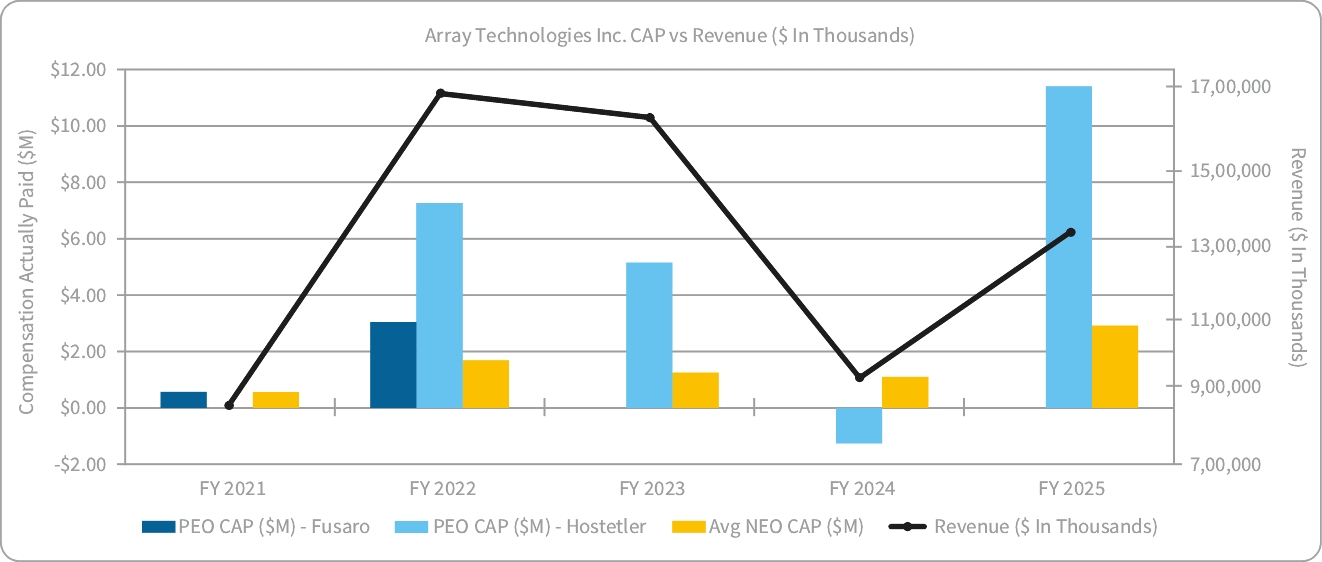
Compensation Actually Paid vs Revenue
Compensation Actually Paid vs TSR
Financial Performance Measures
The performance measures listed below represent the most important measures we use to link compensation actually paid to our NEOs for 2025 to the Company’s performance:
• | Revenue (our Company Selected Measure under Item 402(v) of Regulation S-K) |
• | Adjusted EBITDA(1) |
• | Cash Conversion Cycle |
1. | Adjusted EBITDA of $178 million for purposes of the 2025 LIP. |