Exhibit 99.2
Exhibit 99.2
The following discussion is management’s assessment and analysis of the results and financial condition of New Found Gold Corp. (the “Company”, “New Found Gold”, or “NFG”) and should be read in conjunction with the accompanying audited consolidated financial statements and related notes. The financial data was prepared using accounting policies consistent with International Financial Reporting Standards (“IFRS”) as issued by the International Accounting Standards Board (“IASB”) and all figures are reported in Canadian dollars unless otherwise indicated. Please refer to the cautionary note regarding forward-looking statements and information within this Management’s Discussion & Analysis (“MD&A”) and the Risks Factors discussed in the Company’s most recent Annual Information Form on file with the Canadian provincial securities, regulatory authorities and Form 40-F on file with the U.S. Securities and Exchange Commission (the “SEC”).
Forward-Looking Statements
This MD&A contains forward-looking information and forward-looking statements, within the meaning of the U.S. Private Securities Litigation Reform Act of 1995 and forward-looking information within the meaning of applicable Canadian securities legislation, (collectively, “forward-looking statements”), that involve numerous risks and uncertainties. The Company continually seeks to minimize its exposure to business risks, but by the nature of its business and exploration activities and size, it will always have some risk. These risks are not always quantifiable due to their uncertain nature. Should one or more of these risks and uncertainties, including those described under the headings “Risks and Uncertainties” and “Cautionary Notes Regarding Forward-Looking Statements” materialize, or should underlying assumptions prove incorrect, then actual results may vary materially from those expressed or implied in forward-looking statements. The effective date of this report is March 25, 2026.
Unless otherwise indicated, technical disclosure regarding the Company’s properties included or incorporated by reference herein, including use of the capitalized terms “Mineral Resources” and “Mineral Reserves”, has been prepared in accordance with the requirements of, and imports the meaning of such terms as defined in, National Instrument 43-101 – Standards of Disclosure for Mineral Projects (“NI 43-101”) and the Canadian Institute of Mining, Metallurgy and Petroleum (the “CIM”) – CIM Definition Standards on Mineral Resources and Mineral Reserves, adopted by the CIM Council, as amended (the “CIM Definition Standards”), as applicable, and should be read in conjunction with the cautionary statements provided in section “Cautionary Statements – Cautionary Note for United States Investors” at the end of this MD&A.
The scientific and technical information disclosed in this MD&A was reviewed and approved by Keith Boyle, P. Eng., CEO, and a Qualified Person as defined under NI 43-101. Mr. Boyle consents to the publication of this MD&A by New Found Gold. The scientific and technical information in this MD&A relating to the Queensway Gold Project (as defined herein) is derived from, and in some instances is a direct extract from, and is based on the assumptions, qualifications and procedures set out in, the report entitled “NI 43-101 Technical Report, Queensway Gold Project, Newfoundland and Labrador, Canada” with an effective date June 30, 2025 prepared by Pierre Landry, P.Geo., Lance Engelbrecht, P. Eng. and David M. Robson, P.Eng., each of SLR Consulting (Canada) Ltd. (“SLR”) and Sheldon H. Smith, P.Geo. of Stantec Consulting Limited,(each a “Qualified Person” (“QP”) in accordance with NI 43-101 (the “Queensway Technical Report”). The scientific and technical information in this MD&A relating to the Hammerdown Gold Project (as defined herein) is derived from, and in some instances is a direct extract from, and is based on the assumptions, qualifications and procedures set out in, the report titled “Hammerdown Gold Project, Preliminary Economic Assessment Technical Report, Newfoundland and Labrador, Canada”, with an effective date of February 18, 2026 prepared by WSP Canada Inc. in compliance with NI 43-101 (the “Hammerdown Technical Report”). Reference should be made to the full text of the Queensway Technical Report and the Hammerdown Technical Report, which are available for review under the Company’s profile on SEDAR+ at www.sedarplus.ca and on EDGAR (www.sec.gov/edgar).
New Found Gold is an emerging
Canadian gold producer listed on the TSX
Venture Exchange (TSXV:NFG) and the
NYSE-American Exchange (NYSE:NFGC)
Table of Contents
1 | |
3 | |
6 | |
16 | |
22 | |
24 | |
27 | |
30 | |
31 | |
33 | |
34 | |
35 | |
37 | |
39 | |
50 | |
51 | |
Internal Controls Over Financial Reporting and Disclosure Controls and Procedures | 53 |
55 | |
57 | |
57 | |
57 | |
57 |
| |
Management’s Discussion and Analysis | |
For the year ended December 31, 2025 | |
(Expressed in Canadian Dollars, except share and per share amounts, unless otherwise indicated) | |
The year ended December 31, 2025, was a transitional year for New Found Gold. The Company began the year as an early-stage exploration company focused primarily on the Queensway Gold Project (“Queensway”) and ended the year as a multi-asset emerging Canadian gold producer.
Through strategic management changes, key technical milestones, capital raises totaling approximately $83.5 million (“M”), and the acquisition of Maritime Resources Corp. (“Maritime”), the Company evolved into a Canadian gold producer with a diversified, multi-asset portfolio comprising active mining and milling facilities and a flagship exploration and development asset.
2025 Strategic and Corporate Highlights
| ● | New board of directors and management team: Led by Chairman Paul Andre Huet and Chief Executive Officer, Keith Boyle, the Company has a new and highly experienced board of directors consisting of seasoned mining executives and capital markets specialists, along with a new management team of mine builders and operators to complement its existing exploration strength. |
| ● | Financings: Completion of a $63M bought deal financing and $20M private placement, strengthening New Found Gold’s balance sheet and confirming support from cornerstone investor Eric Sprott and institutional investors. |
| ● | Initial Mineral Resource Estimate (“MRE”): Publication of a MRE for Queensway, outlining 18.0 million tonnes (“Mt”) grading 2.40 grams per tonne of gold (“g/t Au”) containing 1.39 million ounces (“Moz”) (indicated), with another 10.7 Mt grading 1.77 g/t Au containing 0.61 Moz (inferred), firmly establishing a solid mineral resource base. |
| ● | Preliminary Economic Assessment (“PEA”): Publication of a low-cost, high-margin PEA for Queensway demonstrating robust economics of $743M after-tax NPV5% and 56.3% after-tax IRR, at a base case gold price of US$2,500/oz. These base case values are supported by total gold production of 1.5 Moz of gold (“Au”) over a 15 year mine life for a life of mine (“LOM”) and all-in sustaining cost (“AISC”)1 of US$1,256/oz. |
| ● | Maritime Acquisition: Acquisition of all issued and outstanding shares of Maritime not already owned by way of a statutory plan of arrangement with 94,254,209 common shares of New Found Gold issued as consideration. |
| ● | Queensway Expansion: Acquired highly prospective claims previously held by Exploits Discovery Corp. (“Exploits”), consolidating a district-scale land package and increasing Queensway by 31%. |
| ● | Hammerdown and Pine Cove Mill: With the successful acquisition of Maritime, the Company is focused on bringing the newly acquired Hammerdown Gold Project (“Hammerdown”) and Pine Cove Mill into commercial production. |
| ● | Queensway Advancement: Completed 2025 work program, including over 74,000 metres (“m”) in 614 diamond drill holes (“DDH”) with a primary focus on resource definition and pre-development work to support the advancement of the Phase 1 mine plan outlined in the PEA, and a secondary focus on exploration, with high-grade discoveries such as the Dropkick zone (“Dropkick”) underscoring the camp-scale potential of the district. |
1 Note: AISC is a Non-GAAP measure; See section entitled “Non-IFRS Financial Measures” for additional information regarding AISC.
1
| |
Management’s Discussion and Analysis | |
For the year ended December 31, 2025 | |
(Expressed in Canadian Dollars, except share and per share amounts, unless otherwise indicated) | |
| ● | Queensway Project Finance: Engaged Cutfield Freeman & Co. Ltd. (“CF&Co”), an independent global mining finance advisory firm, to act as a project finance advisor with the objective of selecting the optimal financing package for the initial capital expenditure required to fund Queensway Phase 1 production. |
| ● | First Revenue: $5.80M in production revenue generated from Hammerdown (pre-commercial production), signaling the Company’s transformation from an exploration company to an emerging gold producer. |
Subsequent Events
On January 21, 2026, the Company announced it had commenced the 2026 drill program at Queensway with four rigs active and initially focused on infill, exploration and condemnation drilling. Initial infill drilling includes PEA Phase 2 open pit (“OP”) resource conversion in K2 and the Cokes zone, with the objective of converting inferred resources to indicated. In addition to drilling, regional exploration is underway, with field teams advancing both regional-scale and targeted soil sampling programs. The results of this work will assist in generating new trenching and drill targets for advancement later in 2026 and beyond. Further drill results from infill drilling at the K2 zone in the Appleton Fault Zone Core (“AFZC”) were released.
On January 26, 2026, New Found Gold entered into a Phase I engineering, procurement and construction management services (“EPCM”) contract with WSP Canada Inc. for Queensway Phase I project development, with scope of work including site development and detailed engineering of an offsite milling facility. EPCM work will include upgrade and expansion of Pine Cove for Queensway Phase I to benefit from the synergies of processing both Hammerdown and Queensway feed from a single facility.
On February 2, 2026, the Company reported additional results from 2025 grade control drilling at the Keats zone (“Keats”) excavation in the AFZC at Queensway. Results released included 1,230 m of drilling in 36 DDH and continue to demonstrate the high-grade tenor of this zone and strong continuity of gold mineralization near or at surface.
On February 26, 2026, the Company reported results of a positive PEA and updated MRE for Hammerdown, which supports a hub and spokes mine plan for the Company’s three deposits (Hammerdown, Stog’er Tight and Orion) centered around the Pine Cove Mill. Results demonstrate an after-tax NPV5% of $199.2M using a base case gold price scenario of US$3,475/oz and $415.1M after-tax NPV5% using an upside gold price scenario of US$5,000/oz. The PEA also showed solid total production of 251.3 thousand ounces (“Koz”) over a 13-year LOM with average LOM total cash costs2 and AISC of US$2,149/oz Au and US$2,429/oz Au, respectively. Total after-tax free cash flow3 for Hammerdown is expected to be $243.3M.
On March 1, 2026, New Found Gold announced final results from its 2025 grade control program at Queensway, focused on Keats and the Iceberg zone (“Iceberg“) excavations in the AFZC, which delivered consistently high gold grades over broad widths, returning some of the best intercepts drilled by the Company to date at Queensway.
On March 5, 2026, the Company announced that it had entered into a non-binding term sheet with Nebari Natural Resources Credit Fund II LP (“Nebari”), for an up to US$75.0M loan facility, to be advanced in two tranches: US$50.0M to be funded at closing and, subject to the satisfaction of certain conditions and if required by the Company, an additional US$25.0M to be funded no later than 15 months after closing at no additional standby fee. Proceeds will be used to support Queensway development, including the procurement of long lead items, early construction activities, upgrading and expanding Pine Cove to accommodate Queensway Phase 1 off-site milling, and general working capital purposes.
2 Note: Cash cost is a Non-GAAP measure; See section entitled “Non-IFRS Financial Measures” for additional information regarding cash costs.
3 Note: Free cash flow is a Non-GAAP measure; See section entitled “Non-IFRS Financial Measures” for additional information regarding free cash flow.
2
| |
Management’s Discussion and Analysis | |
For the year ended December 31, 2025 | |
(Expressed in Canadian Dollars, except share and per share amounts, unless otherwise indicated) | |
Finally, on March 17, 2026 the Company filed the Hammerdown Technical Report, which is available for review under the Company’s profile on SEDAR+ at www.sedarplus.ca and on EDGAR (www.sec.gov/edgar).
Looking Ahead
Moving forward, the Company remains focused on the following key priorities: ramping up Hammerdown to commercial production and leveraging on-island processing and tailings facilities; advancing Queensway through engineering and permitting towards a Phase I construction decision in late 2026, followed by first production in late 2027; and continuing focused exploration at Queensway, including adjacent AFZC, Dropkick and newly acquired ground, to grow resources and support future expansions.
Corporate Overview
New Found Gold is a Canadian gold mining and exploration company with its principal assets located in the province of Newfoundland and Labrador, Canada. The Company’s common shares are listed on the TSX Venture Exchange (“TSXV”) under the symbol “NFG” and on the NYSE American stock exchange (“NYSE American”) under the symbol “NFGC.” The Company is principally engaged in the development and production of resource properties, and the sale of gold produced from its assets, as well as the identification, acquisition, exploration, evaluation and development of resource properties.
During the year ended December 31, 2025, the Company completed the strategic acquisition of Maritime, expanding its asset base and advancing its corporate strategy toward becoming an emerging multi-asset gold producer. As a result of this transaction, the Company now holds a diversified portfolio of gold assets at varying stages of development, ranging from advanced exploration and near-term development to emerging production, as well as processing infrastructure.
The Company’s business strategy is centered on creating long-term shareholder value through disciplined technical execution, responsible environmental and social practices, and the strategic consolidation of high-quality gold assets within a stable and globally recognized mining-positive jurisdiction.
Portfolio of Mineral Properties
As at December 31, 2025, New Found Gold’s principal mineral assets consist of Queensway and Hammerdown, each of which is described below (Figure 1).
Queensway
Queensway is the Company’s flagship asset and encompasses 219,175 hectares (“ha”), which includes an increase in land area of 31% over 2024, as a result of the acquisition of a 100% interest in certain mineral claims previously held by Exploits Discovery Corp. (“Queensway Expansion”). Queensway encompasses a large, contiguous land package situated along highly prospective geological structures and covering more than 110 km of strike on two primary fault zones: Appleton (“AFZ”) and Joe Batt’s Pond (“JBPFZ”) that are spatially associated with key gold discoveries made to date.
Queensway has been the primary focus of the Company’s exploration activities since its initial discovery and remains a core driver of long-term value creation. The project hosts multiple high-grade gold discoveries and has demonstrated district-scale potential supported by extensive drilling, geological modeling, and systematic exploration.
In 2025, the Company advanced Queensway through key technical milestones, including the completion of its initial MRE and PEA, establishing a foundational technical and economic framework for future advancement.
3
| |
Management’s Discussion and Analysis | |
For the year ended December 31, 2025 | |
(Expressed in Canadian Dollars, except share and per share amounts, unless otherwise indicated) | |
The Queensway PEA outlines a phased approach with an initial small high-grade OP mine and toll milling (“Phase I”), followed by the construction of a larger on-site operation, which will include both OP and underground (“UG”) mining (“Phase 2”). A phased project design provides for early gold production and revenue generation, processing the highest-grade mineralized material at the start of the operation and in-pit tailings deposition. This unique combination of design elements allows for low initial capital investment and a rapid payback of that initial investment, using cashflow to grow the operation.
Ongoing activities at Queensway are focused on resource growth and conversion, continued metallurgical and engineering studies, advancement of environmental baseline studies and permitting work, and EPCM work aimed at first gold production in late 2027. The Company views Queensway as a long-life exploration and development opportunity with significant upside potential beyond the current resource base.
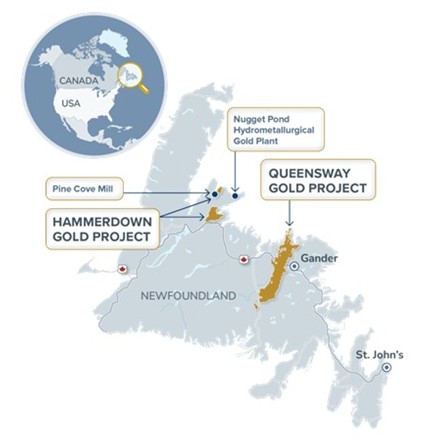
Figure 1. Location of Queensway and Hammerdown, central Newfoundland, Canada.
4
| |
Management’s Discussion and Analysis | |
For the year ended December 31, 2025 | |
(Expressed in Canadian Dollars, except share and per share amounts, unless otherwise indicated) | |
Hammerdown
Hammerdown, acquired in late 2025 through the Maritime acquisition, adds permitted milling and tailing facilities, along with near-term gold production, to the Company’s asset portfolio. Hammerdown, comprised of the Hammerdown Property and the Pine Cove Property, are located within 300 km of Queensway. Hammerdown includes the following principal components:
| ● | Pine Cove Mill on the Pine Cove Property, a permitted and recommissioned gold processing and tailings facility that is currently processing mineralized material from the Hammerdown deposit at a rate of 700 tonnes per day (“tpd”). Pending receipt of all required permits, the Company plans to upgrade and expand the facility to 1,400 tpd to also accept feed from Queensway Phase 1; |
| ● | Hammerdown deposit on the Hammerdown Property, an open-pit gold deposit that achieved first gold pour in November, 2025 and which the Company intends to advance to commercial production in 2026; |
| ● | Orion deposit on the Hammerdown Property; |
| ● | Stog’er Tight deposit on the Pine Cove Property; |
| ● | The Nugget Pond hydrometallurgical gold plant (Nugget Pond “HGP”), currently located within the third party-owned Nugget Pond Mill; |
| ● | A 44,650 ha land package with significant upside exploration potential; and |
| ● | Associated supporting infrastructure. |
Hammerdown materially enhances the Company’s development profile by adding permitted processing capacity and a defined development pathway, complementing the longer-term exploration upside of Queensway and offers the potential to accelerate value realization.
During 2025, activities at Hammerdown focused on establishing the project infrastructure, completion of grade-control and near-mine drilling programs, and refinement of mine planning and engineering inputs. Activities at the Pine Cove Mill included recommissioning the plant on low grade stockpiles, mill refurbishment and other optimization initiatives.
Near-term efforts will be directed toward optimizing the Hammerdown mine plan and advancing remaining engineering, procurement and construction management activities, while continuing to utilize Pine Cove Mill as a permitted processing facility currently capable of supporting the Hammerdown mine plan production. The Company published PEA results and an updated MRE for Hammerdown via a news release on February 26, 2026, and subsequently filed the Hammerdown Technical Report on SEDAR+ on March 17, 2026.
Hammerdown is expected to provide optionality within the Company’s broader portfolio, positioning the Company as a new gold producer with near-term production and cash flow, and via a planned expansion of Pine Cove, offering processing facilities for Queensway Phase 1 production. The Company believes the presence of existing infrastructure, including Pine Cove, reduces execution risk relative to greenfield development for Queensway, and provides flexibility in sequencing development activities across its asset base.
5
| |
Management’s Discussion and Analysis | |
For the year ended December 31, 2025 | |
(Expressed in Canadian Dollars, except share and per share amounts, unless otherwise indicated) | |
Corporate Structure and Operating Segments
Following the Maritime acquisition, Maritime became a wholly owned subsidiary of New Found Gold. The consolidated financial statements of the Company include the results of Maritime from the date control was obtained.
The Company identified two reportable operating segments effective November 13, 2025: (i) Exploration and Evaluation, relating to acquisition, exploration and development of its mineral properties; and (ii) Mining Operations, pertaining to OP mining, processing and gold production at Hammerdown. Corporate costs and other items not directly attributable to an operating segment are reported under Corporate and Others. Prior to the Maritime acquisition, the Company operated as a single segment.
Business Strategy
The Company’s strategy is to build a leading Canadian gold company through:
| ● | Advancing Queensway through engineering and permitting towards a Phase I construction decision in late 2026, followed by first production in late 2027; |
| ● | Advancing Queensway district-scale exploration with long-term growth potential; |
| ● | Expanding the Pine Cove Mill to 1,400 tpd capacity to act as a processing hub for Hammerdown and Queensway Phase 1; |
| ● | Progressing the Hammerdown deposit to commercial production in 2026; |
| ● | Maintaining financial discipline and access to capital to support staged development decisions; and |
| ● | Applying disciplined and consistent technical, environmental, and governance standards across all assets. |
By maintaining separate technical and development pathways for Queensway and Hammerdown, the Company seeks to optimize capital allocation, manage risk effectively, and maximize the long-term value of its diversified asset portfolio.
Queensway represents the Company’s primary long-term growth asset. Queensway is situated near the town of Gander, Newfoundland and Labrador, and is accessible by the Trans-Canada Highway, secondary roads, forestry roads, and existing regional infrastructure. The project area is in close proximity to power, ports, and an established mining services sector, providing a favorable backdrop for continued exploration and potential future development.
6
| |
Management’s Discussion and Analysis | |
For the year ended December 31, 2025 | |
(Expressed in Canadian Dollars, except share and per share amounts, unless otherwise indicated) | |
Queensway comprises a large, contiguous land package that hosts multiple high-grade gold discoveries and extensive exploration upside (Figure 2). Since its initial discovery, the project has evolved from an early-stage exploration target into a district-scale gold system supported by a solid mineral resource base and advancing technical studies.
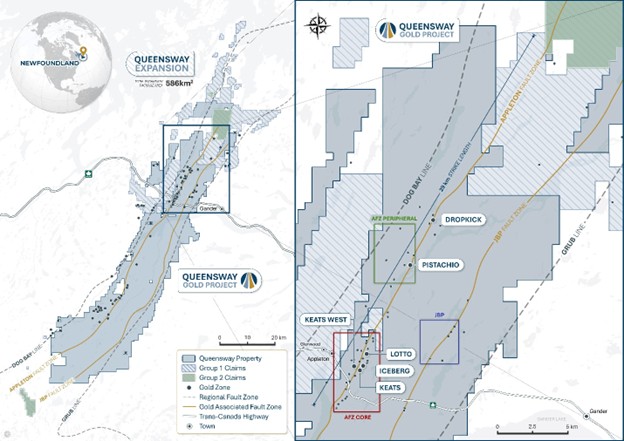
Figure 2. Queensway, showing area of Queensway Expansion and key zones and infrastructure.
Queensway is located within the Exploits Subzone of the Dunnage Zone, a geological terrane that has emerged as a highly prospective gold district in recent years. The project covers more than 110 km of strike length along two major regional-scale fault systems, the AFZ and the JBPFZ, which are interpreted to be associated with gold mineralization across the property.
Gold mineralization at Queensway is characterized by high-grade vein-hosted systems with strong structural controls. Exploration to date has demonstrated both vertical and lateral continuity of mineralization, supporting the Company’s view that Queensway represents a large, multi-target gold system with significant potential beyond the initial MRE.
2025 Milestones
During 2025, Queensway reached several important milestones that materially advanced the project’s technical maturity:
| ● | Publication of an MRE, establishing an initial estimate of the gold resource at Queensway; |
7
| |
Management’s Discussion and Analysis | |
For the year ended December 31, 2025 | |
(Expressed in Canadian Dollars, except share and per share amounts, unless otherwise indicated) | |
| ● | Completion of a PEA, demonstrating initial project economics, development concept and production strategy; and |
| ● | Continuation of drilling, geological modeling, and technical studies aimed at expanding and upgrading the resource while supporting longer-term development planning. |
These milestones marked a transition for Queensway from an exploration-focused project to an exploration-pre-development stage asset with a low initial capital expenditure and phased pathway to production.
Initial MRE
The initial MRE for Queensway marked a pivotal technical milestone in the advancement of the Company’s flagship asset. The initial MRE was prepared by SLR in accordance CIM Definition Standards and NI 43-101. SLR is independent of New Found Gold.
The MRE reflects the Company’s interpretation of the geological framework and drill data available as at March 15, 2025 (the “Effective Date”) and provides a technical foundation for ongoing studies and development planning. Mineral resources are reported in accordance with CIM definitions and are classified into categories that reflect differing levels of geological confidence. Mineral resources are not mineral reserves and do not have demonstrated economic viability.
Mineral Resource Estimate Summary
The table below summarizes the initial MRE for Queensway:
| | | | Tonnage | | Grade | | Contained Metal |
Zone | | Category1 | | (Mt) | | (g/t Au) | | (Moz Au) |
Open Pit |
| Indicated |
| 17.3 |
| 2.25 |
| 1.25 |
|
| Inferred |
| 9.0 |
| 1.24 |
| 0.36 |
Underground |
| Indicated |
| 0.8 |
| 5.76 |
| 0.14 |
|
| Inferred |
| 1.7 |
| 4.44 |
| 0.25 |
Total |
| Indicated |
| 18.0 |
| 2.40 |
| 1.39 |
|
| Inferred |
| 10.7 |
| 1.77 |
| 0.61 |
Notes:
| 1. | CIM (2014) definitions were followed for Mineral Resources. |
| 2. | Mineral Resources are estimated using a long-term gold price of US$2,200 per ounce, and a US$/C$ exchange rate of US$1.00 = C$1.43. |
| 3. | Open pit Mineral Resources are estimated at a cut-off grade of 0.3 g/t Au and constrained by a preliminary optimized pit shell with a pit slope angle of 45°, and bench height of 5 m. |
| 4. | Reasonable prospects for eventual economic extraction for underground Mineral Resources was demonstrated by constraining within reporting panels generated at a cut-off grade of 1.65 g/t Au, with heights (H) of 10 m, lengths (L) of 5 m and minimum widths of 1.8 m. |
| 5. | The optimized pit shell, underground reporting shapes, and cut-off grades were generated by assuming metallurgical recovery of 90%, standard treatment and refining charges, mining costs of $5.0/t moved for open pit and $120/t processed for underground, processing costs of $20/t processed, and general & administrative costs of $7.5/t processed. |
| 6. | Pierre Landry, P.Geo. of SLR, an independent Qualified Person who prepared the initial MRE is not aware of any environmental, permitting, legal, title, taxation, socio-economic, marketing, political, or other relevant factors that could materially affect the Mineral Resource estimate |
| 7. | Bulk density within the vein and halo mineralization domains is 2.7 t/m³. |
| 8. | Mineral resources that are not Mineral Reserves do not have demonstrated economic viability. |
| 9. | Numbers may not add due to rounding. |
Measured and Indicated Mineral Resources (“M&I”) totaling 18.0 Mt at an average gold grade of 2.40 g/t Au containing 1.39 Moz of gold. Inferred Mineral Resources total 10.7 Mt at an average grade of 1.77 g/t Au for 0.61 Moz of gold.
8
| |
Management’s Discussion and Analysis | |
For the year ended December 31, 2025 | |
(Expressed in Canadian Dollars, except share and per share amounts, unless otherwise indicated) | |
The QP is not aware of any environmental, permitting, legal, title, taxation, socio-economic, marketing, political, or other relevant factors that could materially affect the Mineral Resource estimate. No Mineral Reserves are defined for the property.
This MRE includes both OP and UG domains. In OP domains, Indicated Mineral Resources are estimated at approximately 17.3 Mt grading 2.25 g/t Au for 1.25 Moz Au, and Inferred Mineral Resources are estimated at approximately 9.0 Mt grading 1.24 g/t Au for 0.36 Moz Au. In underground domains, Indicated Mineral Resources total approximately 0.8 Mt grading 5.76 g/t Au for 0.14 Moz Au, and Inferred Mineral Resources total approximately 1.7 Mt grading 4.44 g/t Au for 0.25 Moz Au.
The MRE defines gold mineral resources within multiple high-grade zones along the AFZ and JBPFZ at Queensway, including the Keats and Iceberg zones which have consistently returned significant gold intercepts in drilling. The MRE is divided into AFZC, Appleton Fault Zone Peripheral (“AFZ Peripheral”) and JBP, with 96% (by metal) of the Indicated Resource and 87% (by metal) of the Inferred Resource located within the AFZC, for the total combined OP and UG Mineral Resources.
The resource database was closed on November 1, 2024 and contains 3,214 drill holes for a total of 723,387 m, for which 550,949 m have assay intervals. The Company recently completed a 74,000 m 2025 drill program, which is required to advance future economic studies. An updated MRE is planned to be completed in mid- 2026.
Protocols for drilling, sample preparation and analysis, verification, and security meet industry standard practices and are appropriate for the purposes of a mineral resource estimate. Mineral resource classification was based primarily on drill hole spacing, applied to designate contiguous zones of like classification. Mineral Resources are reported exclusive of mineral reserves, and there has been no demonstration of economic viability at this stage.
The Queensway MRE provides a robust technical basis for continued exploration and advancement planning. It supports ongoing efforts to prioritize drilling targets, refine project engineering and metallurgical work, and inform future economic assessments, including pre-feasibility or feasibility studies. The Company continues to pursue resource expansion potential, with drilling results outside the current MRE footprint demonstrating scope for growth both along strike and at depth.
Measured and Indicated mineral resources are supported by sufficient drilling density and geological confidence to allow for the application of technical and economic parameters in future studies. Inferred mineral resources are based on more limited information and carry a higher degree of uncertainty. There is no certainty that Inferred mineral resources will be converted to Measured or Indicated categories through further exploration.
The initial MRE for Queensway was prepared by an independent QP as defined under NI 43-101. The QP has reviewed and approved the scientific and technical content relating to the MRE disclosed in this MD&A. A full description of the estimation methodology, data verification, and supporting technical analyses is provided in the NI 43-101 technical report for the Queensway Gold Project, which is filed on SEDAR+ and available under the Company’s profile.
Queensway PEA
A PEA was completed for the Queensway Gold Project in July 2025, representing the first comprehensive economic evaluation of the project under a staged development framework. The PEA was prepared in accordance with NI 43-101 and reflects the interpretation of geological, technical, and economic factors available at the time of study.
9
| |
Management’s Discussion and Analysis | |
For the year ended December 31, 2025 | |
(Expressed in Canadian Dollars, except share and per share amounts, unless otherwise indicated) | |
PEA Overview and Development Concept
The Queensway Project is planned as a phased mining operation comprising a conventional OP, complemented by a high-grade UG mine. The development concept contemplates initial off-site toll milling, followed by construction of an on-site processing facility. The mineralized material is expected to be processed through a conventional flowsheet incorporating crushing and grinding, gravity concentration, flotation to produce a gold-bearing sulphide concentrate for off-site treatment, and cyanide leaching of flotation tailings to produce doré on site.
The PEA outlines a 15-year LOM with estimated recoverable gold production of 1.5 Moz, developed in three phases designed to reduce upfront capital requirements, enable early cash flow, and fund subsequent expansions through internal cash generation.
| ● | Phase 1 (Years 1–4) consists of an open-pit mining and crushing operation with high-grade material trucked to an off-site mill at approximately 700 tpd for the first five years of operation, while lower-grade material is stockpiled for future processing once the on-site processing plant is in operation. As outlined in the PEA, Phase 1 is estimated to require initial capital of $154.8M and is expected to produce an average of 69.3 Koz of Au per year at an AISC of US$1,282/oz in years 1 through 4. On January 26, 2026, the Company announced the Pine Cove Mill was selected for upgrading and expanding to accept Queensway Phase 1 mineralized material. |
| ● | Phase 2 (Years 5–15) involves the construction and operation of a 7,000 tpd on-site processing plant, with commissioning targeted in Year 5. The stockpiles created during Phase 1 and the UG high-grade material in Phase 3 will allow for grade sequencing, thereby prioritizing higher grade mined material during the initial years of processing to optimize the project economics. The mining rate and sequence for the OP will allow for in-pit tailings deposition for the life of the operation. Phase 2 demonstrates average annual gold production of 129.0 Koz and AISC of US$1,206/oz (from Year 5 to Year 13), including average annual production of 172.2 Koz and AISC of US$1,090/oz during the first five years of operation (project Year 5 to Year 9). |
| ● | Phase 3 (Years 6–10) involves the construction of a high-grade UG cut-and-fill mine commencing in Year 5. The UG mine is planned to operate from Year 6 to Year 10 at a nominal production rate of 700 tpd. The UG mine will consist of a series of five separate ramp systems to access the stopes and mine the mineralized material in a traditional mechanized cut-and-fill method with 3 m x 3 m heading size. The mineralized material will be hauled to surface using 20-tonne trucks. |
The deposit’s high-grade core supports a phased mine plan that prioritizes the processing of higher-grade material in the early years of operation. During Phase 1, stockpiles are generated from open-pit mining, while Phase 3 introduces underground high-grade material. By grade sequencing this material through the on-site processing facility, the Company optimizes project economics through accelerated early cash flow generation. Lower-grade stockpiled material is then processed from Year 13 through to the end of processing in Year 15, following the completion of mining operations.
10
| |
Management’s Discussion and Analysis | |
For the year ended December 31, 2025 | |
(Expressed in Canadian Dollars, except share and per share amounts, unless otherwise indicated) | |
PEA Summary
The PEA demonstrates the potential for a technically and economically viable mining operation at Queensway under the assumptions applied. Key economic metrics from the PEA include:
PRODUCTION1 | | Units | | Value |
LOM |
| years |
| 15 |
Total Mill Feed |
| ktonnes |
| 27,373 |
Phase 1: Off-Site Toll Mill |
| ktonnes |
| 1,150 |
Phase 2 and 3: On-Site Mill |
| ktonnes |
| 26,223 |
Average Head Grade |
| g/t Au |
| 1.85 |
Phase 1: Off-Site Toll Mill (Years 1-5) |
| g/t Au |
| 9.64 |
Phase 2: On-Site Mill (Years 5-9) |
| g/t Au |
| 2.22 |
Cut-off Grade (OP) |
| g/t Au |
| 0.3 |
Cut-off Grade (UG) |
| g/t Au |
| 2.68 |
Average Gold Recovery |
| % | | 91.9 |
Contained Gold |
| koz |
| 1,626 |
Recovered Gold |
| koz |
| 1,494 |
Average Annual Gold Production (Years 1-4) |
| koz/yr |
| 69.3 |
Average Annual Gold Production (Years 5-9) |
| koz/yr |
| 172.2 |
Average Production Mining Rate–Ph. 1 |
| tpd |
| 700 |
Average Production Mining Rate–Ph. 2 & Ph.3 |
| tpd |
| 7,000 |
Strip Ratio |
| — |
| 6.0 |
11
| |
Management’s Discussion and Analysis | |
For the year ended December 31, 2025 | |
(Expressed in Canadian Dollars, except share and per share amounts, unless otherwise indicated) | |
CAPITAL COSTS1 | | Units | | Value |
Initial Capital (Phase 1) | | $M |
| 154.8 |
Growth Capital (Phase 2 and 3) | | $M |
| 584.9 |
Sustaining Capital | | $M |
| 325.4 |
Reclamation and Closure Capital | | $M |
| 30.0 |
Total Capital Costs | | $M |
| 1,095.1 |
Total Operating Costs1,2 | | $M |
| 1,977 |
Royalty NSR | | % | | 0.40 |
Total Cash Cost | | US$/oz Au |
| 1,085 |
AISC (LOM)3 | | US$/oz Au |
| 1,256 |
AISC (Years 1-4)3 | | US$/oz Au |
| 1,282 |
AISC (Years 5-9)3 | | US$/oz Au |
| 1,090 |
| | | | |
FINANCIAL SUMMARY | | Units |
| Value |
Gold Price (Base Case) | | US$/oz Au |
| 2,500 |
Exchange Rate | | C$/US$ |
| 1.43 |
After-Tax NPV5% | | $M |
| 743 |
After-Tax IRR | | % | | 56.3 |
After-Tax Payback | | years |
| <2 |
Mine Net Revenue | | $M |
| 4,924 |
EBITDA4 | | $M |
| 2,947 |
EBITDA Margin | | % | | 59.8 |
| 1 | Denotes a “specified financial measure” within the meaning of National Instrument 52-112 – non-GAAP and Other Financial Measures Disclosure. See note on Non-IFRS Financial Measures. |
| 2 | Total operating costs refer to onsite charges that cover open pit mining, underground mining, third party processing and material handling, onsite processing,and onsite general & administrative costs. |
| 3 | AISC is calculated as the sum of treatment and refining charges, royalties, onsite operating costs, sustaining capital costs, and closure costs, divided by the quantity of ounces sold as further described below under Non-IFRS Financial Measures. |
| 4 | See note on Non-IFRS Financial Measures. |
Economic Analysis
At a base case consensus long-term gold price of US$2,500/oz and an exchange rate of 1.43 (C$/US$), Queensway Phase 1 generates an after-tax NPV5% of $742.6M and an IRR of 56.3%. Growth capital of $442.2M for Phase 2 is spent in Year 2 to Year 4 and is paid back in Year 5, less than one year after Phase 2 is in operation. The after-tax NPV5% increases to $1. 5 billion (“B”) and the IRR increases to 197% when the gold price is raised to US$3,300/oz Au.
After-Tax Cash Flow
Using the base case gold price of US$2,500/oz, the average annual after-tax cash flow is $75.2M and the cumulative LOM after-tax cash flow is estimated at $1,128.0M. The Phase 1 average annual after-tax operating cash flow is $117M, demonstrating the ability to pay back the initial capital of $154.8M in Year 2. The Company plans to reinvest the after-tax cash flow generated in Phase 1 to fund the Project growth capital needed in Phases 2 and 3, to be paid back in Year 5.
MRE Integration
The overall conversion of Mineral Resources to the PEA mine plan was 92% and 74% for the indicated and inferred categories, respectively. Only the AFZC was considered for the PEA. A lower conversion of the UG Inferred category is mainly attributed to
12
| |
Management’s Discussion and Analysis | |
For the year ended December 31, 2025 | |
(Expressed in Canadian Dollars, except share and per share amounts, unless otherwise indicated) | |
changes in the cutoff grade between the MRE and PEA. The MRE considered underground mining with the longhole open stoping method, while the PEA assumed the comparatively higher cost cut and fill method.
The PEA, with an effective date of June 30, 2025 was prepared by SLR in accordance with the 2019 CIM Definition Standards and NI 43-101. SLR is independent of New Found Gold.
The PEA includes sensitivity analyses evaluating the impact of changes in key variables such as gold price, operating costs, capital costs, and metallurgical recoveries. The sensitivity analysis demonstrates that project economics are most sensitive to changes in gold price and operating costs, which is typical for gold projects at this stage of development.
The PEA is preliminary and conceptual in nature, including economic analysis that incorporates Inferred Mineral Resources, which are considered speculative and cannot be assumed to be upgraded through further work into categories that support economic decision-making at the level of confidence required for Mineral Reserves.
There is no certainty that the projected outcomes or estimated economic results will be realized. Actual results may differ materially from those presented in the PEA due to changes in market conditions, regulatory environments, cost escalation, commodity prices, or other risks described in this MD&A.
The PEA provides a conceptual framework for advancing the Queensway Project and supports the evaluation of alternative development scenarios, prioritization of further exploration and infill drilling programs, advancement of engineering, metallurgical, and environmental studies; and consideration of future economic studies, including a potential pre-feasibility study.
The Company continues to advance Queensway through disciplined technical work, with the objective of further de-risking the project and evaluating development pathways supported by updated resources and technical studies.
Exploration Activities
Exploration activities at the Queensway Gold Project during 2025 were designed to support two parallel objectives: (1) advancing areas contributing to the initial MRE and PEA through infill and definition drilling focused on Phase 1 open pits, as defined in the PEA, and (2) continuing to test the broader district-scale potential of the Queensway land package through systematic step-out and target-generation drilling and earlier-stage exploration.
Throughout 2025, New Found Gold conducted a multi-rig diamond drilling program, supported by geological mapping, structural interpretation, and ongoing refinement of the Company’s geological model.
2025 Exploration program overview
During 2025, drilling activities were primarily focused along the AFZ, with selective drilling also completed on targets associated with the JBPFZ. The program was structured to balance near-term resource development with longer-term exploration upside.
Key phases of exploration activity during the year included:
| ● | Resource definition and infill drilling, particularly during H1/25, to support the preparation of the initial MRE announced on March 24, 2025; |
13
| |
Management’s Discussion and Analysis | |
For the year ended December 31, 2025 | |
(Expressed in Canadian Dollars, except share and per share amounts, unless otherwise indicated) | |
| ● | Follow-up and step-out drilling subsequent to the MRE, with results reported in a series of news releases during Q2/25 to Q3/25; and |
| ● | Target generation and reconnaissance drilling, incorporating geological and structural insights gained through ongoing interpretation. |
The Company reported multiple drilling updates throughout 2025, each of which provided assay results and geological commentary for specific drill programs and target areas.
Key themes emerging from the 2025 drilling results included:
| ● | Resource definition areas. Infill drilling within established mineralized zones demonstrated continuity of gold mineralization and supported the geological confidence applied in the initial MRE. These results informed both the classification of mineral resources and assumptions used in the PEA completed in mid-2025. |
| ● | Strike and depth extensions. Step-out drilling intersected gold mineralization outside the limits of the current resource model, confirming that mineralization remains open along strike and at depth. Drill results reported in mid- to late-2025 releases reinforced the interpretation of an extensive system with expansion potential at depth and along strike. |
| ● | Emerging and new targets. Drilling on targets generated through structural interpretation and surface geochemical analysis identified additional zones of gold mineralization beyond the core resource areas. These results expanded the inventory of prospective targets across the Queensway land package and underscored the district-scale nature of the project. |
The primary objective of the 2025 drilling program was a material improvement in geological understanding and confidence, rather than reliance on isolated intercepts.
Exploration work completed during 2025, which included approximately 74,000 m of diamond drilling, continued to refine the Company’s understanding of the structural controls on gold mineralization at Queensway. Drilling results supported the interpretation that gold mineralization is strongly associated with major fault zones and subsidiary structures, with localized high-grade zones occurring where favorable structural and lithological conditions coincide.
Key technical learnings from the 2025 program included enhanced understanding of the role of secondary structures branching off the AFZ, improved delineation of mineralized shoots and their controls on grade distribution and identification of geological vectors useful for prioritizing future drill targets. These learnings are being systematically incorporated into updated geological models and exploration planning.
Exploration and evaluation expenditures at Queensway during 2025 represented the majority of the Company’s total exploration spending. Costs were primarily related to drilling, geological personnel, assays, and supporting technical studies. Further detail regarding exploration expenditures is provided in “Results of Operations” and the consolidated financial statements.
Exploration strategy going forward
The Company views Queensway as a long-duration exploration and development asset with multiple pathways to value creation. Going forward, the exploration strategy is expected to focus on resource expansion and upgrading, particularly
14
| |
Management’s Discussion and Analysis | |
For the year ended December 31, 2025 | |
(Expressed in Canadian Dollars, except share and per share amounts, unless otherwise indicated) | |
through targeted drilling aimed at converting Inferred resources to higher-confidence categories, testing depth and strike extensions of known mineralized zones to assess scale and continuity and advancing high-priority regional targets generated through ongoing structural and geological analysis.
The Company intends to continue applying a disciplined, data-driven exploration approach that balances capital efficiency with the objective of unlocking the full district-scale potential of Queensway .
Pre-Development Studies and Advancement Considerations
During 2025, the Company advanced a range of pre-development studies and project-advancement activities at the Queensway Gold Project, building on the technical foundation established by the initial MRE and PEA.
These activities were undertaken to further de-risk the project, refine development concepts, and position Queensway for potential advancement to more detailed engineering and permitting stages, subject to future technical, regulatory, and financing considerations.
Metallurgical and processing studies
Metallurgical work at Queensway during 2025 focused on refining the understanding of gold recovery characteristics and supporting the processing assumptions applied in the preliminary economic assessment. Test work conducted to date has evaluated gold liberation, gravity recoverability, and leaching performance across representative samples of mineralized material.
Results from metallurgical testing have been incorporated into the conceptual processing flowsheet contemplated in the PEA and indicate that conventional processing methods may be applicable. Ongoing and future metallurgical programs are expected to focus on further variability testing, optimization of recovery parameters, and confirmation of assumptions across different mineralized domains.
Engineering and mine planning studies
Preliminary engineering and mine planning work was undertaken to support the conceptual development scenarios evaluated in the PEA. This work included high-level assessments of potential mining methods, infrastructure layouts, processing plant configuration, and tailings management concepts appropriate for a project at this stage of advancement.
Engineering studies completed during the year were conceptual in nature and were intended to inform trade-off analyses and identify key technical considerations for future study phases. No detailed engineering has been completed to date, and further work will be required to advance the project beyond the PEA level.
15
| |
Management’s Discussion and Analysis | |
For the year ended December 31, 2025 | |
(Expressed in Canadian Dollars, except share and per share amounts, unless otherwise indicated) | |
Hammerdown was added to the Company’s asset portfolio following the completion of the Maritime acquisition in November 2025. Hammerdown is located in Central Newfoundland and Labrador and represents a complementary set of gold deposits and processing assets that materially enhance the Company’s development profile by providing near-term advancement optionality alongside the longer-term growth potential of Queensway (Figure 3).
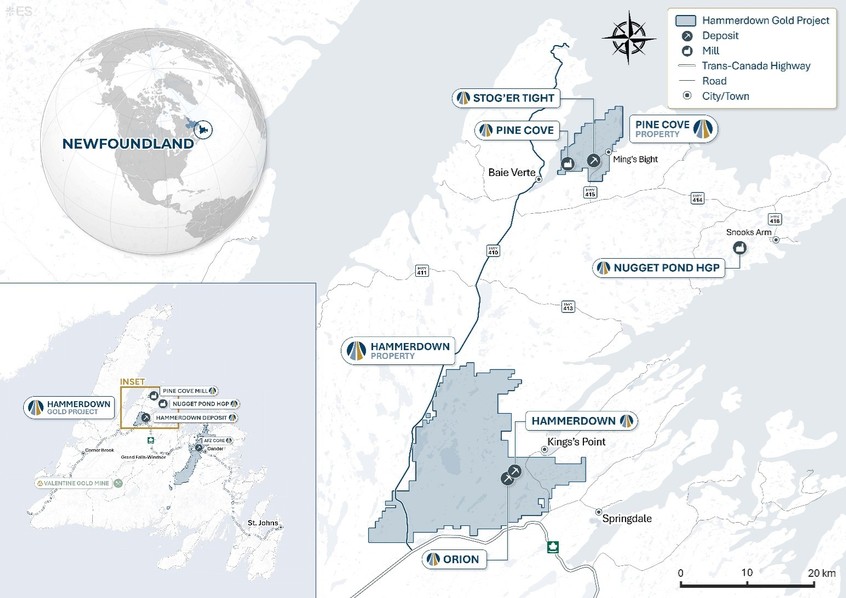
Figure 3. Hammerdown, showing key deposits, processing facilities and infrastructure.
The acquisition of Maritime transformed the Company from a single-asset exploration company into a multi-asset gold company with assets at differing stages of development, all within a single, mining-positive jurisdiction. Management believes that the combination of Queensway and Hammerdown provides a balanced portfolio, offering both district-scale exploration upside and assets with defined development pathways and existing infrastructure.
16
| |
Management’s Discussion and Analysis | |
For the year ended December 31, 2025 | |
(Expressed in Canadian Dollars, except share and per share amounts, unless otherwise indicated) | |
Technical and Development Activities
Hammerdown
Hammerdown adds permitted milling and tailing facilities, along with near-term gold production to the Company’s asset portfolio. Hammerdown includes Pine Cove Mill, the Hammerdown deposit, the Orion deposit, the Stog’er Tight deposit, the Nugget Pond HGP, a 44,650-ha land package with significant upside exploration potential, and associated supporting infrastructure (Figure 3).
The Hammerdown Technical Report, which includes a PEA and updated MRE was filed on March 17, 2026.
Pine Cove Mill
The Pine Cove Mill is a permitted gold processing facility and forms a key component of the Maritime asset portfolio. In 2025 Maritime completed refurbishment and recommissioning activities at Pine Cove Mill, with the objective of establishing processing capability to support Hammerdown mineralized material.
Activities at the Pine Cove Mill during 2025 were focused on upgrading the facility to a state of operational readiness, completing commissioning-related work, and ensuring ongoing compliance with applicable permits and regulatory requirements.
Following the Maritime Acquisition, the Company began an assessment of the Pine Cove Mill’s role within the combined portfolio, including evaluation of processing capacity, operating readiness, and integration with both the Hammerdown and Queensway development plans.
Key Outcomes of the Hammerdown PEA:
| ● | The Hammerdown PEA has returned an after-tax NPV5% of $199.2M at the base case gold price (variable price deck: long-term price of US$3,475/oz averaging US$3,656/oz Au) and an after-tax NPV5% of $415.1M at the upside gold price of US$5,000/oz; |
| ● | Over a 13-year period, the total mill feed throughput is expected to be 3.2Mt,with an average mined grade of 2.19 g/t Au, a post-sorting mill feed head grade of 2.89 g/t Au and average annual gold production of approximately 19.3 Koz; |
| ● | Average LOM cash costs and AISC of US$2,149/oz and US$2,429/oz, respectively; |
| ● | Total capital costs (with contingency) are estimated at $24.3M and reclamation, and closure costs are estimated at $18.0M; and |
| ● | The PEA mine plan was developed from Measured and Indicated Mineral Resources of 3,328 kt grading 2.43 g/t containing 260.0 Koz of gold and Inferred Mineral Resources of 2,132 kt grading 2.34 g/t gold containing 161.0 Koz of gold. |
17
| |
Management’s Discussion and Analysis | |
For the year ended December 31, 2025 | |
(Expressed in Canadian Dollars, except share and per share amounts, unless otherwise indicated) | |
LOM Plan:
| ● | Continuation of the conventional open pit truck-and-shovel operation executed by a mining contractor, as currently underway at the Hammerdown deposit; |
| ● | Process plant feed rate of 700 tpd with the addition of sorting at the Hammerdown and Orion deposits; |
| ● | Hammerdown deposit pit mined in multiple phases, followed by the Orion deposit pit and four Stog’er Tight deposit pits sequentially; |
| ● | The Hammerdown deposit accounts for 75% of mineralized material mined (82% of recovered gold), with mining taking place in this zone from year 1 to year 10 and the Orion and Stog’er Tight deposits account for 25% of mineralized material mined (18% of recovered gold), which will be mined from year 8 to year 12; |
| ● | The average material mined, consisting of mineralized material, waste rock and overburden, is 12,300 tpd during the LOM, ranging between 11,800 tpd and 18,400 tpd from year 1 to year 6 and between 2,500 tpd and 13,700 tpd from year 7 to year 12; |
| ● | The average strip ratio over the LOM is 11.4, with total material mined of 54.1 Mt including 4.4 Mt of mineralized material at an average grade of 2.19 g/t Au; |
| ● | With sorting, a total of 3.2 Mt of mineralized material at an average grade of 2.89 g/t Au will be processed with total gold recovery of 251.3 Koz of Au; and |
| ● | Process plant average gold recovery for the zones being mined from year 1 to year 4 is estimated to be 87.2% and 84.3% thereafter, with LOM average gold recovery of 85.5%. |
18
| |
Management’s Discussion and Analysis | |
For the year ended December 31, 2025 | |
(Expressed in Canadian Dollars, except share and per share amounts, unless otherwise indicated) | |
Hammerdown Gold Project PEA Summary: Key Metrics and Project Economics
PRODUCTION1 | | 2026 PEA | | Units |
LOM |
| 13 |
| years |
Total Potential Mill Feed Tonnage |
| 3,159 |
| kt |
Average Mined Grade |
| 2.19 |
| g/t Au |
Mill Feed Head Grade (Post-Sorting) |
| 2.89 |
| g/t Au |
Cut-off Grade (Range Depending on Deposit) |
| 0.41-0.56 |
| g/t Au |
Process Plant Average Gold Recovery |
| 85.5 | | % |
Contained Gold |
| 306.6 |
| Koz |
Recovered Gold |
| 251.3 |
| Koz |
Average Annual Gold Production |
| 19.3 |
| Koz/yr |
Average Mineralized Material Mining Rate (Post Sorting) |
| 700 |
| tpd |
Strip Ratio |
| 11.4:1 |
| waste:mineralized material |
| | | | |
OPERATING & CAPITAL COSTS1 |
| |
| |
Total Operating Costs1,2 |
| 725.9 | | $M |
Sustaining Capital Costs (with contingency) |
| 97.7 | | $M |
Total Capital Costs (with Contingency) |
| 24.3 | | $M |
Reclamation and Closure Capital |
| 18.0 | | $M |
Royalty NSR |
| 17.4 | | $M |
Total Cash Cost |
| 2,149 | | US$/oz Au |
AISC (LOM) |
| 2,429 | | US$/oz Au |
| | | | |
FINANCIAL SUMMARY |
| | | |
Gold Price (Average LOM Base Case) |
| 3,656 | | US$/oz Au |
Exchange Rate |
| 1.39 | | C$/US$ |
Discount Rate |
| 5 | | % |
Pre-Tax NPV5% (Base Case Gold Price: US$3,656 average LOM) |
| 318.5 | | $M |
After-Tax NPV5% (Base Case Gold Price: US$3,656 average LOM) |
| 199.2 | | $M |
Pre-Tax NPV5% (Upside Gold Price: US$5,000) |
| 680.8 | | $M |
After-Tax NPV5% (Upside Case Gold Price: US$5,000) |
| 415.1 | | $M |
Notes:
| 1 | Denotes a “specified financial measure” within the meaning of National Instrument 52-112 – non-GAAP and Other Financial Measures Disclosure. See note on “Non-IFRS Financial Measures”. |
| 2 | Total operating costs refer to onsite charges that cover open pit mining, processing and material handling, and onsite general and administrative costs. |
| 3 | AISC is calculated as the sum of doré transportation, treatment and refining charges, royalties, onsite operating costs, and sustaining capital costs, divided by the quantity of ounces sold. |
The Hammerdown PEA is preliminary in nature, it includes Inferred Mineral Resources that are considered too speculative geologically to have economic considerations applied to them that would enable them to be categorized as Mineral Reserves, and there is no certainty that the PEA will be realized. No Mineral Reserves are defined for the Project.
Mineral Resource Estimate
Mineral Resources are reported for the Hammerdown, Orion, and Stog’er Tight deposits, which are planned to share the Pine Cove Mill. M&I resources for the projects combined total 3.328 Mt at an average gold grade of 2.43 g/t Au for 260 Koz of contained Au. Inferred Mineral Resources total 2.132 Mt at an average grade of 2.34 g/t Au for 161.0 Koz of contained Au.
19
| |
Management’s Discussion and Analysis | |
For the year ended December 31, 2025 | |
(Expressed in Canadian Dollars, except share and per share amounts, unless otherwise indicated) | |
Hammerdown Consolidated MRE (effective date January 22, 2026)1,2
| | | | | | | | Tonnage | | Grade | | Contained |
Property | | Deposit | | Mining Method | | Category | | (kt) | | (g/t Au) | | Oz (Koz)3 |
Hammerdown |
| Hammerdown |
| Open Pit |
| Measured |
| 271 |
| 8.24 |
| 72 |
| | | | |
| Indicated |
| 1,823 |
| 1.96 |
| 115 |
| | | | |
| Measured & Indicated |
| 2,094 |
| 2.77 |
| 187 |
| | | | |
| Inferred |
| 973 |
| 2.59 |
| 81 |
Hammerdown |
| Orion |
| Open Pit |
| Indicated |
| 598 |
| 1.75 |
| 33.6 |
| | | | |
| Inferred |
| 91 |
| 1.92 |
| 5.6 |
| | |
| Underground |
| Indicated |
| 636 |
| 1.92 |
| 39.3 |
| | | | |
| Inferred |
| 523 |
| 2.16 |
| 36.2 |
Pine Cove |
| Stog’er Tight |
| Open Pit |
| Inferred |
| 545 |
| 2.16 |
| 37.8 |
| | | | |
| TOTAL | | | | | | |
| | | | |
| Measured |
| 271 |
| 8.24 |
| 72 |
| | | | |
| Indicated |
| 3,057 |
| 1.91 |
| 188 |
| | | | |
| Measured & Indicated |
| 3,328 |
| 2.43 |
| 260 |
| | | | |
| Inferred |
| 2,132 |
| 2.34 |
| 161 |
Notes:
| 1 | Refer to the Appendix to see MRE notes and data verification for each deposit. |
| 2 | The mineral resource database was closed on June 16, 2025, and contains 93,818 metres (“m”) of drilling in 1,108 diamond drill holes (“DDH”) and 310 m in 86 channels at Hammerdown, 46,017.34 m of drilling in 219 DDH at the Orion deposit and 35,246.42 m of drilling in 523 DDH at the Stog’er Tight deposit that were used to inform the MRE presented. The QP, as defined by National Instrument 43-101 – Standards of Disclosure of Mineral Projects (“NI 43-101”), responsible for the MRE were Christian Beaulieu of Mineralis Consulting Services Inc. for the Hammerdown deposit, Chafana Sako of Norda Stelo Inc. for the Orion and Stog’er Tight deposits, and Stephen Coates of Evomine Consulting Inc. for constraining volumes on all deposits. |
| 3 | Numbers may not total due to rounding. |
Comparison of PEA Relative to 2022 Feasibility Study
The following section provides a comparison of the updated Mineral Resources reported herein to the technical report titled “Feasibility Study Technical Report: Hammerdown Gold Project, Newfoundland” with an effective date of August 15, 2022, prepared by JDS Energy and Mining Inc. for Maritime Resources Corp. (the “2022 Feasibility Study”).
Changes to the Hammerdown deposit MRE subsequent to the 2022 Feasibility Study primarily reflect the application of new estimation parameters informed by increased data confidence from the tightly spaced grade control drilling completed in 2024 and 2025. Specifically, tighter distance constraints were applied to high grade intervals, which affected overall grade and ultimately reduced it relative to the previous estimate. Additional changes include an increase in resources classified as inferred due to missing data validation needed to confirm the positions of historically mined out underground stopes. New optimization parameters also contribute to loss in contained ounces, as well as additional depletion of historically mined stopes. The methodology used to report the MRE in a narrow-vein environment also contributes to lower grades as more waste is accounted for as must-take material. Adjusted cut-off grades and the reporting methodology contributed to the increase in contained metal. The Orion and Stog’er Tight deposits were not included in the 2022 Feasibility Study.
20
| |
Management’s Discussion and Analysis | |
For the year ended December 31, 2025 | |
(Expressed in Canadian Dollars, except share and per share amounts, unless otherwise indicated) | |
Hammerdown Gold Project Consolidated MRE Compared to 2022 Feasibility Study3
| | 2026 PEA1, 4 | | 2022 Feasibility Study (open pit only)2, 3 | ||||||||
| | Tonnage | | Grade | | Contained Oz | | Tonnage | | Grade | | Contained Oz |
Resource Category | | (kt) | | (g/t Au) | | (Koz) | | (kt) | | (g/t Au) | | (Koz) |
Measured |
| 271 |
| 8.24 |
| 72 |
| 698 |
| 5.47 |
| 123 |
Indicated |
| 3,057 |
| 1.91 |
| 188 |
| 2,146 |
| 3.00 |
| 207 |
Measured & Indicated |
| 3,328 |
| 2.43 |
| 260 |
| 2,845 |
| 3.61 |
| 330 |
Inferred |
| 2,132 |
| 2.34 |
| 161 |
| 302 |
| 1.31 |
| 13 |
Notes:
1 | Using a cut-off grade of 0.35 g/t Au for Hammerdown (excluding Wisteria), 0.48 g/t Au for Hammerdown Wisteria area, 0.47 g/t Au for Orion open pit, 1.13 g/t Au for Orion underground and 0.42 g/t Au for Stog’er Tight open pit. |
2 | 2022 Feasibility Study, with an effective date of August 15, 2022, prepared by JDS Energy and Mining Inc. for Maritime Resources Corp. |
3 | The Orion and Stog’er Tight deposits were not included in the 2022 Feasibility Study. |
4 | Refer to the Appendix for additional MRE notes. |
Mining
The PEA contemplates open pit mining from the Hammerdown, Orion and Stog’er Tight deposits, designed as conventional truck and shovel open pit operations operated by a contractor. Run of mine (“ROM”) mineable material from the Hammerdown and Orion deposits will be sent to the on-site crushing and sorting plant to produce mill feed that will be hauled to the Pine Cove Mill for final processing. A total of 4,354 Mt of ROM mineable material is scheduled to be mined from all open pits with a diluted grade averaging 2.19 g/t Au. A total of 48.0 Mt of non-acid generating waste rock will also be produced and stored in a waste rock stockpile adjacent to the open pits. The open pits have been designed and scheduled to maximize project NPV. Pit slope optimization has been undertaken based on geotechnical data collected between 2020 and 2021. The Hammerdown deposit’s open pit development consists of two phases of pushbacks with overburden thickness averaging less than 2 m.
Mining will be completed by conventional drilling, blasting, loading and hauling on 4 m benches in mineralized material and 8 m benches in waste where practical at the Hammerdown deposit and 5 m benches at the Orion and Stog’er Tight deposits. Waste loading and haulage will be handled by 3 m3 hydraulic excavators and 41-tonne payload articulated haul trucks. Mineralized material loading and hauling will be handled by a fleet of 2 m3 hydraulic excavators with a 7 m3 front end loader as backup and 38-tonne payload articulated haul trucks.
Grade control in the open pit is a key part of the mining process and will be accomplished through a combination of 4 to 5 m bench heights with 2 m flitches, controlled blasting, 50,000 m of close spaced diamond drilling (15 m centres, 10 m vertically) to identify and report vein orientations and grades to the mine planners, selective excavation under GPS control, and mine geological control. The sorting process is integrated to remove dilution taken with the narrow veins during the mining process.
Processing and Recovery
The Pine Cove Mill was commissioned on low grade stockpiles in 2025 and commenced processing Hammerdown deposit mineable material in Q4/25.
The mineralized material from the Hammerdown, Orion and Stog’er Tight deposits will be processed at Pine Cove Mill, a permitted processing plant and in-pit tailings facility. Mineable material from the three deposits will be trucked to the Mill and processed at a nominal rate of 700 tpd. The flowsheet consists of a ball mill and flotation circuit that produces a gold-pyrite concentrate, cyanide leach, filtration and Merrill Crowe gold recovery circuit.
21
| |
Management’s Discussion and Analysis | |
For the year ended December 31, 2025 | |
(Expressed in Canadian Dollars, except share and per share amounts, unless otherwise indicated) | |
The process plant average gold recovery for the zones being mined from year 1 to year 4 is estimated to be 87.2% and 84.3% thereafter, with LOM average gold recovery of 85.5%.
The Company has recently purchased a sorter which it plans to commission in H2/26. Sorting at the Hammerdown deposit is expected to commence in 2027, at the Orion deposit in 2033 and once commenced, continue over the LOM at these two deposits.
Additional Value Potential from Exploration Upside
Hammerdown hosts multiple gold-bearing trends with potential for resource growth and new discovery over the land package. To date, only limited near surface work has been completed across large portions of the land holdings, yet the Project presents a broad pipeline of early- to advanced-stage exploration targets. Near resource expansion opportunities remain strong at the Hammerdown, Orion, and Stog’er Tight deposits, where drilling to date has largely been confined to the upper 220 m with minimal lateral testing along key structural corridors. The limited deeper testing that has been completed to date has intersected mineralization at vertical depths of up to 400 m at the Orion deposit, highlighting the opportunity for continued resource growth at depth.
Development Status and Path Forward
As at December 31, 2025, Hammerdown was classified as a development-stage asset within the Company’s portfolio. While substantial technical and permitting work has been completed historically, advancement beyond the current stage remains subject to further technical review, updated economic evaluation, market conditions, and the availability of financing.
Environmental, Social and Governance (“ESG”)
Environmental, social, and governance considerations form an integral part of the business strategy of New Found Gold. The Company recognizes that responsible mining, exploration and development practices are essential to maintaining its social license to operate, managing risk, and creating long-term shareholder value. ESG activities during 2025 were focused on maintaining regulatory compliance, advancing environmental baseline work, engaging with local communities and stakeholders, and strengthening governance practices across the Company’s expanded asset portfolio.
Environmental Stewardship
Queensway
The Company has undertaken a range of environmental baseline studies across key biophysical and socio-economic components of Queensway. These include terrestrial and aquatic ecology, air, and water quality, noise and light surveys, acid rock drainage and metal leaching characterization, and hydrogeological assessments. The scope and scale of these programs are consistent with industry best practices for projects transitioning from exploration to advanced environmental permitting.
Environmental sensitivities within the area studied have been identified and are generally manageable with standard permitting conditions and mitigation strategies. Key considerations include a portion of the mineral licenses falling within protected water supply areas and Crown Lands. No critical habitat for species at risk has been identified within the area studied.
22
| |
Management’s Discussion and Analysis | |
For the year ended December 31, 2025 | |
(Expressed in Canadian Dollars, except share and per share amounts, unless otherwise indicated) | |
Regulatory frameworks at both the federal and provincial levels have been reviewed, and development of Phase 1 will require provincial Environmental Assessment (“EA”) registration and permitting but not a Federal EA as the site will have a production capacity of 700 tpd which is below the 5,000 tpd threshold. A federal EA is expected to be required for Phase 2 and 3 as the on-site production plant outlined in the PEA will exceed the 5,000 tpd threshold. To date, the Company has demonstrated proactive engagement with regulators and local communities and is committed to continued collaboration as Queensway advances.
Hammerdown
Hammerdown benefits from a history of environmental baseline studies, permitting activities, and regulatory engagement, reflecting its more advanced stage of development. Environmental management activities during 2025 included maintaining compliance with existing permits at Hammerdown. Following the closing of the Maritime acquisition, the Company initiated a review of permitting status and regulatory obligations associated with Hammerdown to ensure continuity of compliance and to identify any additional requirements associated with future development scenarios.
Health and Safety
The Company is committed to providing a safe working environment for employees, contractors, and visitors across all sites. Health and safety practices during 2025 were focused on hazard identification, training, and adherence to applicable occupational health and safety regulations, consistent with the scale and nature of exploration and development activities undertaken during the year.
Following the Maritime Acquisition, the Company began aligning health and safety policies and procedures across its operations to ensure consistent standards and reporting practices. No material health and safety incidents were reported during the year.
Community and Stakeholder Engagement
Community and stakeholder engagement are key components of the Company’s ESG framework. At Queensway, engagement activities during 2025 focused on maintaining open communication with local communities, land users, and other stakeholders affected by exploration and pre-development activities. The Company seeks to understand local perspectives and to address concerns in a transparent and respectful manner.
Hammerdown is located in established mining communities in Central Newfoundland, where Maritime historically maintained ongoing engagement with local stakeholders. Following the acquisition, New Found Gold continued these engagement efforts and began integrating stakeholder engagement practices across the combined portfolio.
Governance
The Company’s governance framework is designed to support effective oversight, risk management, and accountability. During 2025, governance activities included Board and committee oversight of strategic initiatives, technical studies, and the Maritime acquisition. Following completion of the Maritime acquisition, the Company implemented governance changes to reflect the expanded scope and complexity of the business. Board composition was updated, including the appointment of a new Audit Committee Chair who brings extensive experience as both a mining operator and financial executive, strengthening the Committee’s capacity to oversee the Company’s growing operational and financial reporting requirements. In addition, members of the Board conducted site visits to the Company’s key assets, and management undertook a review and enhancement of internal policies and procedures. Together, these initiatives are intended to strengthen oversight as the Company advances multiple assets at different stages of development.
23
| |
Management’s Discussion and Analysis | |
For the year ended December 31, 2025 | |
(Expressed in Canadian Dollars, except share and per share amounts, unless otherwise indicated) | |
ESG Integration and Risk Management
The Company continues to integrate ESG considerations into its broader risk management and decision-making processes. Environmental compliance, stakeholder relations, health, safety and environmental performance, and governance practices are considered alongside technical and financial factors when evaluating exploration and development activities.
As the Company advances its projects, ESG practices are expected to evolve in scope and complexity, commensurate with project maturity and regulatory requirements. Further disclosure regarding ESG initiatives and performance is expected to be provided as the Company progresses through future stages of development.
On November 13, 2025 (the “Closing Date”), the Company acquired all of the issued and outstanding common shares of Maritime (the “Maritime Shares”) that it did not already own in exchange for the issuance of New Found Gold common shares to former Maritime shareholders, pursuant to a statutory plan of arrangement under the Business Corporations Act (British Columbia) (the “Transaction”). As part of the Transaction, the Company acquired the Hammerdown assets (the principal components are itemized above).
Under the terms of the Transaction, each Maritime shareholder received 0.75 of a common share (the “Exchange Ratio”) of New Found Gold (each whole share, a “New Found Gold Share”) as consideration for each Maritime share, which resulted in the issuance of 94,254,209 New Found Gold common shares. Additionally, at closing, the Company held 102,923 common shares of Maritime, which were revalued to their fair value of $225,402 and included as part of the purchase consideration. Each outstanding Maritime Share purchase warrant became exercisable for New Found Gold Shares issuable on exercise and adjusted in accordance with the Exchange Ratio.
In addition, each option to purchase Maritime Shares (each, a “Maritime Option”) was cancelled and exchanged for a replacement option to acquire from New Found Gold such number of New Found Gold Shares equal to the product of: (a) that number of Maritime Shares that were issuable upon exercise of such Maritime Option immediately prior to the Closing Date, and (b) the Exchange Ratio, at an exercise price per New Found Gold Share equal to the quotient determined by dividing the exercise price per Maritime Share at which such Maritime Option was exercisable immediately prior to the Closing Date, by the Exchange Ratio. Each outstanding Maritime Share purchase warrant became exercisable for New Found Gold Shares issuable on exercise and adjusted in accordance with the Exchange Ratio.
The Company issued 2,475,960 replacement options and 15,485,137 replacement warrants valued at $4,072,396 and $31,524,814, respectively.
The Transaction resulted in the Company obtaining control of Maritime, and the Transaction has been accounted for as a business combination using the acquisition method in accordance with IFRS 3, Business Combinations. The Company has consolidated the operating results, cash flows and net assets of Maritime from November 13, 2025. For the period from November 13, 2025 to December 31, 2025, Maritime contributed revenue of $5,806,973 and incurred a loss before income and mining taxes of $64,475. If the acquisition of Maritime had taken place on January 1, 2025, the unaudited pro forma total consolidated revenue and loss before income and mining taxes for the Company would have been approximately $13,594,649 and $(54,716,452), respectively, for the year ended December 31, 2025.
Acquisition-related costs of $4,787,735 have been expensed and are presented separately in the consolidated statements of loss and comprehensive loss for the year ended December 31, 2025.
24
| |
Management’s Discussion and Analysis | |
For the year ended December 31, 2025 | |
(Expressed in Canadian Dollars, except share and per share amounts, unless otherwise indicated) | |
As of December 31, 2025, given the recent closing of the Transaction, the Company had not yet completed the analysis to assign fair values to all assets acquired and liabilities assumed, and therefore the purchase price allocation for the Transaction is preliminary. The preliminary price allocation will be subject to further refinement and may result in material changes to the estimated fair value of assets acquired and liabilities assumed. In particular, the Company will continue to evaluate new information about the facts and circumstances that existed as of the Closing Date pertaining to the fair value of mineral property, exploration and evaluation assets, property, plant and equipment and deferred taxes. The purchase price allocation adjustments can be made throughout the end of the Company’s measurement period ending no later than November 13, 2026.
The aggregate purchase consideration for the acquired assets, and its preliminary allocation to the acquired assets net of the assumed liabilities is as follows:
Purchase price: | | | |
Fair value of common shares issued (1) | | $ | 275,222,302 |
Fair value of replacement share-based compensation issued (2) | |
| 4,072,396 |
Fair value of replacement share purchase warrants issued (3) | |
| 31,524,814 |
Fair value of Maritime shares held the Company (4) | |
| 225,402 |
| | $ | 311,044,914 |
| | | |
Net assets acquired: | |
| |
Cash | | $ | 9,028,587 |
Receivables | |
| 1,644,055 |
Inventories | |
| 10,075,453 |
Prepaids and deposits | |
| 2,943,423 |
Property and equipment (5) | |
| 70,508,742 |
Mining interests | |
| 167,737,597 |
Exploration and evaluation assets | |
| 29,929,410 |
Goodwill | |
| 121,074,297 |
Accounts payable and accrued liabilities | |
| (9,421,347) |
Loans payable | |
| (620,238) |
Lease liabilities | |
| (486,195) |
Reclamation and closure cost provisions | |
| (7,327,000) |
Deferred income tax liabilities | |
| (84,041,870) |
Total assets acquired, net of liabilities | | $ | 311,044,914 |
(1) | The fair value of the Company’s common shares was determined using the Company’s share price of $2.92 on the Closing Date. |
(2) | The fair value of the replacement options were determined using the Black-Scholes pricing model using the following assumptions: Share price: $2.92; Exercise price: ranges from $0.50 to $1.80; Expected life: ranges from 0.19 to 4.02 years; Volatility: ranges from 61.42% to 79.11%; Risk-free rate: ranges from 2.21% to 2.70%; Dividend yield: 0%. |
(3) | The fair value of the replacement share purchase warrants issued were determined using the Black-Scholes pricing model using the following assumptions: Share price: $2.92; Exercise price: ranges from $0.50 to $1.20; Expected life: ranges from 0.75 to 1.83 years; Volatility: ranges from 66.05% to 78.57%; Risk-free rate: ranges from 2.27% to 2.46%; Dividend yield: 0%. |
(4) | The fair value of the Maritime common shares held by the Company immediately prior to the closing date were determined using the Company’s share price of $2.92 on the Closing Date. |
(5) | Included in property and equipment is $449,532 of ROU assets. |
Goodwill represents the expected value of operational synergies between the Queensway Project and the Hammerdown Mine/Pine Cove Mill assets, and additional exploration potential arising from the Transaction. None of the goodwill is expected to be deductible for income and mining tax purposes.
25
| |
Management’s Discussion and Analysis | |
For the year ended December 31, 2025 | |
(Expressed in Canadian Dollars, except share and per share amounts, unless otherwise indicated) | |
Fair value estimates for the identifiable assets acquired and liabilities assumed in the Maritime acquisition were determined using valuation techniques appropriate to each asset and liability category. The fair value of the Hammerdown mineral interest was derived using an income approach, whereby the overall enterprise value of the Hammerdown operation was determined under a discounted cash flow (“DCF”) model based on current mine plans, operating and capital cost forecasts, MREs, gold price assumptions and risk-adjusted discount rates. Property and equipment was valued primarily using a cost approach, whereby replacement cost was estimated using a factored capital cost estimate for the Pine Cove Mill processing assets and published equipment cost guides for Nugget Pond equipment, with applicable allowances for obsolescence. A market approach was applied to light-duty vehicles, generators and pumps based on comparable sales data. Inventory was valued by reference to the expected selling price, less remaining processing costs, contributory asset charges for the use of property and equipment and an allowance for execution profit; supplies and materials were carried at historical cost as an approximation of fair value. Exploration and evaluation assets were carried at historical cost except for the Orion underground deposit which was valued based on an adjusted implied value per ounce with reference to values from comparable transactions. Reclamation and closure cost provisions were measured using expected future cash flows discounted at a credit-adjusted risk-free rate. The valuation models are sensitive to changes in key assumptions including gold price forecasts, discount rates, replacement cost estimates and the timing and cost of rehabilitation and closure obligations.
Share-for-debt settlement
On November 13, 2025, the Company entered into a debt settlement agreement (“Settlement Agreement”) with SCP Resource Finance LP (“SCP”) to settle an aggregate amount of $3,276,712 in outstanding debt related to fees incurred by Maritime pursuant to the terms of a letter of agreement with SCP dated March 20, 2024, as amended on August 8, 2025, whereby SCP was appointed as financial advisor in connection with strategic matters related to any financing or a transaction resulting in the sale of Maritime.
Pursuant to the terms of the Settlement Agreement, the Company issued 1,085,003 common shares on November 26, 2025 with a fair value of $4,632,963, resulting in a loss of $1,356,251 reported under transaction costs in the consolidated statements of loss and comprehensive loss for the year ended December 31, 2025.
Royalty Arrangement
In connection with the acquisition of Maritime, the Company assumed an existing royalty arrangement relating to the Green Bay block (“Green Bay”) within the Hammerdown Property, which encompasses the Hammerdown and Orion deposits. During 2016, there were 21,070,000 royalty units sold for $0.01 per unit for gross proceeds of $210,700 in connection with project financing activities. The purchasers of the 2016 offerings were provided the option to purchase royalty units that would return 100% of the original investment made by the purchasers paid out of production from the Company’s Green Bay project (“the Project”). Total royalties payable from the Royalty Units (“Royalty Payment”) are capped at $3,160,500, an amount equal to the total equity units and royalty units purchased. Royalty payments will be made annually beginning on the first anniversary of the date of commencement of commercial production (“Commercial Production”) for the Project. Commercial Production is defined as operation at an average rate of not less than 70% of the initial rated capacity of the mining facilities, or the shipping of products for the purpose of earning a profit, and explicitly excludes test milling, pilot plant operations and initial tune-up periods. Royalty Payments will be funded solely from 10% of annual net cash flow from the Project, with net cash flow representing net production revenues realized from the Project after deduction of all Project operating and debt servicing costs. At the option of the Company, Royalty Payments may be made in cash, physical gold, or a combination thereof.
26
| |
Management’s Discussion and Analysis | |
For the year ended December 31, 2025 | |
(Expressed in Canadian Dollars, except share and per share amounts, unless otherwise indicated) | |
Comparability of Results
Comparisons between the current and prior periods are affected by several significant factors. The acquisition of Maritime, which closed on November 13, 2025, resulted in the consolidation of Maritime’s financial results from the acquisition date through to December 31, 2025, representing approximately seven weeks of activity. Prior-year periods do not include any contribution from Maritime, including revenue, cost of sales, or the associated segment assets and liabilities. Accordingly, the results for the year ended December 31, 2025 are not directly comparable to the year ended December 31, 2024.
The following discussion of results of operations should be read in conjunction with the audited consolidated financial statements of New Found Gold for the year ended December 31, 2025, and the related notes thereto.
| | Three months ended | | Year ended | ||||||||
| | December 31, 2025 | | December 31, 2024 | | December 31, 2025 | | December 31, 2024 | ||||
Revenue | | $ | 5,806,973 | | $ | — | | $ | 5,806,973 | | $ | — |
Cost of sales | |
| 5,688,718 | |
| — | |
| (5,688,718) | |
| — |
Gross margin | |
| 118,255 | |
| — | |
| 118,255 | |
| — |
Exploration and evaluation expenditures | |
| (13,585,975) | |
| (15,413,220) | |
| (41,380,407) | |
| (52,563,340) |
General and administrative expenses | |
| (3,039,267) | |
| (1,354,004) | |
| (11,656,734) | |
| (6,864,539) |
Transaction costs | |
| (4,787,735) | |
| — | |
| (4,787,735) | |
| — |
Share-based compensation | |
| (4,159,731) | |
| (73,799) | |
| (6,284,821) | |
| (889,045) |
Loss from operations | |
| (25,454,453) | |
| (16,814,023) | |
| (63,991,442) | |
| (60,316,924) |
Other income | |
| 9,932,700 | |
| 3,433,429 | |
| 16,024,252 | |
| 10,048,570 |
Loss before income and mining taxes | |
| (15,521,753) | |
| (13,407,594) | |
| (47,967,190) | |
| (50,268,354) |
Income and mining tax recoveries - deferred | |
| 394,570 | |
| — | |
| 394,570 | |
| — |
Net loss and comprehensive loss | | $ | (15,127,183) | | $ | (13,407,594) | | $ | (47,572,620) | | $ | (50,268,354) |
Loss per share — basic and diluted | | $ | (0.05) | | $ | (0.07) | | $ | (0.20) | | $ | (0.26) |
Revenue
Revenue of $5,806,973 was recognized for the first time in the Company’s history, comprising gold revenue of $5,797,899 and silver revenue of $9,074, generated from the sale of gold doré bars produced at Pine Cove Mill using Hammerdown mineralized material during the period from November 13 to December 31, 2025. Revenue is recognized under IFRS 15, Revenue from Contracts with Customers, at the point in time when control of the gold passes to the customer upon delivery. During the period, one customer accounted for 100% of revenue; however, gold can be sold through numerous global market traders, and the Company is not economically dependent on a limited number of customers.
Cost of Sales
Cost of sales amounted to $5,688,718 for the period from November 13 to December 31, 2025, comprising operating expenses of $5,671,431 and selling expenses of $17,287. Operating expenses consisted of contractors ($2,369,864), salaries and employee benefits ($1,006,200), raw materials and consumables ($783,402), repairs and maintenance ($121,641), site administration ($80,938), and depreciation ($13,263), for a sub-total of $4,375,308, plus a charge of $1,296,123 related to change in inventories. The modest gross margin of $118,255 reflects the operational ramp-up phase and the effect of change in inventories relating to the fair value adjustment in the purchase price allocation of $2,167,896. The Company expects to achieve positive mine-level margins as production reaches steady state in 2026.
27
| |
Management’s Discussion and Analysis | |
For the year ended December 31, 2025 | |
(Expressed in Canadian Dollars, except share and per share amounts, unless otherwise indicated) | |
Exploration and Evaluation Expenditures
Drilling expenditures during the year ended December 31, 2025 decreased by $7,833,209, reflecting the transition from intensive resource definition drilling to a more targeted program. Technical studies and resource evaluation costs increased by $2,868,999 in alignment with the scope of the 2025 exploration program, which included infill, definition, and step-out drilling in support of the MRE and PEA. Trenching decreased by $2,433,830 following the completion of the Keats and Iceberg surface excavation programs in 2024. Over 74,000 metres of diamond drilling were completed in the 2025 program.
Exploration and evaluation expenditures also include costs incurred by Maritime Resources Corp. to the extent such costs were incurred after the acquisition date and consolidated into the Company’s results.
General and Administrative (“G&A”) Expenses
For the year ended December 31, 2025, G&A expenses were $11,656,734 compared to $6,864,539 for the year ended December 31, 2024. The $4,792,195 increase is largely due to:
| ● | An increase of $1,340,864 in office and other expenses. Office and other expenses were $3,447,183 for the year ended December 31, 2025 compared to $2,106,319 for the year ended December 31, 2024. The increase is primarily due to higher corporate overheads associated with the expansion of the Company’s operational footprint and corporate infrastructure following the acquisition of Maritime, including incremental governance, reporting, insurance, and compliance costs incurred in managing a larger, multi-asset organization. |
| ● | An increase of $2,684,828 in salaries and benefits. Salaries and benefits were $5,296,838 for the year ended December 31, 2025 compared to $2,612,010 for the year ended December 31, 2024. The increase is due to the strengthening of the management team and expanded corporate infrastructure during the year, including the appointment of a new CEO, COO, CFO, and other senior personnel, as well as termination benefits of $1,104,480 paid to departing executives in connection with the management transition. |
| ● | Professional fees were $2,098,097 for the year ended December 31, 2025 compared to $1,332,556 for the year ended December 31, 2024. The increase is primarily due to higher audit, legal, and compliance costs associated with the Company’s dual-listing obligations on the TSX Venture Exchange and NYSE American, the expanded corporate structure following the Maritime acquisition, higher market capitalization and the preparation of regulatory filings in connection with the transaction. |
| ● | Depreciation was $814,616 for the year ended December 31, 2025 compared to $813,654 for the year ended December 31, 2024, remaining substantially unchanged year-over-year. |
Transaction Costs
During the year ended December 31, 2025, the Company incurred transaction-related costs of $4,787,735 in connection with the acquisition of Maritime compared to $nil for the year ended December 31, 2024. These costs primarily consisted of legal, advisory, valuation, accounting, and other professional fees and were expensed as incurred in accordance with IFRS 3. No comparable transaction costs were incurred during the year ended December 31, 2024.
28
| |
Management’s Discussion and Analysis | |
For the year ended December 31, 2025 | |
(Expressed in Canadian Dollars, except share and per share amounts, unless otherwise indicated) | |
Share-Based Compensation
Share-based compensation was $6,284,821 for the year ended December 31, 2025 compared to $889,045 for the year ended December 31, 2024. The $5,395,776 increase is primarily due to the grant of 7,122,070 stock options during the year ended December 31, 2025 at a weighted average fair value of $1.34 per option, resulting in option-related expense of $2,667,026, compared to 240,000 stock options granted during the year ended December 31, 2024 with continued vesting of previously granted options totaling $889,045. The increase also reflects the recognition of $3,260,738 in respect of 2,394,348 equity-settled restricted share units (“RSUs”) granted to directors and officers and $357,057 in respect of 300,000 cash-settled RSUs granted to a consultant during the year ended December 31, 2025, with no comparable RSU grants during the prior year. The expense is non-cash in nature and is recognized over the vesting period of the respective awards in accordance with IFRS 2 – Share-based Payments.
Other Income and Expenses
For the year ended December 31, 2025, other income was $16,024,252 compared to $10,048,570 for the year ended December 31, 2024. The $5,975,682 increase is largely due to the following:
| ● | An increase of $9,255,369 in gains on investments. Gains on investments were $6,347,116 for the year ended December 31, 2025 compared to losses of $2,908,253 for the year ended December 31, 2024. The increase is primarily due to the reclassification of the Company’s equity investment in Kirkland Lake Discoveries Corp. to fair value through profit or loss following the loss of significant influence in October 2025, which resulted in the recognition of a gain on the remeasurement to fair value at the date of reclassification, together with realized gains on the disposal of other investments and unrealized gains on the revaluation of the Company’s investment portfolio at December 31, 2025. |
| ● | An increase of $1,000,237 in impairment reversal on equity investment. The Company recognized a reversal of a previously recorded impairment loss of $1,000,237 on its equity investment in Kirkland Lake Discoveries Corp. during the year ended December 31, 2025 compared to $nil for the year ended December 31, 2024. |
| ● | A decrease of $2,119,618 in other expenses. Other expenses were $194,179 for the year ended December 31, 2025 compared to $2,313,797 for the year ended December 31, 2024. The decrease is primarily due to the settlement of a legal claim of $1,750,100 recognized during the year ended December 31, 2024 in connection with the issuance of 370,000 common shares pursuant to a settlement agreement with ThreeD Capital Inc. and 1313366 Ontario Inc., with no comparable expense in the current year. In addition, Part XII.6 tax decreased by $861,626 during the year ended December 31, 2025 due to a lower balance of unspent flow-through proceeds renounced in year 1 under the Look-Back Rule in accordance with the Income Tax Act of Canada. |
The increase in other income was partially offset by:
| ● | A decrease of $4,860,821 in settlement of flow-through share premium liability. Settlement of flow-through share premium liability was $7,565,501 for the year ended December 31, 2025 compared to $12,426,322 for the year ended December 31, 2024. The Company incurred $26,249,995 of qualifying Canadian exploration expenses and derecognized $7,565,501 of its flow-through premium liability during the year ended December 31, 2025 compared to $45,500,423 incurred and $12,426,322 derecognized during the year ended December 31, 2024. The decrease reflects the timing of flow-through share issuances, with the June 2025 issuances generating a premium liability of $16,242,600 that will be substantially settled as qualifying expenditures are incurred through to December 31, 2026. |
29
| |
Management’s Discussion and Analysis | |
For the year ended December 31, 2025 | |
(Expressed in Canadian Dollars, except share and per share amounts, unless otherwise indicated) | |
| ● | A decrease of $1,451,258 in interest income. Interest income was $1,418,145 for the year ended December 31, 2025 compared to $2,869,403 for the year ended December 31, 2024. The decrease is primarily due to the disposal of the Company’s secured notes receivable from Maritime during the year, which had been a significant source of interest income in the prior year, partially offset by higher interest earned on increased average cash balances following the equity financings completed during 2025. |
Income Taxes
A deferred income and mining tax recovery of $394,570 was recognized for the year ended December 31, 2025 (2024 – $nil). For 2025, the income tax recovery at the statutory rate of 27% on the pre-tax loss of $47,967,190 was substantially offset by unrecognized current year tax benefits of $10,691,006, flow-through renunciations of $1,334,205, and other non-deductible expenses of $871,480, partially offset by a mining tax recovery of $326,348. For 2024, the income tax recovery at the statutory rate of 27% was offset by flow-through renunciations ($12,285,000), other non-deductible differences, and changes in unrecognized deductible temporary differences.
Through the Maritime acquisition on November 13, 2025, the Company recognized net deferred tax liabilities of $84,041,870, reflecting temporary differences arising from the fair value adjustments in the purchase price allocation. At December 31, 2025, the Company’s net deferred tax liabilities of $83,647,300 primarily related to fair value uplifts on mineral properties, property, plant and equipment, and mining tax temporary differences, partially offset by deferred tax assets on non-capital losses, reclamation provisions, and share issue costs.
As at December 31, 2025, the Company had unrecognized deductible temporary differences of approximately $146,585,000 (2024 – $104,846,000), including exploration and evaluation assets of $54,392,000, non-capital losses of $55,088,000, capital losses of $24,831,000, and other temporary differences. The Company has Canadian non-capital loss carryforwards of approximately $80,673,000 expiring between 2028 and 2045, and capital loss carryforwards of approximately $24,830,000 (2024 – $18,630,000) that can be carried forward indefinitely.
Cash and Cash Equivalents
Cash and cash equivalents at December 31, 2025 were $58,838,699 (2024: $22,317,548), an increase of $36,521,151. The increase reflects net financing inflows of $82,428,343 (principally the bought deal and private placement proceeds) and $9,028,587 of cash acquired in the Maritime acquisition, partially offset by cash used in operating activities of $55,147,267.
Property, Plant and Equipment (“PP&E”)
PP&E increased from $8,056,658 to $250,544,133, an increase of $242,487,475, driven mainly by the Maritime acquisition which added $238,246,338 in PP&E at fair value, comprised of property, plant and equipment ($57,237,532 including $449,532 of right of use (“ROU”) assets), mining interests ($167,737,597), and construction-in-progress ($13,271,209). Other capital additions totaled $3,573,677. Depreciation for the year was $827,879.
Exploration and Evaluation (“E&E”) Assets
E&E assets increased from $34,505,484 to $77,664,022, an increase of $43,158,538, driven by the Maritime acquisition ($29,929,410 in exploration properties), the Exploits claims acquisition ($12,548,526), acquisition of other claims ($261,232), and claim staking, license renewals and option payments ($419,370).
30
| |
Management’s Discussion and Analysis | |
For the year ended December 31, 2025 | |
(Expressed in Canadian Dollars, except share and per share amounts, unless otherwise indicated) | |
Other Significant Balance Sheet Items
Inventories of $8,817,268 (2024 - nil) represent a new category arising from the Maritime acquisition: stockpiled mineralized material ($1,482,252), work-in-process ($5,515,887), finished goods ($1,188,739), and supplies and consumables ($630,390). No inventory write-downs were recognized. Investments increased from $926,019 to $8,895,559, primarily due to the transfer of the Kirkland Lake Discoveries Corp. investment ($8,583,750 fair value). Prepayments and deposits increased from $1,480,341 to $3,353,473 due to the restricted deposit of $2,400,000 assumed from the Maritime acquisition representing financial assurance for reclamation and closure cost provisions. Receivables increased from $2,209,948 to $4,325,473, principally reflecting higher sales tax receivables.
Liabilities
Total liabilities increased from $7,448,306 to $117,032,395, principally due to liabilities assumed in the Maritime acquisition: reclamation and closure cost provisions ($7,327,000), net deferred income tax liabilities ($84,041,870), accounts payable ($9,421,347), loans payable ($620,238), and lease liabilities ($486,195). Reclamation and closure cost provisions at December 31, 2025 amounting to $10,870,068, entirely non-current, reflecting Maritime’s obligations (discounted at 3.22%) plus the Company’s pre-existing Queensway reclamation obligations which were reclassified to non-current and discounted at 3.85% based on a 15-year estimated operating life.
The flow-through share premium liability of $8,677,099 represents the unamortized premium on the June 2025 flow-through share issuances, requiring $30,106,905 of qualifying CEE by December 31, 2026.
Shareholders’ Equity
Shareholders’ equity increased from $66,570,705 to $419,097,255. Common shares outstanding increased from 200,457,994 to 342,329,665. Key equity transactions included: bought deal (28,980,000 common shares at $63,480,000), private placement (12,269,939 common shares at $20,000,001), Maritime acquisition (94,254,209 shares valued at $275,222,290), Exploits claims (2,821,556 shares valued at $12,160,906), stock option exercises (1,838,399 shares for $2,547,271 in proceeds), warrant exercises (533,102 shares for $516,666 in proceeds), and share-based compensation of $5,927,761. These increases were offset by the flow-through premium of $16,242,600, share issue costs of $4,004,528, and the net loss of $47,572,620. Warrants of $30,349,683 reflect the 15,485,137 replacement warrants issued in the Maritime acquisition valued at $31,254,813 net of warrants exercised.
Liquidity and Capital Resources
As at December 31, 2025, the Company had cash and cash equivalents of $58,838,699, working capital of $62,559,017 (current assets of $84,230,472 less current liabilities of $21,671,455), and total shareholders’ equity of $419,097,255. The Company’s liquidity was significantly strengthened during 2025 through equity financings amounting to $83,480,001 and the $9,028,587 of cash acquired in the Maritime acquisition.
The Company manages its cash balances conservatively, holding funds primarily in high-quality financial institutions. Working capital fluctuations during the year were primarily driven by exploration expenditures at the Queensway Gold Project, development-related activities at Hammerdown following acquisition, and transaction-related costs associated with the Maritime acquisition.
31
| |
Management’s Discussion and Analysis | |
For the year ended December 31, 2025 | |
(Expressed in Canadian Dollars, except share and per share amounts, unless otherwise indicated) | |
Cash Flow Summary
| | Three months ended | | Year ended | ||||||||
| | December 31, 2025 | | December 31, 2024 | | December 31, 2025 | | December 31, 2024 | ||||
Cash used in operating activities | | $ | (20,433,566) | | $ | (19,052,473) | | $ | (55,147,267) | | $ | (55,683,060) |
Cash generated from investing activities | |
| 7,016,605 | |
| 1,358,355 | |
| 9,262,045 | |
| (3,188,293) |
Cash generated from financing activities | |
| 1,130,883 | |
| 911,226 | |
| 82,428,343 | |
| 27,301,231 |
Net increase (decrease) in cash | | $ | (12,297,421) | | $ | (16,782,892) | | $ | 36,521,151 | | $ | (31,567,261) |
Operating cash outflows decreased by $535,793 to $55,147,267, driven by operating cash margin from mine operation of $2,286,151 and lower exploration and evaluation expenses, partially offset by higher salaries, consulting fees and G&A expenses. Cash from investing activities increased by $12,450,338 from cash acquired from the Maritime acquisition ($9,028,587) and proceeds from the sale of secured notes and investments ($3,530,634), partly offset by expenditures incurred for mineral claims staking and additions to E&E assets ($1,483,911) and purchases of PP&E ($1,776,242). Financing inflows increased by $55,127,112, reflecting the bought deal ($63,480,000) and private placement ($20,000,001) along with option and warrant exercises ($3,063,937), partially offset by share issue costs ($4,004,528). In connection with the acquisition of Maritime, the consideration was primarily satisfied through the issuance of common shares and other equity instruments of the Company, with limited cash outlay. As a result, the acquisition did not materially reduce the Company’s cash balance at closing, although transaction-related costs were incurred and expensed.
Financing Activities
During 2025, the Company completed equity financings totaling $83,480,001 to fund ongoing exploration activities, technical studies, and general corporate activities.
Capital Requirements and Outlook
The Company’s future capital requirements include: (i) the continued ramp-up of Hammerdown to steady-state production; (ii) the 2026 exploration program at Queensway and satisfaction of $30,106,905 of flow-through expenditure commitments by December 31, 2026; (iii) advancement of the Queensway Phase 1 development, including the EPCM contract and the approximately $155M initial capital expenditure; and (iv) corporate G&A.
The Company may seek additional financing through equity issuances, debt facilities, project-level financing, or other structures, subject to market conditions and regulatory approvals. There is no assurance that financing will be available on acceptable terms.
Capital Management
The Company’s objectives in managing capital are to ensure sufficient liquidity to support planned activities, maintain financial flexibility, and minimize undue shareholder dilution while advancing its portfolio of gold assets. Management monitors capital resources on an ongoing basis and adjusts exploration and development plans as necessary to align with available funding.
There were no externally imposed capital requirements to which the Company was subject during the year ended December 31, 2025.
32
| |
Management’s Discussion and Analysis | |
For the year ended December 31, 2025 | |
(Expressed in Canadian Dollars, except share and per share amounts, unless otherwise indicated) | |
As at December 31, 2025, the Company had certain contractual commitments and contingent obligations arising in the normal course of business, primarily related to exploration activities, mineral property agreements, leases, and corporate obligations.
Contractual obligations recognized in the consolidated statements of financial position as at December 31, 2025 are shown below. The amounts presented represent the future undiscounted principal and interest cash flows, and therefore, do not equate to the carrying amounts on the consolidated statements of financial position.
| | Within 1 year | | 2-3 years | | 4-5 years | | More than 5 years | | Total | |||||
Accounts payable and accrued liabilities | | $ | 12,339,524 | | $ | — | | $ | — | | $ | — | | $ | 12,339,524 |
Lease liabilities | |
| 251,871 | |
| 185,792 | |
| 72,662 | |
| 526 | |
| 510,851 |
Loans payable | |
| 110,660 | |
| 221,323 | |
| 221,323 | |
| 85,661 | |
| 638,967 |
Reclamation and closure cost provisions | |
| — | |
| 946,600 | |
| 1,010,033 | |
| 13,904,109 | |
| 15,860,742 |
| | $ | 12,702,055 | | $ | 1,353,715 | | $ | 1,304,018 | | $ | 13,990,296 | | $ | 29,350,084 |
Mineral Property Commitments
Royalty obligations on the Queensway Project include NSRs ranging from 0.4% to 3.00%, with buy-back provisions totalling $4,250,000 that would reduce NSRs to 0.5%–1.5%. The Exploits claims carry a 1.0% NSR with a right to repurchase 0.5% for $750,000 within three years. The Kingsway Project carries a 1.0% NSR and a $1/oz Resource Payment at commencement of commercial production, and advance royalty of $50,000/year commencing on March 3, 2026. The Green Bay, Sprucy Pond, and Inomin properties are subject to various NSRs with buy-back provisions.
Remaining VOA Option Agreement payments consist of $600,000 cash plus 129,224 common shares on or before November 2026, and $800,000 cash plus 119,284 shares on or before November 2027. The Company also commits to acquire additional claims pursuant to the Exploits claims purchase agreement for consideration comprising 725,543 common shares depending on the outcome of a court case relating to these claims.
Flow-through commitments require $30,106,905 of qualifying CEE by December 31, 2026.
Contingencies
As part of the acquisition of Maritime, the Company assumed obligations under a royalty deed relating to Green Bay. Under the terms of the royalty deed, the Company is required to pay holders of 21,070,000 royalty units an amount equal to 10% of Net Cash Flow from Green Bay, commencing on the first anniversary of the date of commencement of Commercial Production. Total payments under the royalty deed are capped at $3,160,500.
As at December 31, 2025, the Company had not declared Commercial Production. The obligation to make Royalty Payments is contingent on the future commencement of Commercial Production and the realization of positive net cash flow, both of which are subject to operational, regulatory, and market uncertainties. No Royalty Payments have been made as at December 31, 2025.
33
| |
Management’s Discussion and Analysis | |
For the year ended December 31, 2025 | |
(Expressed in Canadian Dollars, except share and per share amounts, unless otherwise indicated) | |
Assessment of Commitments and Contingencies
Management monitors the Company’s commitments and contingencies on an ongoing basis and believes that the existing obligations can be met through current cash resources and planned financing activities. Actual outcomes may differ from management’s assessment due to changes in circumstances, regulatory requirements, or other factors beyond the Company’s control.
The following discussion summarizes selected quarterly financial information for New Found Gold for the eight most recently completed fiscal quarters. This information should be read in conjunction with the Company’s audited consolidated financial statements and unaudited interim financial statements prepared in accordance with IFRS.
Amounts in $000’s except per share amounts | | Q4 2025 | | Q3 2025 | | Q2 2025 | | Q1 2025 | | Q4 2024 | | Q3 2024 | | Q2 2024 | | Q1 2024 | ||||||||
Revenue | | $ | 5,807 | | $ | — | | $ | — | | $ | — | | $ | — | | $ | — | | $ | — | | $ | — |
Cost of sales | |
| (5,689) | |
| — | |
| — | |
| — | |
| — | |
| — | |
| — | |
| — |
Exploration and evaluation expenses | |
| (13,586) | |
| (13,424) | |
| (8,640) | |
| (5,730) | |
| (15,413) | |
| (12,861) | |
| (10,128) | |
| (14,161) |
General and administrative expenses | |
| (3,040) | |
| (3,081) | |
| (1,710) | |
| (3,826) | |
| (1,354) | |
| (1,676) | |
| (2,033) | |
| (1,801) |
Share-based compensation | |
| (4,160) | |
| (766) | |
| (1,511) | |
| 153 | |
| (74) | |
| (189) | |
| (75) | |
| (551) |
Transaction costs | |
| (4,788) | |
| — | |
| — | |
| — | |
| — | |
| — | |
| — | |
| — |
Other income (expenses) | |
| 9,933 | |
| 4,326 | |
| 1,299 | |
| 466 | |
| 3,433 | |
| 3,142 | |
| 142 | |
| 3,331 |
Income and mining tax recoveries - deferred | | | 395 | | | — | | | — | | | — | | | — | | | — | | | — | | | — |
Net loss and comprehensive loss | |
| (15,128) | |
| (12,945) | |
| (10,562) | |
| (8,937) | |
| (13,408) | |
| (11,584) | |
| (12,094) | |
| (13,182) |
Loss per share – basic and diluted | |
| (0.05) | |
| (0.06) | |
| (0.05) | |
| (0.04) | |
| (0.07) | |
| (0.06) | |
| (0.06) | |
| (0.07) |
Total assets | |
| 536,130 | |
| 119,946 | |
| 113,133 | |
| 61,720 | |
| 74,019 | |
| 89,672 | |
| 79,522 | |
| 79,033 |
Cash and cash equivalents | |
| 58,839 | |
| 71,136 | |
| 66,420 | |
| 12,368 | |
| 22,318 | |
| 39,108 | |
| 52,227 | |
| 50,252 |
The Company’s quarterly results are primarily driven by the timing and scale of exploration and development activities, the level of mining operations, general and administrative expenditures, and transaction-related costs. Prior to the acquisition of Maritime in November 2025, the Company did not generate operating revenues. Beginning in the fourth quarter of 2025, quarterly results include revenue and cost of sales from gold production at the Hammerdown Mine and Pine Cove Mill. Quarterly net losses fluctuate based on the level and timing of activities undertaken during each period.
Revenue of $5,806,973 from gold and silver sales was recognized for the first time in the fourth quarter of 2025, reflecting operations at the Hammerdown Mine and Pine Cove Mill for the period from November 13 to December 31, 2025. Cost of sales of $5,688,718 resulted in a gross margin of $118,255, reflecting the operational ramp-up phase. No revenue or cost of sales was recognized in any prior quarter presented.
34
| |
Management’s Discussion and Analysis | |
For the year ended December 31, 2025 | |
(Expressed in Canadian Dollars, except share and per share amounts, unless otherwise indicated) | |
Exploration and evaluation expenditures varied significantly between quarters during 2025, reflecting the phased execution of drilling programs at the Queensway Gold Project. Higher expenditures were generally incurred during quarters in which multi-rig drilling programs were active, while lower expenditures reflect periods of reduced drilling intensity, data analysis, and planning activities. Following the acquisition of Maritime in November 2025, quarterly exploration expenditures also reflect costs associated with the Maritime exploration properties from the acquisition date onward. Prior periods do not include any contribution from Maritime.
General and administrative expenses showed quarter-to-quarter variability, primarily driven by personnel costs including termination benefits of $1,104,480 paid to departing executives in the third quarter of 2025, and professional fees relating to legal, consulting and advisory services relating to the Maritime acquisition and public company expenses in the fourth quarter. Share-based compensation during the year ended December 31, 2025 represents new option and RSU grants to the reconstituted management team and board of directors. Fourth quarter transaction costs of $4,787,735 were incurred in connection with the Maritime acquisition.
The Company reported a net loss in each quarter presented. Quarterly net losses were influenced by the level of exploration activity, share-based compensation expense, other income items including the settlement of flow-through share premium liabilities and gains or losses on investments, and transaction-related costs incurred in connection with the Maritime acquisition during the fourth quarter of 2025.
The acquisition of Maritime closed during the fourth quarter of 2025 and resulted in the consolidation of Maritime’s financial results from the acquisition date forward, including revenue of $5,806,973 and a net loss and comprehensive loss of $64,475. As a result, fourth-quarter results are not directly comparable to prior quarters, which did not include any contribution from Maritime. Total assets increased from $74,019,011 at December 31, 2024 to $536,129,650 at December 31, 2025, principally reflecting the assets acquired in the transaction.
Comparability Considerations
Quarter-to-quarter and year-over-year comparisons are affected by the discretionary nature of exploration expenditures, the timing of technical studies, equity financings, the commencement of mining operations in the fourth quarter, and the impact of acquisition-related costs. Accordingly, management cautions readers that period-to-period fluctuations may not be indicative of underlying trends or future performance.
As at December 31, 2025, New Found Gold had 342,329,665 common shares issued and outstanding (December 31, 2024 – 200,457,994). The Company’s common shares are listed for trading on the TSX Venture Exchange under the symbol “NFG” and on the NYSE American under the symbol “NFGC.”
Share Capital Movements
During the year ended December 31, 2025, the Company’s issued and outstanding common shares increased by 141,871,671 shares, primarily attributable to the following issuances:
| ● | 28,980,000 common shares issued under a bought deal offering on June 12, 2025, comprising 24,610,000 flow-through shares at $2.29 per share and 4,370,000 non-flow-through shares at $1.63 per share, for aggregate gross proceeds of $63,480,000; |
35
| |
Management’s Discussion and Analysis | |
For the year ended December 31, 2025 | |
(Expressed in Canadian Dollars, except share and per share amounts, unless otherwise indicated) | |
| ● | 12,269,939 common shares issued under a non-brokered private placement on August 27, 2025 at $1.63 per share for gross proceeds of $20,000,001; |
| ● | 94,254,209 common shares valued at $275,222,290 issued to former Maritime Resources Corp. shareholders pursuant to the plan of arrangement on November 13, 2025; |
| ● | 1,085,003 common shares valued at $4,632,963 issued to settle $3,276,712 in outstanding advisory fees owing to SCP Resource Finance LLP in connection with the Maritime acquisition. |
| ● | 2,821,556 common shares with a value of $12,160,906 issued to Exploits Discovery Corp. pursuant to the property acquisition agreement on December 5, 2025; |
| ● | 1,838,399 common shares issued on the exercise of 1,854,070 stock options at a weighted average exercise price of $1.38 per share for gross proceeds of $2,547,271; |
| ● | 533,102 common shares issued on the exercise of warrants for gross proceeds of $516,666; and |
| ● | 89,463 common shares with a value of $261,232 issued pursuant to the acquisition of exploration and evaluation assets in accordance with property option agreements. |
Share issue costs of $4,004,528 were incurred during the year in connection with the bought deal offering and private placement.
Stock Options
As at December 31, 2025, the Company had 7,631,500 stock options outstanding (December 31, 2024 – 10,556,750) with exercise prices ranging from $1.00 to $8.98 and a weighted average exercise price of $2.85. Of these, 4,818,723 options were exercisable at a weighted average exercise price of $3.29. Stock options are granted under the Company’s Option Plan, which permits the grant of options up to a maximum of 10% of the issued and outstanding common shares, subject to regulatory and shareholder approval.
During the year ended December 31, 2025, 7,122,070 stock options were granted at a weighted average exercise price of $1.74 per option, 1,854,070 options were exercised at a weighted average price of $1.38, and 8,193,250 options were forfeited at a weighted average exercise price of $4.68 in connection with the management transition and expiry of previously granted options. Share-based compensation expense related to stock options was $2,667,026 for the year (2024 – $889,045).
Restricted Share Units
During the year ended December 31, 2025, the Company granted 2,394,348 equity-settled RSUs to directors and officers, vesting in equal installments over three years, and 300,000 cash-settled RSUs to a consultant, vesting on September 26, 2026. As at December 31, 2025, 2,394,348 equity-settled RSUs were outstanding (December 31, 2024 – nil). Share-based compensation expense related to equity-settled and cash-settled RSUs was $3,260,738 and $357,057, respectively, for the year (2024 – $nil).
36
| |
Management’s Discussion and Analysis | |
For the year ended December 31, 2025 | |
(Expressed in Canadian Dollars, except share and per share amounts, unless otherwise indicated) | |
Warrants
As at December 31, 2025, the Company had 14,952,035 warrants outstanding (December 31, 2024 – nil). Warrants outstanding relate to replacement warrants issued in connection with the Maritime acquisition, whereby each outstanding Maritime warrant became exercisable for New Found Gold common shares adjusted per the 0.75 Exchange Ratio. A total of 15,485,137 replacement warrants were issued on November 13, 2025. Out of the replacement warrants issued, 533,102 warrants were exercised for gross proceeds of $516,666 as of December 31, 2025.
Fully Diluted Share Capital
Assuming the exercise of all outstanding stock options, equity-settled RSUs, and warrants, the Company would have 367,307,548 common shares outstanding on a fully diluted basis as at December 31, 2025.
Subsequent Changes
Subsequent to December 31, 2025, there were 1,460,714 stock options and 1,191,170 warrants exercised for gross proceeds of $2,064,180 and $1,269,875, respectively. In addition, 266,666 vested RSUs were settled.
The table below summarizes the Company’s outstanding equity instruments as at December 31, 2025 and March 25, 2026.
Instrument | | December 31, 2025 | | March 25, 2026 |
Common shares outstanding |
| 342,329,665 |
| 345,212,549 |
Stock options |
| 7,631,500 |
| 6,223,286 |
RSUs (equity-settled) |
| 2,394,348 |
| 2,127,682 |
Warrants |
| 14,952,035 |
| 13,760,865 |
Fully diluted shares |
| 367,307,548 |
| 367,324,382 |
During the year ended December 31, 2025, the Company’s related parties include its subsidiaries, key management personnel and companies having common directors and officers.
All transactions with related parties have occurred in the normal course of operations and are measured at the amount of consideration paid or received. Other than compensation in the form of salaries, consulting or directors’ fees, bonuses, share based payments (options, RSUs), termination benefits, and other fees paid to related parties, all as disclosed below, there were no other material transactions with this group of individuals.
A summary of the Company’s related party transactions with corporations having similar directors and officers is as follows:
| | Year ended December 31 | ||||
| | 2025 | | 2024 | ||
PJH Consulting, LLC (1) | | $ | 84,093 | | $ | — |
EarthLabs Inc. (2) | |
| — | |
| 18,000 |
Notz Capital Corp. (3) | |
| 46,921 | |
| 177,310 |
(1) | Amounts incurred for administrative services provided by a close family member of Paul Huet, Chair of the Board of directors. PJH Consulting, LLC is a related entity of Paul Huet, Chair of the Board of Directors. These charges were included in general and administrative expenses. |
(2) | EarthLabs Inc. is a related entity having the following common former director and officer to the Company: Denis Laviolette, Former Director and President. These costs were charged to exploration and evaluation expenses. |
37
| |
Management’s Discussion and Analysis | |
For the year ended December 31, 2025 | |
(Expressed in Canadian Dollars, except share and per share amounts, unless otherwise indicated) | |
(3) | Notz Capital Corp. is a related entity of a director. These charges were charged to general and administrative expenses. |
There are no ongoing contractual commitments resulting from these transactions with related parties.
Key management personnel compensation
Key management personnel include those persons having authority and responsibility for planning, directing and controlling the activities of the Company as a whole. The Company has determined that key management personnel consist of executive and non-executive directors and members of executive management.
The remuneration of the Company’s directors and other key management personnel during the years ended December 31, 2025 and 2024 were as follows:
Year ended December 31, 2025
| | Salaries and | | Share-based | | | | | | | ||
| | Consulting | | Compensation | | Bonus | | Total | ||||
Keith Boyle, Chief Executive Officer | | $ | 425,806 | | $ | 763,501 | | $ | — | | $ | 1,189,307 |
Collin Kettell, Former Executive Chairman and Chief Executive Officer | |
| 38,400 | |
| — | |
| 1,031,760 | |
| 1,070,160 |
Melissa Render, President | |
| 360,000 | (1) |
| 392,015 | |
| — | |
| 752,015 |
Hashim Ahmed, Chief Financial Officer | |
| 106,795 | |
| 86,273 | |
| — | |
| 193,068 |
Robert Assabgui, Chief Operating Officer | |
| 94,792 | |
| 2,704 | |
| — | |
| 97,496 |
Greg Matheson, Former Chief Operating Officer | |
| 471,200 | (2) |
| — | |
| — | |
| 471,200 |
Ron Hampton, Former Chief Development Officer | |
| 562,529 | (1)(3) |
| — | |
| — | |
| 562,529 |
Michael Kanevsky, Former Chief Financial Officer | |
| 262,440 | (4) |
| — | |
| — | |
| 262,440 |
Vijay Mehta, Former Director | |
| 51,000 | |
| 357,057 | |
| — | |
| 408,057 |
Chad Williams, Director | |
| 75,000 | |
| 308,404 | |
| — | |
| 383,404 |
William Hayden, Director | |
| 84,000 | |
| 457,216 | |
| — | |
| 541,216 |
Tamara Brown, Director | |
| 30,900 | |
| 178,999 | |
| — | |
| 209,899 |
Dr. Andrew Furey, Director | |
| 36,000 | |
| 169,162 | |
| — | |
| 205,162 |
Paul Huet, Director | |
| 168,186 | |
| 3,470,771 | |
| — | |
| 3,638,957 |
Allen Palmiere, Director | |
| 15,000 | |
| 74,577 | |
| — | |
| 89,577 |
| | $ | 2,782,048 | | $ | 6,260,679 | | $ | 1,031,760 | | $ | 10,074,487 |
(1) | Salary recorded in exploration and evaluation expenses in the consolidated statement of loss and comprehensive loss. |
(2) | Includes termination benefits of $424,080 in accordance with the terms of their management agreement. |
(3) | Includes termination benefits of $505,440 in accordance with the terms of their management agreement. |
(4) | Includes termination benefits of $174,960 in accordance with the terms of their management agreement. |
38
| |
Management’s Discussion and Analysis | |
For the year ended December 31, 2025 | |
(Expressed in Canadian Dollars, except share and per share amounts, unless otherwise indicated) | |
Year ended December 31, 2024
| | Salaries and | | Share-based | | | | | | | ||
| | Consulting | | Compensation | | Bonus | | Total | ||||
Colin Kettel, Executive Chairman and Chief Executive Officer | | $ | 388,800 | | $ | — | | $ | 129,600 | | $ | 518,400 |
Melissa Render, President | |
| 15,000 | (1) |
| — | |
| — | |
| 15,000 |
Denis Laviolette, Former President | |
| 261,917 | |
| — | |
| 90,720 | |
| 352,637 |
Michael Kanevsky, Chief Financial Officer | |
| 116,640 | |
| — | |
| 38,880 | |
| 155,520 |
Greg Matheson, Chief Operating Officer | |
| 270,220 | |
| — | |
| 84,240 | |
| 354,460 |
Ronald Hampton, Chief Development Officer | |
| 336,960 | (1) |
| 96,083 | |
| 112,320 | (1) |
| 545,363 |
Non-Executive Directors | |
| 83,440 | |
| — | |
| — | |
| 83,440 |
Former Non-Executive Directors | |
| 138,580 | |
| — | |
| — | |
| 138,580 |
| | $ | 1,611,557 | | $ | 96,083 | | $ | 455,760 | | $ | 2,163,400 |
| (1) | Salary and bonus recorded in exploration and evaluation expenses in the consolidated statement of loss and comprehensive loss. |
During the year ended December 31, 2025, $922,529 (2024 - $449,280) of management compensation was recorded in exploration and evaluation expenses in the statements of loss and comprehensive loss.
At December 31, 2025, there was $3,989 (2024 - $56,040) payable to management and directors for accrued salaries and expense reimbursements of travel expenditures included in accounts payable and accrued liabilities. The amounts are unsecured, non-interest bearing and without fixed terms of repayment.
The Company’s business, financial position, results of operations, and future prospects are subject to a number of risks and uncertainties. The following discussion supplements the risks described in the Company’s latest Annual Information Form for the year ended December 31, 2025, which is available on the Company’s profile on SEDAR+ at www.sedarplus.ca and on EDGAR at www.sec.gov. The risks described below are not exhaustive; additional risks not currently known to the Company, or that the Company currently deems immaterial, may also impair its operations.
Financial Instrument Risk Exposure
The Company is exposed in varying degrees to a variety of financial instrument related risks. The Board approves and oversees the Company’s risk management process which seeks to minimize the potential adverse effects of financial risks on the Company’s financial results. The Company’s exposures to financial risks and the Company’s objectives, policies and processes for managing those risks are described in Note 25 to the Company’s consolidated financial statements for the year ended December 31, 2025. There were no significant changes to the Company’s exposures to financial risks or to the Company’s management of its exposures during the three months and year ended December 31, 2025 except as noted below. At December 31, 2025, the financial risks to which the Company is exposed and the Company’s objectives, policies and processes for managing those risks are as follows:
39
| |
Management’s Discussion and Analysis | |
For the year ended December 31, 2025 | |
(Expressed in Canadian Dollars, except share and per share amounts, unless otherwise indicated) | |
Liquidity risk
Liquidity risk is the risk that the Company will not be able to meet its financial obligations as they fall due. The Company has in place a planning and budgeting process to help determine the funds required to ensure the Company has the appropriate liquidity to meet its operating and growth objectives. The Company has historically relied on the issuance of shares to fund exploration programs and may require doing so again in the future. As at December 31, 2025, the Company has total liabilities of $117,032,395 and cash and cash equivalents of $58,838,699 which is available to discharge these liabilities (December 31, 2024 – total liabilities of $7,448,306 and cash of $22,317,548).
Market risks
Market risk is the risk that changes in market prices, such as commodity prices, interest rates and foreign exchange rates will affect the Company’s net earnings or the value of financial instruments. The objective of the Company is to manage and mitigate market risk exposures within acceptable limits, while maximizing returns.
(i)Currency risk
Financial instruments that impact the Company’s net earnings or other comprehensive income due to currency fluctuation include cash accounts and accounts payable denominated in US dollars. The sensitivity of the Company’s net loss to changes in the exchange rate between the US dollar and the Canadian dollar at December 31, 2025 would change the Company’s net loss by $144,145 (December 31, 2024 - $322,434) as a result of a 10% change in the exchange rate.
(ii) | Interest rate risk |
Interest rate risk is the risk that the fair value of future cash flows of a financial instrument will fluctuate due to changes in market interest rates. As the Company deposits its cash and cash equivalents into demand accounts with minimal interest rates, interest rate risk is not significant.
(iii) | Commodity price risk |
Commodity price risk is the potential adverse impact on earnings and economic value due to commodity price movements and volatilities. The Company is primarily exposed to gold prices, which significantly affect the value of its mineral properties and investments. As at December 31, 2025, the Company had no financial instruments subject to provisional pricing or other commodity-linked arrangements. Accordingly, a reasonably possible change in gold prices at the reporting date would not have a material impact on the Company’s net loss or comprehensive loss.
(iv) | Equity price risk |
Equity price risk is the risk that the fair value of future cash flows from the Company’s financial instruments will significantly fluctuate because of changes in market prices. The Company is exposed to market risk in trading its investments in unfavorable market conditions which could result in dispositions of investments at less than favorable prices. Additionally, the Company adjusts its investments to fair value at the end of each reporting period. This process could result in write-downs of the Company’s investments over one or more reporting periods, particularly during periods of overall market instability.
The sensitivity of the Company’s net loss to changes in market prices at December 31, 2025 would change the Company’s net loss by $889,556 (December 31, 2024 - $92,602) as a result of a 10% change in the market price of its investments.
40
| |
Management’s Discussion and Analysis | |
For the year ended December 31, 2025 | |
(Expressed in Canadian Dollars, except share and per share amounts, unless otherwise indicated) | |
There have been no changes in management’s methods for managing market risks since December 31, 2024.
Other Risk Factors
Commodity and Currency Risks
The volatility of the price of gold could have a negative impact on the Company’s future operations and financial condition.
The Company’s revenue, earnings, and cash flow are directly affected by fluctuations in the price of gold, over which the Company has no control. A sustained reduction in the price of gold may render the Hammerdown Mine and Pine Cove Mill operations uneconomic, reduce the Company’s ability to generate cash flow to finance operations, exploration, and development activities, impair the carrying value of mineral properties, or result in the write-down of assets. The price of gold is affected by numerous factors beyond the Company’s control, including the level of inflation, fluctuations in the United States dollar and other currencies, global investment and physical demand, central bank activity, and the political and economic conditions of major gold-producing countries. The Company does not currently engage in commodity hedging transactions.
In addition, declining metal prices can impact operations by requiring a reassessment of the feasibility of mining at the Hammerdown Mine or planned development of the Queensway Project. Even if such projects are ultimately determined to be economically viable, the need to conduct a reassessment may cause substantial delays or interrupt operations, which could have a material adverse effect on the Company’s results of operations and financial condition.
Production, Mining, and Operating Risks
The Company is dependent on a single mine for all of its current production.
The Hammerdown Mine and Pine Cove Mill, acquired through the Maritime acquisition on November 13, 2025, account for all of the Company’s current production. Any adverse condition affecting mining or processing operations at Hammerdown and Pine Cove Mill, including equipment failures, ground conditions, labour disruptions, supply chain interruptions, adverse weather, permitting delays, or regulatory actions, could have a material adverse effect on the Company’s financial performance and results of operations. The Company does not currently have alternative sources of production to offset any disruption at Hammerdown and Pine Cove Mill.
Forecasts of future production are estimates and actual production may be less than estimated.
The Company’s production estimates for the Hammerdown Mine are based on interpretations and assumptions regarding grades, mining rates, recovery rates, equipment performance, and other factors. Actual production may vary from estimates due to variations in grade, tonnage, dilution, and metallurgical characteristics of the mineralized material actually mined; short-term operating factors; mine failures or equipment breakdowns; weather conditions; labour shortages; and other unforeseen events. It is not unusual in mining operations, particularly those in a ramp-up phase such as Hammerdown, to experience unexpected problems that may cause delays or require modifications to mine plans. The Company reported a gross deficit for the period from November 13 to December 31, 2025, reflecting the operational ramp-up phase at Hammerdown following the acquisition.
The Company’s production costs are affected by the prices of commodities and inputs consumed in operations.
Mining and processing operations at Hammerdown and Pine Cove Mill require significant quantities of electricity, fuel, chemicals, explosives, and other consumables. The prices of these inputs are influenced by supply and demand conditions, inflation, transportation costs, and other factors beyond the Company’s control. Increases in the cost of these inputs could materially affect the Company’s operating costs and financial results.
41
| |
Management’s Discussion and Analysis | |
For the year ended December 31, 2025 | |
(Expressed in Canadian Dollars, except share and per share amounts, unless otherwise indicated) | |
Exploration, Development, and Acquisition Risk
The Queensway Project is at the exploration stage, and there is no certainty that a commercially viable mineral deposit will be delineated.
The Company’s principal exploration asset, Queensway, is at an early stage. Substantial additional expenditure will be required to determine whether a commercially viable mineral deposit exists, to complete feasibility studies, to obtain necessary permits, and, if warranted, to construct mining and processing infrastructure. Few properties that are explored are ultimately developed into producing mines. There is no certainty that the Company’s exploration expenditures on Queensway will result in the discovery of commercially viable quantities of mineralized material or that any mineral deposit identified will ever be placed into production.
The Company may not successfully integrate Maritime or realize anticipated benefits.
The acquisition of Maritime was completed on November 13, 2025 and represents a transformative transaction for the Company. The integration of Maritime’s operations, personnel, systems, and processes involves risks, including the difficulty of assimilating operations and personnel, the potential disruption of ongoing business, the inability to maintain uniform standards, controls, procedures, and policies across the combined organization, and the potential for unknown or unanticipated liabilities. There can be no assurance that the integration will be completed successfully or that the anticipated benefits of the acquisition will be fully realized.
Development projects are uncertain, and actual capital and operating costs may differ significantly from estimates.
The Company has development-stage projects, including Hammerdown and Queensway, that require significant expenditures before commercial production can commence. Development projects are subject to the completion of successful feasibility studies, environmental assessments, issuance of governmental licences and permits, and availability of adequate financing. The economic feasibility of development projects is based on many factors, including estimation of mineral resources and reserves, anticipated metallurgical recoveries, environmental considerations, future gold prices, and anticipated capital and operating costs. These estimates may prove to be inaccurate, and actual results may differ significantly from those currently estimated.
Mineral Resource Estimation Risks
The figures for the Company’s Mineral Resources are estimates and may yield less mineral production under actual conditions than is currently estimated.
The Company’s MRE for both Queensway and Hammerdown are estimates only and no assurance can be given that any particular level of recovery of gold will be realized. These estimates are based on the interpretation of geological data obtained from drill holes and other sampling techniques, and on assumptions regarding grades, mining dilution, recovery rates, and future operating costs. Actual conditions encountered during mining may differ materially from those assumed in the estimates. Changes in metal prices, operating costs, or other factors may render certain mineral resources uneconomic. The Company must continually replace mineral resources depleted by production to maintain production levels over the long term, and there is no assurance that depletion of resources will be offset by future discoveries or acquisitions.
42
| |
Management’s Discussion and Analysis | |
For the year ended December 31, 2025 | |
(Expressed in Canadian Dollars, except share and per share amounts, unless otherwise indicated) | |
Permitting, Regulatory and Title Risks
The Company requires permits and licenses for its exploration, development, and mining operations, and there is no assurance that all necessary permits will be obtained or maintained.
The Company’s operations in Newfoundland and Labrador are subject to extensive federal and provincial laws and regulations governing worker health and safety, environmental protection, mine development, water management, and reclamation. The Company requires numerous approvals, licenses, and permits, and is uncertain whether all necessary permits will be maintained or obtained on acceptable terms or in a timely manner. Changes in applicable laws or regulations, or changes in their enforcement or regulatory interpretation, could negatively impact current or planned exploration, development, and mining activities. Any failure to comply with applicable laws and regulations, even if inadvertent, could result in the interruption of operations, material fines, penalties, or other liabilities.
The Company cannot guarantee that title to its properties will not be challenged.
Although the Company believes it has taken reasonable measures to ensure title to its mineral properties, some risk exists that titles, surface access rights, or mineral claims may be defective or subject to prior unregistered agreements, interests, or claims. Title disputes could result in costly litigation or disruption of operations.
Environmental and Reclamation Risks
The Company’s activities are subject to environmental laws and regulations that may increase costs and restrict operations.
The Company’s exploration, development, and production activities are subject to regulation under various environmental laws in Newfoundland and Labrador and federally. Environmental legislation is evolving, and the trend has been toward stricter standards and enforcement. Compliance with environmental laws and regulations may require significant capital outlays and could cause material changes or delays in the Company’s planned activities. Environmental hazards may exist on properties held by the Company, including those acquired through the Maritime acquisition, that are currently unknown.
Actual costs of reclamation are uncertain and may exceed estimates.
The Company has assumed reclamation obligations related to the Point Rousse Project, the Hammerdown Mine and Nugget Pond Mill through the Maritime acquisition and maintains reclamation provisions for the Queensway Project. These obligations are based on estimated future costs, which are subject to significant uncertainty. If actual reclamation costs are higher than estimated, or if unforeseen environmental issues arise, the Company’s financial position could be adversely affected. The Company maintains surety bonding arrangements with the Government of Newfoundland and Labrador secured by cash collateral, and any increase in bonding requirements could reduce available liquidity.
43
| |
Management’s Discussion and Analysis | |
For the year ended December 31, 2025 | |
(Expressed in Canadian Dollars, except share and per share amounts, unless otherwise indicated) | |
Financing and Capital Requirements
The Company may require additional financing to fund its exploration and development programs, and there is no assurance that such financing will be available.
The Company has historically relied on equity financings, including flow-through share offerings, private placements, and at-the-market programs, to fund its exploration and corporate activities. The ability of the Company to continue exploration and development of Queensway, to sustain mining operations at Hammerdown, and to meet its financial obligations will depend on its ability to generate sufficient cash flow from operations and potentially to raise additional financing. There is no assurance that such financing will be available on acceptable terms, or at all. Any transaction involving the issuance of equity securities could result in dilution to existing shareholders.
Key Personnel and Labour Risks
The Company’s success is dependent on key personnel and on its ability to attract and retain qualified employees.
The Company depends on the services of its key management personnel. The loss of any key executive could have a material adverse effect on the Company’s business and operations. The Company’s management team was substantially reconstituted during the year ended December 31, 2025, including the appointment of a new CEO, COO, CFO and other senior personnel, and the departure of certain prior executives. There can be no assurance that the Company will be able to retain its current management or attract additional qualified personnel as needed. Mining operations at Hammerdown also depend on the availability of skilled labour and contractors in the central Newfoundland area, and labour shortages or increased labour costs could affect operational performance.
Internal Controls — Limitation on Scope of Design
The Company acquired Maritime November 13, 2025. The financial information for this acquisition is included in Note 5 to the consolidated financial statements. In accordance with the Canadian Securities Administrators’ National Instrument 52-109, the Company’s management excluded Maritime from management’s assessment of the design and operational effectiveness of internal controls over financial reporting for the year ended December 31, 2025. The Company is in the process of extending its internal control framework to Maritime’s operations and expects to complete this process during the year ended December 31, 2026.
Insurance Risks
The Company may not have sufficient insurance coverage.
The mining industry is subject to significant risks that could result in damage to, or destruction of, mineral properties or producing facilities, personal injury or death, environmental damage, delays in mining, and possible legal liability. The Company maintains insurance coverage consistent with industry practice, however, its insurance may not provide sufficient coverage for all risks. The occurrence of losses or damage not covered by insurance, or in excess of insurance coverage limits, could have a material adverse effect on the Company’s financial position and results of operations.
44
| |
Management’s Discussion and Analysis | |
For the year ended December 31, 2025 | |
(Expressed in Canadian Dollars, except share and per share amounts, unless otherwise indicated) | |
Climate Change and Weather Risks
The Company’s mining and exploration operations in Newfoundland and Labrador are exposed to physical climate risks, including severe weather events, flooding, ice storms, and changes in precipitation patterns that could disrupt access to mine sites, delay exploration programs, or damage infrastructure. The Company’s operations also contribute to greenhouse gas emissions and may be subject to present or future regulations, including carbon pricing, that could increase operating costs. The trend toward stricter climate-related regulations and disclosure requirements may require additional capital outlays and changes to operating practices.
Cybersecurity Risks
The Company’s critical operating and information systems may be compromised.
The Company relies on information technology systems for financial reporting, operational management, and communications. Cyber threats have increased in frequency and sophistication across all industries. While the Company takes measures to protect its systems and data, there can be no assurance that critical systems will not be breached. A cybersecurity incident could result in business interruption, loss of critical data, financial loss, or reputational damage.
Community and Stakeholder Relations
The Company’s relationship with local communities is critical to the success of its operations and development projects.
The Company’s mining operations at Hammerdown and Pine Cove Mill and exploration activities on Queensway are located in Newfoundland and require ongoing engagement with local communities and Indigenous peoples. There is increasing public concern relating to the perceived effects of mining activities on the environment and local communities. The Company’s ability to obtain and maintain permits, conduct exploration, develop projects, and sustain mining operations depends in part on maintaining positive relationships with local communities and stakeholders. Any inability to maintain these relationships could result in permitting delays, increased legal challenges, or disruptions to operations.
Share Price Volatility
The trading price of the Company’s common shares may be subject to significant fluctuations.
The market price of the Company’s common shares is affected by numerous factors, including the price of gold, the Company’s operating and exploration results, the public’s reaction to the Company’s press releases and filings, changes in analyst estimates or recommendations, general economic and market conditions, and the arrival or departure of key personnel. The Company’s shares are listed on the TSX Venture Exchange and the NYSE American. Securities markets have experienced significant price and volume volatility, and the market price of the Company’s securities may fluctuate significantly regardless of the Company’s operating performance.
45
| |
Management’s Discussion and Analysis | |
For the year ended December 31, 2025 | |
(Expressed in Canadian Dollars, except share and per share amounts, unless otherwise indicated) | |
Competition
The Company competes with larger, better-capitalized mining companies for properties, financing, and personnel.
The mining industry is intensely competitive in all of its phases. The Company competes with a substantial number of established mining companies with greater financial resources, more advanced properties, lower cost structures, and greater ability to withstand losses. The Company’s competitors may be able to respond more quickly to new laws, regulations, or emerging technologies, or devote greater resources to the expansion of their operations. Competition could adversely affect the Company’s ability to acquire suitable new mineral properties, raise financing to fund exploration and development, attract and retain qualified personnel, or secure equipment and contractors necessary for mining and exploration operations. The Company may not be able to compete successfully against current and future competitors, and any failure to do so could have a material adverse effect on the Company’s business, financial position, or results of operations.
Limited Production History
The Company has a very limited history of mining operations and there is no assurance it will achieve sustained profitability.
While the Company commenced gold production through the Hammerdown Mine and Pine Cove Mill following the Maritime acquisition on November 13, 2025, it has a very limited history of mining operations and revenue generation. The Company reported a gross deficit for the period from the acquisition date through December 31, 2025, reflecting the operational ramp-up phase at Hammerdown. Queensway, the Company’s flagship asset, is at the exploration to pre-development stage and does not generate revenue. As such, the Company will be subject to many of the business risks and uncertainties associated with early-stage producers, including the ability to optimize mill throughput and recovery rates, manage operating costs effectively, develop reliable supply chains, attract and retain skilled mine operations personnel, and establish the operational controls and procedures necessary for sustained production. There is no assurance that the Company will achieve or sustain profitability from its mining operations.
Proposed Loan Facility Default Risk
The Company may not meet its commitments resulting in a default under the Loan Facility.
The Company has entered into a non-binding term sheet for an up to US$75,000,000 Loan Facility. If the Company enters into this proposed Loan Facility, its assets will be pledged as security, which may limit the Company’s financial flexibility and subject the Company to a risk of default. Under the terms of the proposed Loan Facility, the Company and its subsidiaries would be required to grant a first-lien security interest over all of their present and after-acquired real and personal property. The existence of such security interest may significantly restrict the Company’s ability to obtain additional secured or unsecured financing in the future, as there may be limited, or no, unencumbered collateral available to offer to other lenders.
The proposed Loan Facility requires the Company to meet certain financial covenants. Failure to comply with these covenants could result in an event of default. If an event of default under the proposed Loan Facility occurs, Nebari could elect to declare all principal amounts outstanding thereunder at such time, together with accrued interest, to be immediately due. Furthermore, if the Company were unable to repay any amounts due and payable under the proposed Loan Facility, Nebari could proceed against the security securing such indebtedness. The Company may not have sufficient assets to repay that indebtedness and could be forced into bankruptcy, receivership or liquidation. An event of default under the proposed Loan Facility would have a material adverse effect on the Company’s operations and financial condition. In the event of a bankruptcy, receivership or liquidation, secured lenders will generally be entitled to payment of their claims from the assets of the Company before any assets are made available for distribution to the shareholders.
46
| |
Management’s Discussion and Analysis | |
For the year ended December 31, 2025 | |
(Expressed in Canadian Dollars, except share and per share amounts, unless otherwise indicated) | |
Negative Cash Flow from Operating Activities
The Company has historically reported negative operating cash flows and may continue to do so during the ramp-up of mining operations.
The Company has historically had negative cash flow from operating activities. Although the Company commenced generating revenue from gold production in the fourth quarter of 2025, Hammerdown is in an early ramp-up phase and the Company continued to report a net loss for the year ended December 31, 2025. The Company’s significant projected development and exploration expenditures at Hammerdown and Queensway and other properties, combined with general and administrative costs associated with maintaining a dual-listed public company, may continue to result in negative operating cash flows for the foreseeable future. Accordingly, the Company may continue to be required to obtain additional financing in order to meet its future cash commitments and fund its exploration and development programs.
Going Concern Risk
The Company’s ability to continue as a going concern depends on its ability to generate sufficient cash flow from operations and, if necessary, raise additional financing.
The Company’s financial statements have been prepared assuming the Company will continue on a going-concern basis and do not include adjustments to amounts and classifications of assets and liabilities that might be necessary should the Company be unable to continue operations. The ability of the Company to continue as a going concern depends upon its ability to generate sufficient cash flow from mining operations, develop profitable operations, and, if necessary, continue to raise adequate financing. Management is actively targeting sources of additional financing, including through the issuance of equity securities and debt financing, which would assure continuation of the Company’s operations, mining activities, and development and exploration programs. Although the Company has been successful in the past in generating financing, there is no assurance it will be able to do so in the future.
Dilution
Future equity issuances to fund exploration, development and mining operations will result in further dilution to existing shareholders.
The Company has historically financed its operations primarily through the issuance of equity securities, including common share offerings, flow-through share financings, and private placements. The Company issued 141,871,671 common shares during the year ended December 31, 2025, increasing its shares outstanding from 200,457,994 to 342,329,665. Future equity financings to fund exploration, development, and mining operations, or the exercise of outstanding stock options and warrants, will result in further dilution to existing shareholders. In addition, any future acquisitions may be funded in whole or in part through the issuance of additional equity securities. There is no assurance that the Company will not need to issue additional equity securities in the future, and any such issuance may have a dilutive effect on existing shareholders.
47
| |
Management’s Discussion and Analysis | |
For the year ended December 31, 2025 | |
(Expressed in Canadian Dollars, except share and per share amounts, unless otherwise indicated) | |
Global Economy and Geopolitical Risk
Volatility in global capital markets and geopolitical instability could adversely affect the Company’s ability to raise financing and increase its operating costs.
The volatility of global capital markets has generally made the raising of capital by equity or debt financing more difficult. The Company may be dependent upon capital markets to raise additional financing in the future and is therefore subject to liquidity risks in instances where adequate cash positions are unable to be maintained or appropriate financing is unavailable. In addition, as the Company’s operations expand, the impact of significant geopolitical risk and conflict globally may have a sizeable and unpredictable impact on the Company’s business, financial position, and operations. Ongoing conflicts in various regions and the global response to these conflicts as it relates to sanctions, trade embargoes, and military support have resulted in significant uncertainty as well as economic and supply chain disruptions. Should geopolitical disputes and conflicts continue or emerge in other regions, this could result in material adverse effects to the Company through increased financial market volatility, supply chain disruptions, and inflationary pressures on operating costs.
Uncertainty of Trade Policies
The imposition of trade tariffs or other restrictions, particularly by the United States, could increase the Company’s operating costs and disrupt its supply chain.
The imposition of trade tariffs, particularly by the United States, or other trade restrictions could have significant repercussions for Canadian businesses and the broader economy. While gold is generally exempt from direct tariff measures, increased costs of goods, services, equipment, and consumables necessary for mining and exploration operations may contribute to cost inflation. The Company sources some of its key operating inputs from the U.S.; any retaliatory tariffs or disruptions to cross-border trade could indirectly affect the Company’s cost structure and access to specialized materials, equipment and services. These tariffs, and any changes to these tariffs or imposition of any new tariffs, taxes, or import or export restrictions or prohibitions, could have a material adverse effect on the Company’s business. Furthermore, there is a risk that tariffs imposed by the U.S. on other countries will trigger a broader global trade war which could have a material adverse effect on the Canadian, U.S., and global economies, creating financial uncertainty, disrupting trade relationships, and putting downward pressure on economic growth.
First Nations and Indigenous Land Claims
Certain of the Company’s mineral properties may be the subject of Indigenous land claims that could adversely affect its ability to explore, develop, or operate those properties.
Certain of the Company’s mineral properties may now or in the future be the subject of Indigenous or First Nations land claims. The legal nature of Indigenous land claims is a matter of considerable complexity. The impact of any such claim on the Company’s material interest in its mineral properties cannot be predicted with any degree of certainty, and no assurance can be given that a broad recognition of Indigenous rights in the areas in which the Company’s mineral properties are located, by way of negotiated settlements or judicial pronouncements, would not have an adverse effect on the Company’s activities. Even in the absence of such recognition, the Company may at some point be required to negotiate with and seek the approval of holders of Indigenous interests in order to facilitate exploration, development, and mining activities on the Company’s mineral properties. There is no assurance that the Company will be able to establish and maintain practical working relationships with Indigenous communities in the area which would allow it to ultimately develop and operate the Company’s mineral properties.
48
| |
Management’s Discussion and Analysis | |
For the year ended December 31, 2025 | |
(Expressed in Canadian Dollars, except share and per share amounts, unless otherwise indicated) | |
Claims and Legal Proceedings
The Company may from time to time be subject to legal proceedings, the outcomes of which are inherently uncertain and could have a material adverse effect on its business.
The Company and/or its directors and officers may be subject to a variety of civil or other legal proceedings, with or without merit. From time to time in the ordinary course of its business, the Company may become involved in various legal proceedings, including commercial, employment, and other litigation and claims, as well as governmental and other regulatory investigations and proceedings. Such matters can be time-consuming, divert management’s attention and resources, and cause the Company to incur significant expenses. Furthermore, because litigation is inherently unpredictable, the results of any such actions may have a material adverse effect on the Company’s business, operating results, or financial position.
Conflicts of Interest
Certain directors and officers of the Company also serve as directors or officers of other companies and may face conflicts of interest that are not resolved in favour of the Company.
All of the directors and some of the officers of the Company are also directors, officers, and shareholders of other natural resource or public companies, and as a result they may find themselves in a position where their duty to another company conflicts with their duty to the Company. Although the Company has policies which address such potential conflicts and the British Columbia Business Corporations Act has provisions governing directors in the event of such a conflict, none of the Company’s constating documents or any of its other agreements contain any provisions mandating a procedure for addressing such conflicts of interest. There is no assurance that any such conflicts will be resolved in favour of the Company.
Infrastructure
The Company’s mining and exploration operations depend on adequate infrastructure, the unavailability of which could prevent or delay operations.
Mining, exploration, development, and processing activities depend on adequate infrastructure. Reliable roads, bridges, power sources, water supply, and surface facilities are critical to the Company’s operations at Hammerdown and the Pine Cove Mill and to its exploration activities on Queensway and other properties. The lack of availability on acceptable terms, or the delay in the availability, of any one or more of these items could prevent or delay exploration, development, or mining operations. In particular, Hammerdown and the Pine Cove Mill are located in central Newfoundland where infrastructure is limited relative to more established mining regions. Unusual or infrequent weather phenomena, sabotage, government, or other interference in the maintenance or provision of necessary infrastructure could adversely affect the Company’s operations and could have a material adverse effect on the Company’s business, financial position, results of operations and cash flows.
49
| |
Management’s Discussion and Analysis | |
For the year ended December 31, 2025 | |
(Expressed in Canadian Dollars, except share and per share amounts, unless otherwise indicated) | |
Force Majeure
The Company’s operations may be adversely affected by events outside its control, including natural disasters, labour disruptions, and pandemics.
The Company’s projects now or in the future may be adversely affected by risks outside the control of the Company, including the price of gold on world markets, labour unrest, civil disorder, war, subversive activities or sabotage, fires, floods, explosions or other catastrophes, pandemics, epidemics, or quarantine restrictions. The Company’s mining operations at the Hammerdown Mine and Pine Cove Mill and exploration activities on the Queensway Project are concentrated in Newfoundland and Labrador, and any force majeure event affecting the region could have a disproportionate impact on the Company’s operations given its geographic concentration.
Reliability of Historical Information
The Company has relied in part on historical data compiled by previous parties, and any inaccuracies in that data could adversely affect its exploration and production plans.
The Company has relied on, and certain of its technical disclosures are based, in part, upon historical data compiled by previous parties involved with its mineral properties, including Queensway and Hammerdown. To the extent that any of such historical data is inaccurate or incomplete, the Company’s exploration plans, production forecasts, and MREs may be adversely affected.
Laws and Regulations
The Company’s operations are subject to extensive and evolving laws and regulations, non-compliance with which could result in fines, penalties, or operational disruptions.
The Company’s exploration and mining activities are subject to extensive federal, provincial, and local laws and regulations governing prospecting, development, production, exports, taxes, labour standards, occupational health and safety, mine safety, and other matters in all the jurisdictions in which it operates. These laws and regulations are subject to change, can become more stringent, and compliance can therefore become more costly. The Company applies the expertise of its management, advisors, employees, and contractors to ensure compliance with current laws. Possible future government legislation, policies, and controls relating to prospecting, development, production, environmental protection, mining taxes, and labour standards could cause additional expense, capital expenditures, restrictions, and delays in the activities of the Company, the extent of which cannot be predicted. Before development and production can commence on any new properties, the Company must obtain regulatory and environmental approvals. There is no assurance that such approvals can be obtained on a timely basis or at all. The cost of compliance, with changes in governmental regulations, has the potential to reduce the profitability of operations.
Critical IFRS Accounting Policies and Accounting Estimates
The Company’s consolidated financial statements are prepared in accordance with IFRS as issued by the International Accounting Standards Board. New Found Gold’s material accounting policies including a summary of current and future changes in accounting policies are disclosed in Note 3 to the consolidated financial statements.
50
| |
Management’s Discussion and Analysis | |
For the year ended December 31, 2025 | |
(Expressed in Canadian Dollars, except share and per share amounts, unless otherwise indicated) | |
The preparation of the consolidated financial statements in accordance with IFRS requires management to make estimates and judgments that affect the reported amounts of assets, liabilities, revenues and expenses. Critical accounting estimates have a reasonable likelihood that materially different amounts could be reported under different conditions or using different assumptions. In making judgments about the carrying value of assets and liabilities, the Company uses estimates based on historical experience and assumptions that are considered reasonable in the circumstances. Although the Company evaluates its accounting estimates on an ongoing basis using the most current information available, actual results may differ from these estimates. The critical judgments and key sources of estimation uncertainties in the application of accounting policies during the year ended December 31, 2025 are disclosed in Note 4 to the consolidated financial statements.
Management has discussed the development and selection of critical accounting policies and estimates with the Audit Committee which has reviewed the Company’s disclosures included or incorporated by reference in this MD&A.
This MD&A includes references to certain financial measures, including AISC and cash costs, which are non-IFRS financial measures. These measures do not have standardized meanings prescribed by IFRS and may not be comparable to similar measures presented by other issuers.
Management believes that these non-IFRS measures provide additional information to investors and analysts in evaluating the potential economic performance of mining projects, particularly when used in conjunction with IFRS financial measures and technical disclosures. These measures are intended to supplement, and not replace, financial information prepared in accordance with IFRS.
Nature and Use of Non-IFRS Measures
References to AISC and cash costs in this MD&A are derived from technical studies, including the PEA for Queensway and Hammerdown and are therefore forward-looking, non-historical estimates. The Company’s mining operations at the Hammerdown Mine and Pine Cove Mill have not reached commercial production. As such, AISC and cash costs are not measures of historical financial performance.
These measures are used by management primarily for project evaluation, comparison of alternative development scenarios, and assessment of economic sensitivity, rather than for evaluating current operating performance.
Cash Costs
Cash costs are intended to reflect the estimated cost per ounce of gold produced, including mining, processing, site administration, and refining costs, but excluding depreciation, depletion, amortization, reclamation, sustaining capital, corporate general and administrative expenses, and financing costs.
Cash costs are a non-IFRS measure and should not be considered in isolation or as a substitute for measures prepared in accordance with IFRS.
51
| |
Management’s Discussion and Analysis | |
For the year ended December 31, 2025 | |
(Expressed in Canadian Dollars, except share and per share amounts, unless otherwise indicated) | |
All-In Sustaining Costs
AISC is a non-GAAP financial measure calculated based on guidance published by the World Gold Council (“WGC”). The WGC is a market development organization for the gold industry and is an association whose membership comprises leading gold mining companies. Although the WGC is not a mining industry regulatory organization, it worked closely with its member companies to develop these metrics. Adoption of the all-in sustaining cost metric is voluntary and not necessarily standard, and therefore, this measure presented by the Company may not be comparable to similar measures presented by other issuers. The Company believes that the all-in sustaining cost measure complements existing measures and ratios reported by the Company.
All-in sustaining cost includes both operating and capital costs required to sustain gold production on an ongoing basis. Sustaining operating costs represent expenditures expected to be incurred at the Project that are considered necessary to maintain production. Sustaining capital represents expected capital expenditures comprising mine development costs, including capitalized waste, and ongoing replacement of mine equipment and other capital facilities, and does not include expected capital expenditures for major growth projects or enhancement capital for significant infrastructure improvements.
AISC is intended to provide a more comprehensive measure of the total cost of producing gold and typically includes cash costs, sustaining capital expenditures, sustaining exploration, reclamation and mine closure costs, and site-level general and administrative expenses.
AISC excludes growth capital, project development expenditures, and certain corporate-level costs. As a result, AISC may not reflect the full cost of advancing a project from exploration through development and should be interpreted in the context of the underlying technical assumptions.
EBITDA
EBITDA stands for Earnings Before Interest, tax, Depreciation, and Amortization. It is a non-GAAP financial metric used to measure a company’s overall operating performance and profitability by stripping away certain expenses and non-cash charges. By adding back interest, taxes, depreciation, and amortization to a company’s net income (loss), EBITDA provides a way to analyze its earnings before the impact of financing, accounting, and asset-related decisions.
Limitations and Cautionary Statements
The non-IFRS measures disclosed in this MD&A are based on estimates, assumptions, and methodologies used in technical studies prepared in accordance with NI 43-101. Actual costs, if and when commercial production occurs, may differ materially from the estimates presented due to changes in commodity prices, operating conditions, cost inflation, regulatory requirements, and other factors.
Investors are cautioned that AISC and cash costs presented in this MD&A are forward-looking information and are subject to the risks and uncertainties described in “Risks and Uncertainties.”
Reconciliation to IFRS Measures
As the Company is not currently in commercial production, there is no directly comparable IFRS financial measure to which AISC or cash costs can be reconciled. Accordingly, quantitative reconciliations are not provided.
52
| |
Management’s Discussion and Analysis | |
For the year ended December 31, 2025 | |
(Expressed in Canadian Dollars, except share and per share amounts, unless otherwise indicated) | |
Internal Controls Over Financial Reporting and Disclosure Controls and Procedures
Disclosure Controls and Procedures
The Company’s management, with the participation of its Chief Executive Officer (“CEO”) and Chief Financial Officer (“CFO”), has evaluated the effectiveness of the Company’s disclosure controls and procedures. Based upon the results of that evaluation, the Company’s CEO and CFO have concluded that, as of December 31, 2025, the Company’s disclosure controls and procedures were effective to provide reasonable assurance that the information required to be disclosed by the Company in reports it files is recorded, processed, summarized and reported, within the appropriate time periods and is accumulated and communicated to management, including the CEO and CFO, as appropriate to allow timely decisions regarding required disclosure.
Scope Limitation – Maritime
The Company completed its acquisition of Maritime Resources Corp. on November 13, 2025. In accordance with section 3.3(1)(b) of National Instrument 52-109 — Certification of Disclosure in Issuers’ Annual and Interim Filings (“NI 52-109”), management has limited the scope of its design of disclosure controls and procedures and internal control over financial reporting to exclude the controls, policies, and procedures of Maritime Resources Corp. This scope limitation is also consistent with the staff guidance of the U.S. Securities and Exchange Commission (“SEC”) set out in Question 3 of the Staff’s Frequently Asked Questions on Management’s Report on Internal Control Over Financial Reporting, which permits management to exclude an acquired business from its assessment of internal control over financial reporting when the assessment cannot be completed in the period between the acquisition date and the date of management’s assessment. The scope limitation is based on the time required to assess Maritime’s disclosure controls and procedures and internal control over financial reporting in a manner consistent with the Company’s existing framework.
The following summary financial information of Maritime Resources Corp. is included in the Company’s consolidated financial statements for the year ended December 31, 2025, representing the period from the November 13, 2025 acquisition date to December 31, 2025:
| ● | Revenue: $5,806,973 |
| ● | Net loss: $64,475 |
| ● | Total assets: $415,865,192 |
| ● | Total liabilities: $101,608,041 |
The Company is in the process of extending its disclosure controls and procedures and internal control over financial reporting framework to the operations acquired through the Maritime acquisition and expects to complete this process within the period permitted under NI 52-109 and the SEC Staff’s guidance on management’s report on internal control over financial reporting, being no later than November 13, 2026, or 365 days from the date of acquisition.
53
| |
Management’s Discussion and Analysis | |
For the year ended December 31, 2025 | |
(Expressed in Canadian Dollars, except share and per share amounts, unless otherwise indicated) | |
Internal Control over Financial Reporting
The Company’s management, with the participation of its CEO and CFO, is responsible for establishing and maintaining adequate internal control over financial reporting as such term is defined in the rules of the United States Securities and Exchange Commission and the Canadian Securities Administrators. The Company’s internal control over financial reporting is a process designed to provide reasonable assurance regarding the reliability of financial reporting and the preparation of financial statements for external purposes in accordance with IFRS as issued by the IASB. The Company’s internal control over financial reporting includes policies and procedures that:
| ● | maintain records that accurately and fairly reflect, in reasonable detail, the transactions and dispositions of assets of the Company; |
| ● | provide reasonable assurance that transactions are recorded as necessary for preparation of financial statements in accordance with IFRS as issued by IASB; |
| ● | provide reasonable assurance that the Company’s receipts and expenditures are made only in accordance with authorizations of management and the Company’s Directors; and |
| ● | provide reasonable assurance regarding prevention or timely detection of unauthorized acquisition, use, or disposition of the Company’s assets that could have a material effect on the Company’s financial statements. |
The Company’s internal control over financial reporting may not prevent or detect all misstatements because of inherent limitations. Additionally, projections of any evaluation of effectiveness for future periods are subject to the risk that controls may become inadequate because of changes in conditions or deterioration in the degree of compliance with the Company’s policies and procedures.
The Company’s management has determined that, other than the ongoing integration of controls over the operations acquired through the Maritime acquisition as described above under “Scope Limitation — Maritime Resources Corp.”, there have been no significant changes in the Company’s internal control over financial reporting during the year ended December 31, 2025, that have materially affected, or are reasonably likely to materially affect, the Company’s internal control over financial reporting.
The Company’s management evaluated the effectiveness of internal controls over financial reporting based upon the criteria set forth in Internal Control - Integrated Framework (2013) issued by the Committee of Sponsoring Organizations of the Treadway Commission. Based on management’s evaluation, and after excluding Maritime Resources Corp. from the scope of the assessment, the CEO and CFO concluded that the Company’s internal controls over financial reporting were effective as of December 31, 2025.
Limitations of Controls and Procedures
The Company’s management, including the CEO and CFO, believes that any disclosure controls and procedures or internal control over financial reporting, no matter how well conceived and operated, may not prevent or detect all misstatements because of inherent limitations. Further, the design of a control system must reflect the fact that there are resource constraints, and the benefits of controls must be considered relative to their costs. Because of the inherent limitations in all control systems, they cannot provide absolute assurance that all control issues and instances of fraud, if any, within the Company have been prevented or detected.
54
| |
Management’s Discussion and Analysis | |
For the year ended December 31, 2025 | |
(Expressed in Canadian Dollars, except share and per share amounts, unless otherwise indicated) | |
These inherent limitations include the realities that judgments in decision-making can be faulty, and that breakdowns can occur because of simple errors or mistakes. Additionally, controls can be circumvented by the individual acts of some persons, by collusion of two or more people, or by unauthorized override of the control. The design of any control system also is based in part upon certain assumptions about the likelihood of future events, and there can be no assurance that any design will succeed in achieving its stated goals under all potential future conditions. Accordingly, because of the inherent limitations in a cost-effective control system, misstatements due to error or fraud may occur and not be detected.
Cautionary Notes Regarding Forward-Looking Statements
This MD&A contains forward looking statements which reflect management’s expectations regarding the Company’s future growth, results from operations (including, without limitation, statements about the Company’s opportunities, strategies, competition, expected activities and expenditures as the Company pursues its business plan, the adequacy of the Company’s available cash resources and other statements about future events or results), performance (both operational and financial) and business prospects, future business plans and opportunities. Wherever possible, words such as “expects”, “plans”, “anticipates”, “believes”, “interpreted”, “intends”, “estimates”, “projects”, “aims”, “suggests”, “appears”, “indicate”, “often”, “target”, “future”, “likely”, “pending”, “potential”, “goal”, “objective”, “prospective”, “possibly”, “preliminary”, “initial”, and similar expressions or statements that certain actions, events or results “may”, “could”, “would”, “might” or “will” be taken, occur or be achieved, or the negative or grammatical variation thereof or other variations thereof, or comparable terminology have been used to identify forward-looking statements.
These forward-looking statements include, among other things, statements relating to the Queensway Gold Project; mineralization on Queensway; the interpretation of the results and benefits of the drilling program; statements related to the Hammerdown Gold Project and planned activities on the project; future drilling and the related timing and expected benefits thereof; updated MREs and related timing; the completion of a pre-feasibility or feasibility study and related timing and costs; assay results; the interpretation of assay results; the extent of mineralization and the discovery of zones of high-grade gold mineralization; plans for future exploration and drilling and the focus and timing of same; the merits of Queensway and Hammerdown gold projects; production at Queensway and Hammerdown gold projects and related timing; submission of environmental assessment and related timing; the Company’s areas of focus; estimates related to the mineral resources; the Company’s future business plans; advancing Queensway as a district-scale exploration and development asset with long-term growth potential; progressing Hammerdown and Pine Cove mill toward commercial production; maintaining financial discipline and access to capital; applying disciplined and consistent technical, and governance standards across assets; the market price of gold; expectations regarding any environmental issues that may affect planned or future exploration and development programs and the potential impact of complying with existing and proposed environmental laws and regulations; the ability to retain and/or maintain any required permits, licenses or other necessary approvals for the exploration or development of its mineral properties; government regulation of mineral exploration and development operations in the Province of Newfoundland and Labrador; the Company’s compensation policy and practices; the Company’s expected reliance on key management personnel, advisors and consultants and the potential impact of any tariffs, countervailing duties or other trade restrictions.
Forward-looking statements are not a guarantee of future performance and are based upon a number of estimates and assumptions of management in light of management’s experience and perception of trends, current conditions and expected developments, as well as other factors that management believes to be relevant and reasonable in the circumstances.
55
| |
Management’s Discussion and Analysis | |
For the year ended December 31, 2025 | |
(Expressed in Canadian Dollars, except share and per share amounts, unless otherwise indicated) | |
As of the date of this MD&A, these include, without limitation, assumptions about: the ability to raise any necessary additional capital on reasonable terms to advance exploration and development of the Company’s mineral properties; future prices of gold and other metal prices; the timing and results of exploration and drilling programs; the demand for, and price of gold; that general business and economic conditions will not change in a material adverse manner; the Company’s ability to procure equipment and operating supplies in sufficient quantities and on a timely basis; the geology of Queensway as described in the Queensway Technical Report; the geology of Hammerdown as described in the Hammerdown Technical Report; the accuracy of budgeted exploration and development costs and expenditures; future currency exchange rates and interest rates; operating conditions being favourable such that the Company is able to operate in a safe, efficient and effective manner; the Company’s ability to attract and retain skilled personnel; political and regulatory stability; the receipt of governmental, regulatory and third-party approvals, licenses and permits on favourable terms; obtaining required renewals for existing approvals, licenses and permits on favourable terms; requirements under applicable laws; sustained labour stability; stability in financial and capital goods markets and availability of equipment.
Furthermore, such forward-looking information involves a variety of known and unknown risks, uncertainties and other factors which may cause the actual plans, intentions, activities, results, performance or achievements of the Company to be materially different from any future plans, intentions, activities, results, performance or achievements expressed or implied by such forward-looking statements. Such risks include, without limitation: the Company may fail to find a commercially viable deposit at any of its mineral properties; there are no mineral reserves on any of the properties in which the Company has an interest; the Company’s plans may be adversely affected by the Company’s reliance on historical data compiled by previous parties involved with its mineral properties; mineral exploration and development are inherently risky; the mineral exploration industry is intensely competitive; additional financing may not be available to the Company when required or, if available, the terms of such financing may not be favourable to the Company; fluctuations in the demand for gold; the Company may not be able to identify, negotiate or finance any future acquisitions successfully, or to integrate such acquisitions with its current business; the Company’s exploration activities are dependent upon the grant of appropriate licenses, concessions, leases, permits and regulatory consents, which may be withdrawn or not granted; the Company’s operations could be adversely affected by possible future government legislation, policies and controls or by changes in applicable laws and regulations; there is no guarantee that title to the properties in which the Company has a material interest will not be challenged or impugned; the Company faces various risks associated with mining exploration that are not insurable or may be the subject of insurance which is not commercially feasible for the Company; the volatility of global capital markets over the past several years has generally made the raising of capital more difficult; compliance with environmental regulations can be costly; social and environmental activism can negatively impact exploration, development and mining activities; the success of the Company is largely dependent on the performance of its directors and officers; the Company’s operations may be adversely affected by First Nations land claims; the Company and/or its directors and officers may be subject to a variety of legal proceedings, the results of which may have a material adverse effect on the Company’s business; the Company may be adversely affected if potential conflicts of interests involving its directors and officers are not resolved in favour of the Company; the Company’s future profitability may depend upon the world market prices of gold; dilution from future equity financing could negatively impact holders of the Company’s securities; failure to adequately meet infrastructure requirements could have a material adverse effect on the Company’s business; the Company’s projects now or in the future may be adversely affected by risks outside the control of the Company; any new acquisitions may not be completed as anticipated; the Company is subject to various risks associated with climate change; other factors discussed in the Company’s Annual Information Form filed under the Company’s Annual Information Form filed under the Company’s profile at www.sedarplus.ca.
Although the Company has attempted to identify important factors that could cause actual actions, events, conditions, results, performance or achievements to differ materially from those described in forward-looking statements, there may be other factors that cause actions, events, conditions, results, performance or achievements to differ from those anticipated, estimated or intended.
56
| |
Management’s Discussion and Analysis | |
For the year ended December 31, 2025 | |
(Expressed in Canadian Dollars, except share and per share amounts, unless otherwise indicated) | |
The Company cautions that the foregoing lists of important assumptions and factors are not exhaustive. Other events or circumstances could cause actual results to differ materially from those estimated or projected and expressed in, or implied by, the forward-looking statements contained herein. There can be no assurance that forward-looking statements will prove to be accurate, as actual results and future events could differ materially from those anticipated in such information. Accordingly, readers should not place undue reliance on forward-looking statements.
Forward-looking statements contained herein are made as of the date of this MD&A and the Company disclaims any obligation to update or revise any forward-looking statements, whether as a result of new information, future events or results or otherwise, except as and to the extent required by applicable securities laws.
Cautionary Note for United States Investors
Disclosure regarding the Company’s mineral properties, including with respect to MREs included in this MD&A, was prepared in accordance with NI 43-101. NI 43-101 is a rule developed by the Canadian Securities Administrators that establishes standards for all public disclosure an issuer makes of scientific and technical information concerning mineral projects. NI 43-101 differs significantly from the disclosure requirements of the SEC generally applicable to U.S. companies. Accordingly, information contained in this MD&A is not comparable to similar information made public by U.S. companies reporting pursuant to SEC disclosure requirements.
Off-Balance Sheet Arrangements
The Company does not utilize off-balance sheet arrangements.
The Company does not have any proposed transactions.
Additional information relating to the Company, including the Company’s Annual Information Form, is available under the Company’s profile on SEDAR+ at www.sedarplus.ca, on EDGAR at www.sec.gov/edgar and the Company’s website at www.newfoundgold.ca.
57