Exhibit 99.1

NEW FOUND GOLD CORP.
ANNUAL INFORMATION FORM
For the year ended December 31, 2025
Dated: March 25, 2026
Exhibit 99.1
NEW FOUND GOLD CORP.
ANNUAL INFORMATION FORM
For the year ended December 31, 2025
Dated: March 25, 2026
TABLE OF CONTENTS
| | | Page |
3 | |||
| 3 | ||
| 3 | ||
| 3 | ||
5 | |||
| 5 | ||
| 5 | ||
| 5 | ||
| 6 | ||
| 7 | ||
13 | |||
| 14 | ||
| 25 | ||
28 | |||
| 28 | ||
| 29 | ||
| 36 | ||
| 39 | ||
| 40 | ||
| 41 | ||
| 45 | ||
| 49 | ||
| 50 | ||
| 52 | ||
| 53 | ||
| 54 | ||
| 55 | ||
| 60 | ||
63 | |||
| 63 | ||
| 64 | ||
| Accessibility, Climate, Local Resources, Infrastructure and Physiography | 76 | |
| 77 | ||
| 77 | ||
| 79 | ||
| 79 | ||
| 81 | ||
| 83 | ||
| 84 | ||
| 85 | ||
| 86 | ||
| 90 | ||
| 91 | ||
| 93 | ||
| 93 | ||
| Environmental Studies, Permitting and Social or Community Impact | 94 | |
| 94 | ||
i
| 97 | ||
| 101 | ||
| 102 | ||
| 104 | ||
| 104 | ||
| 105 | ||
107 | |||
| 107 | ||
108 | |||
| 108 | ||
108 | |||
| 108 | ||
| 109 | ||
110 | |||
111 | |||
| 111 | ||
| 114 | ||
| 114 | ||
| 114 | ||
| 116 | ||
| 117 | ||
| 117 | ||
| 118 | ||
| 118 | ||
| 119 | ||
119 | |||
119 | |||
120 | |||
120 | |||
120 | |||
121 | |||
SCHEDULE “A” CHARTER OF THE AUDIT COMMITTEE OF NEW FOUND GOLD CORP. | 1 | ||
ii
In this Annual Information Form (“AIF”), “New Found Gold” or the “Company” refers to New Found Gold Corp.
All information contained herein is as at December 31, 2025, unless otherwise stated.
New Found Gold’s financial statements for the fiscal year ended December 31, 2025, were prepared in accordance with International Financial Reporting Standards as issued by the International Accounting Standards Board.
This AIF should be read in conjunction with New Found Gold’s audited financial statements and notes thereto, as well as the management’s discussion and analysis for the years ended December 31, 2025 and 2024. The financial statements and management’s discussion and analysis are available under New Found Gold’s profile on SEDAR+ at www.sedarplus.ca and on the Electronic Data Gathering, Analysis, and Retrieval (EDGAR) website at www.sec.gov of the United States Securities and Exchange Commission (the “SEC”).
All sums of money which are referred to in this AIF are expressed in lawful money of Canada, unless otherwise specified. References to “US$” are to United States Dollars.
1.3Cautionary Statement Regarding Forward-Looking Information
This AIF contains “forward-looking information” and “forward-looking statements” (referred to together herein as “forward-looking information”). Forward-looking statements and information can generally be identified by the use of forward-looking terminology such as “may”, “will”, “expect”, “intend”, “estimate”, “anticipate”, “believe”, “continue”, “plans” or similar terminology. Forward-looking statements and information are not historical facts, are made as of the date of AIF, and include, but are not limited to, statements regarding discussions of results from operations (including, without limitation, statements about the Company’s opportunities, strategies, competition, expected activities and expenditures as the Company pursues its business plan, the adequacy of the Company’s available cash resources and other statements about future events or results), performance (both operational and financial) and business prospects, future business plans and opportunities and statements as to management’s expectations with respect to, among other things, the activities contemplated in this AIF.
Forward-looking statements included or incorporated by reference in this AIF include, without limitation, statements related to the Queensway Gold Project (as such term is defined herein) and the Company’s planned activities on the Queensway Gold Project; statements related to the Hammerdown Gold Project (as such term is defined herein) and the Company’s planned activities on the Hammerdown Gold Project; the Company’s goals regarding exploration and potential development of its projects; the Company’s future business plans; expectations regarding the ability to raise further capital; the non-binding term sheet for the Loan Facility (as such term is defined herein); the proposed terms of the Loan Facility, including the amounts to be funded and the timing thereof; the arrangement and administration fees; the interest rate; the term of the Loan Facility; the terms of the warrants to be issued in connection with the Loan Facility, including the aggregate value of each tranche, the calculation of the exercise price and the exercise period; the guarantees and security interests to be granted in connection with the Loan Facility; the expected use of proceeds for the Loan Facility; the market price of gold; expectations regarding any environmental issues that may affect planned or future exploration and development programs and the potential impact of complying with existing and proposed environmental laws and regulations; the ability to retain and/or maintain any required permits, licenses or other necessary approvals for the exploration or development of its mineral properties; government regulation of mineral exploration and development operations in the
3
Province of Newfoundland and Labrador; the Company’s compensation policy and practices; and the Company’s expected reliance on key management personnel, advisors and consultants.
These forward-looking statements involve numerous risks and uncertainties and other factors which may cause the actual results, performance or achievements of New Found Gold to be materially different from any future results, performance or achievements expressed or implied by such forward-looking information. Important factors that may cause actual results to vary include without limitation, the Company may fail to find a commercially viable deposit at any of its mineral properties; Mineral Reserves and Mineral Resources are estimates and there is no assurance that anticipated tonnages, grades or recovery levels will be achieved, or that Mineral Reserves can be mined and processed profitably; the Company’s plans may be adversely affected by the Company’s reliance on historical data compiled by previous parties involved with its mineral properties; mineral exploration and development are inherently risky; the Company’s operations are subject to all the hazards and risks normally encountered in the exploration and development of minerals; the mineral exploration industry is intensely competitive; additional financing may not be available to the Company when required or, if available, the terms of such financing may not be favourable to the Company; the Company may pledge its assets as security to secure financing, which may limit the Company’s financial flexibility and subject the Company to a risk of default; the Company has no history of mineral production; fluctuations in the demand for gold; the Company may not be able to identify, negotiate, finance or receive regulatory approval for any future acquisitions successfully, or to integrate such acquisitions with its current business; the Company’s exploration activities are dependent upon the grant of appropriate licenses, concessions, leases, permits and regulatory consents, which may be withdrawn or not granted; the Company’s operations could be adversely affected by possible future government legislation, policies and controls or by changes in applicable laws and regulations; there is no guarantee that title to the properties in which the Company has a material interest will not be challenged or impugned; the Company faces various risks associated with mining exploration that are not insurable or may be the subject of insurance which is not commercially feasible for the Company; the volatility of global capital markets over the past several years has generally made the raising of capital more difficult; the potential impact of any tariffs, countervailing duties or other trade restrictions; economic and other consequences from the conflicts in Ukraine, Iran and Gaza, and the global response to such conflicts; inflationary cost pressures may escalate the Company’s operating costs; compliance with environmental regulations can be costly; social and environmental activism can negatively impact exploration, development and mining activities; the success of the Company is largely dependent on the performance of its directors and officers; the Company’s operations may be adversely affected by First Nations land claims; the Company and/or its directors and officers may be subject to a variety of legal proceedings, the results of which may have a material adverse effect on the Company’s business; the Company may be adversely affected if potential conflicts of interests involving its directors and officers are not resolved in favour of the Company; the Company’s future profitability may depend upon the world market prices of gold; dilution from future equity financing could negatively impact holders of the Company’s securities; risks related to uninsured or partially insured losses; risks related to compliance with securities laws and listing requirements; failure to adequately meet infrastructure requirements could have a material adverse effect on the Company’s business; the Company’s projects now or in the future may be adversely affected by risks outside the control of the Company; the Company is subject to various risks associated with climate change; and other factors discussed under “Risk Factors”.
In making the forward-looking statements in this AIF, New Found Gold has applied several material assumptions, including without limitation, the assumptions that: the ability to raise any necessary additional capital on reasonable terms to advance exploration and development of the Company’s mineral properties; future prices of gold and other metal prices; the timing and results of exploration and drilling programs; the demand for, and price of gold; that general business and economic conditions will not change in a material adverse manner; the Company’s ability to procure equipment and operating supplies in sufficient quantities and on a timely basis; the geology of the Queensway Gold Project as described in the Queensway Technical Report (as such term is defined herein); the geology of the Hammerdown Gold Project as described in the Hammerdown Technical Report (as such term is defined herein); the accuracy of budgeted exploration and development costs and expenditures; future currency exchange rates and interest rates; operating conditions being favourable such that the Company is able to operate in a safe, efficient and effective manner; the Company’s ability to attract and retain skilled personnel; political and regulatory
4
stability; the receipt of governmental, regulatory, exchange and third-party approvals, licenses and permits on favourable terms; obtaining required renewals for existing approvals, licenses and permits on favourable terms; requirements under applicable laws; sustained labour stability; stability in financial and capital goods markets; and availability of equipment.
Certain of the risks and assumptions are described in more detail under the heading “Risk Factors” herein and in New Found Gold’s audited financial statements and management discussion and analysis for the years ended December 31, 2025 and 2024, available under New Found Gold’s profile on SEDAR+ at www.sedarplus.ca and on EDGAR at www.sec.gov.
The actual results or performance by New Found Gold could differ materially from those expressed in, or implied by, any forward-looking statements relating to those matters. Accordingly, no assurances can be given that any of the events anticipated by the forward-looking statements will transpire or occur, or if any of them do so, what impact they will have on the results of operations or financial condition of the Company. Except as required by law, New Found Gold is under no obligation, and expressly disclaim any obligation, to update, alter or otherwise revise any forward-looking statement, whether written or oral, that may be made from time to time, whether as a result of new information, future events or otherwise, except as may be required under applicable securities laws.
2.1Name, address and incorporation
New Found Gold was incorporated under the Business Corporations Act (Ontario) as Palisade Resources Corp. on January 6, 2016. By articles of amendment effective June 20, 2017, the Company’s name was changed to New Found Gold Corp.
On June 23, 2020, the Company continued into British Columbia under the provisions of the Business Corporations Act (British Columbia) (the “BCBCA”). The Company’s head and registered office is located at 1133 Melville Street, Suite 3500, The Stack, Vancouver, British Columbia, V6E 4E5, Canada.
Effective November 13, 2025, New Found Gold acquired all of the issued and outstanding shares of Maritime Resources Corp. (“Maritime”), a company incorporated under the laws of British Columbia, that it did not already own by way of a statutory plan of arrangement pursuant to Division 5 of Part 9 of the BCBCA, whereby Maritime became its fully owned subsidiary.
3GENERAL DEVELOPMENT OF THE BUSINESS
3.1.1General
New Found Gold is an emerging Canadian gold producer with assets in the Province of Newfoundland and Labrador. The Company’s exploration is focused on discovering and delineating gold resources. The Company has two material properties. The first is the Company’s flagship Queensway Gold Project located on the island of Newfoundland, Canada (the “Queensway Gold Project”, or the “Queensway Property”). On March 24, 2025, New Found Gold announced an initial mineral resource estimate (“MRE”) and on July 21, 2025, the Company issued a preliminary economic assessment (“PEA”) for the Queensway Gold Project. At present, the Queensway Gold Project does not have any known mineral reserves. The second is the Hammerdown Gold Project located on the island of Newfoundland, Canada (the “Hammerdown Gold Project”, consisting of the Hammerdown Property and the Pine Cove Property, ), which was acquired through the acquisition of Maritime. Queensway Gold Project and the Hammerdown Gold Project are collectively referred to herein as the “Properties”. On February 26, 2026, New Found Gold announced the results of an updated PEA and updated MRE for the Hammerdown Gold Project. At present, the Hammerdown Gold Project does not have any known mineral reserves. The Hammerdown deposit on the
5
Hammerdown Property had its first pour in November 2025 and is currently advancing to commercial production.
Since incorporation, the Company has taken the following steps in developing its business: (i) identified and acquired mineral properties with sufficient merit to warrant exploration; (ii) raised funds to progress the Company’s exploration activities on its mineral properties, as described herein; (iii) completed technical reports on the Queensway Gold Project, including the technical report titled “NI 43-101 Technical Report for the Queensway Gold Project, Newfoundland and Labrador, Canada”, filed on September 2, 2025 and with an effective date of June 30 2025, prepared by SLR Consulting (Canada) Ltd. (“SLR Consulting”), Stantec Consulting Limited (“Stantec”), Pierre Landry, P.Geo., Lance Engelbrecht, P.Eng., David M. Robson, P.Eng. and Sheldon H. Smith, P.Geo. in compliance with National Instrument 43-101– Standards of Disclosure of Mineral Projects (“NI 43-101”) (the “Queensway Technical Report”); (iv) completed a technical report on the Hammerdown Gold Project titled “New Found Gold Corp. Hammerdown Gold Project, Preliminary Economic Assessment Technical Report, Newfoundland & Labrador, Canada”, filed on March 17, 2026, with an effective date of February 18, 2026, prepared by WSP Canada Inc., Stephen Coates, P.Eng., Christian Beaulieu, P.Geo., Michael Levy, P.Eng., Chafana Hamed Sako, P.Geo., James Guiraud, P.Geo., Stacy J. Freudigmann, P.Eng., Sheldon H. Smith, P.Geo., J. Alex Mcintyre, P.Eng., Neil J. Lincoln, P.Eng., Dachun (David) Jin, P.Eng., William Richard McBride, P.Eng. in compliance with NI 43-101 (the “Hammerdown Technical Report”); (v) undertaken exploration programs, including a 74,000 m diamond drill program and a continuation of the excavation of high-grade, near-surface portions of the Queensway Property; and (vi) retained directors, officers and employees with the skills required to successfully operate a public mineral development and exploration company.
The Company is a reporting issuer in all provinces and territories in Canada and is subject to the reporting requirements of the United States Securities Exchange Act of 1934, as amended (the “Exchange Act”). The Common Shares (as defined herein) of the Company trade on the TSX Venture Exchange (the “TSXV”) under the symbol “NFG” and on the NYSE American stock exchange (the “NYSE American”) under the symbol “NFGC”.
3.2.1Principal Operations
The Company is a mineral exploration company engaged in the acquisition, exploration and evaluation of resource properties with a focus on gold properties located in the Province of Newfoundland and Labrador, Canada.
3.2.2Competitive Conditions
The mineral exploration and mining industry is competitive in all phases of exploration, development and production. The Company competes with a number of other entities and individuals in the search for and the acquisition of attractive mineral properties. As a result of this competition, the Company may not be able to acquire attractive properties in the future on terms it considers acceptable. The Company may also encounter competition from other mining companies in efforts to hire experienced mining professionals. Increased competition could adversely affect the Company’s ability to attract necessary funding or acquire suitable properties or prospects for mineral exploration in the future. See “Risk Factors – Competition and Mineral Exploration”.
3.2.3Specialized Skills and Knowledge
Various aspects of the Company’s business require specialized skills and knowledge. Such skills and knowledge include, but are not limited to, expertise related to mineral exploration, geology, drilling, permitting, metallurgy, logistical planning, and implementation of exploration programs, as well as legal compliance, finance, and accounting. The Company expects to rely upon various legal and financial
6
advisors, consultants, and others in the operation and management of its business. See “Risk Factors – Dependence on Management and Key Personnel”.
3.2.4Cycles
The Company’s mineral exploration activities may be subject to seasonality due to adverse weather conditions including, without limitation, inclement weather, frozen ground and restricted access due to snow, ice, or other weather-related factors. In addition, the mining and mineral exploration business is subject to global economic cycles effecting, among other things, the marketability and price of gold products in the global marketplace.
3.2.5Employees
As at December 31, 2025, the Company had 131 employees, and at the date of this AIF, the Company has 138 employees. The Company also relies on consultants and contractors to carry on its business activities and, in particular, to supervise and carry-out mineral exploration on the Properties.
3.2.6Environmental Protection
The Company is currently engaged in exploration activities on its Queensway Gold Project and in bringing its newly acquired Hammerdown Gold Project and Pine Cove Mill operations into commercial production. Such activities are subject to various laws, rules, and regulations governing the protection of the environment. Corporate obligations to protect the environment under the various regulatory regimes in which the Company operates may affect the financial position, operational performance, and earnings of the Company. A breach of such legislation may result in imposition of fines and penalties. Management believes all of the Company’s activities are in material compliance with all applicable environmental legislation. See “Risk Factors – Environmental Risks”.
3.2.7Social or Environmental Policies
The Company is committed to conducting its operations in accordance with sound social and environmental practices. At present, the scale of operations has not required the adoption of formal policies. The Company will re-evaluate this position if and when necessary.
The Company is subject to the laws and regulations relating to environmental matters in all jurisdictions in which it operates, including provisions relating to property reclamation, discharge of hazardous materials and other matters. The Company may also be held liable should environmental problems be discovered that were caused by former owners and operators of its Properties. The Company conducts its mineral exploration activities in compliance with applicable environmental protection legislation.
3.3.1Director and Officer Appointments and Resignations
On December 18, 2024, the Company announced that following the annual general meeting of the shareholders, the board of directors of the Company (the “Board”) was comprised of Paul Huet, Collin Kettell, Vijay Mehta, William Hayden, and Melissa Render.
On January 20, 2025, the Company announced the appointment of Keith Boyle as Chief Executive Officer of the Company, following the resignation of Collin Kettell from such position.
On February 18, 2025, the Company announced the appointment of Dr. Fiona Childe (Ph.D., P.Geo.) as Vice President, Communications and Corporate Development, Dr. Jared Saunders (Ph.D., CRSP, EP) as Vice President, Sustainability, and Robert Assabgui (P.Eng.) as Study Manager. The Company also
7
announced the resignation of Greg Matheson as Chief Operating Officer, and Ron Hampton as Chief Development Officer.
On March 3, 2025, the Company announced the appointment of Chad Williams to its Board, replacing Collin Kettell, who resigned from the Board.
On August 20, 2025, the Company announced the appointment of Tamara Brown to the Board.
On September 15, 2025, the Company announced the appointment of Dr. Andrew Furey to the Board, replacing Vijay Mehta, who resigned from the Board. The Company also announced the appointment of Hashim Ahmed as Chief Financial Officer, replacing Michael Kanevsky who resigned from that role, and Robert Assabgui as Chief Operation Officer, who was promoted from the role of Study Manager of the Company.
On November 5, 2025, the Company announced the appointment of Jelena Novikov Fried as General Counsel and Corporate Secretary of the Company.
On November 13, 2025, the Company announced the appointment of Allen Palmiere to the Board, replacing Melissa Render, the Company President, who resigned from the Board.
3.3.2Royalty Purchase Agreements
On July 30, 2024 the Company announced that it entered into three royalty purchase agreements (the “Royalty Purchase Agreements”) with arm’s length royalty holders (each a “Vendor” and collectively the “Vendors”) whereby the Company purchased part of each Vendor’s royalty interest. Pursuant to the Royalty Purchase Agreements, the Company purchased, in aggregate, 0.6% of the Vendors’ 1.6% net smelter returns royalty on the Company’s Golden Bullet property (the “Royalty Interests”). Under the terms of the Royalty Purchase Agreements, as consideration for the Royalty Interests, the Company paid $650,000 cash consideration and issued 100,000 Common Shares to each Vendor, for an aggregate cash consideration of $1,950,000 and aggregate share consideration of 300,000 Common Shares. The Company had the right to purchase the remaining 1% net smelter returns royalty from the Vendors for an aggregate price equal to $1,000,000 (the “Repurchase Price”) by November 12, 2024, payable by (i) an aggregate of $100,000 and (ii) an additional $4,950, in the aggregate, per year until the Repurchase Price is satisfied.
On October 15, 2024, the Company announced that the Company purchased the remaining royalty from the Vendors for an aggregate cash consideration of $1,000,000.
3.3.3LabGold Acquisitions
On July 9, 2024, the Company announced that it completed an acquisition of a 100% interest in Labrador Gold Corp.’s (“LabGold”) Kingsway Project (the “Kingsway Project”), located in Gander, Newfoundland and Labrador, as well as certain related assets of LabGold. Pursuant to the acquisition, the Company issued to LabGold 5,263,157 Common Shares as consideration.
3.3.4ThreeD Settlement Agreement
On June 6, 2024, the Company announced that it had entered into a settlement agreement (the “Three D Settlement Agreement”) with respect to the lawsuit filed by ThreeD Capital Inc. (“ThreeD”) and 1313366 Ontario Inc. (“131” and, together with ThreeD, the “Plaintiffs”) against the Company, Palisades Goldcorp Ltd. and Collin Kettell (together, the “Defendants”) in the Ontario Superior Court of Justice. Pursuant to the Three D Settlement Agreement, New Found Gold issued 285,429 Common Shares to ThreeD and 84,571 Common Shares to 131. The Three D Settlement Agreement does not include any admission of liability and provides for fulsome releases by the Plaintiffs to the Defendants.
8
3.3.5Sky Gold Corp. Acquisitions
In May 2024, New Found Gold completed a purchase agreement with Sky Gold Corp. (“Sky Gold”), whereby New Found Gold completed an acquisition of a 100% interest in certain licenses and mining claims of Sky Gold subject to certain existing royalties, which were assumed by New Found Gold. Pursuant to the agreement, New Found Gold paid $35,000 as consideration.
3.3.6Initiation of Initial MRE and PEA for the Queensway Gold Project
On November 6, 2024, the Company announced the initiation of work towards an initial MRE, as well as a PEA for the Queensway Gold Project. On March 24, 2025, the Company announced an initial MRE for its Queensway Gold Project. On April 15, 2025, the Company announced the filing of the technical report for the initial MRE for the Queensway Gold Project. The Company used the initial MRE to prepare a PEA. On July 21, 2025, the Company announced the results of a PEA for the development of the AFZ Core on the Queensway Gold Project, as the first conceptual assessment of the potential economic viability of gold mineralization on the Queensway Gold Project.
3.3.7November 2023 $56 Million Bought Deal Financing
On October 30, 2023, the Company announced it entered into an agreement with BMO Nesbitt Burns Inc. on behalf of a syndicate of underwriters, pursuant to which the underwriters agreed to purchase, on a “bought deal” basis, 7,725,000 Common Shares that qualify as “flow-through shares” (within the meaning of the Income Tax Act (Canada)) at a price of $7.25 per flow-through Common Share (the “2023 Offering Price”) for aggregate gross proceeds of $56,006,250. The Company granted the underwriters an option to purchase up to an additional 1,158,750 flow-through Common Shares at the 2023 Offering Price for the purpose of covering the underwriters’ over-allocation position.
On November 6, 2023, the Company announced it closed the offering of 7,725,000 flow through Common Shares for aggregate gross proceeds of $56,006,250. These flow-through Common Shares were offered by way of a prospectus supplement dated November 1, 2023, to the short form base shelf prospectus dated July 22, 2022 (the “2022 Base Shelf”) in each of the provinces and territories of Canada (other than Québec) and were also offered in the United States under the terms of the Company’s registration statement on Form F-10 (File No. 333-266285) filed with the SEC (the “Registration Statement”).
3.3.8Participation in Brokered Note Offering by Maritime Resources Corp.
On August 14, 2023, the Company participated in a brokered note offering completed by Maritime consisting of the issuance of non‐convertible senior secured notes and common share purchase warrants. The Company subscribed for 2,000 non‐convertible senior secured notes, which mature on August 14, 2025, with a face value of US$1,000 each. These non‐convertible senior secured notes were issued at a 2.0% original issue discount on the principal amount for a gross investment of US$1,960,000 (CAD$2,638,500). On April 14, 2025, the Company announced the sale of the non-convertible senior secured notes for gross proceeds of US$2,000,000. All the warrants expired unexercised on August 14, 2025.
3.3.9Disposal of Lucky Strike Property and Investment in Kirkland Lake Discoveries Corp.
On May 25, 2023, the Company disposed of its 100% interest in its Lucky Strike project to Kirkland Lake Discoveries Corp. (formerly Warrior Gold Inc.) (“KLD”) for total non-cash consideration comprised of 28,612,500 common shares of KLD (“KLD Shares”) and a 1.0% net smelter return royalty on future production from the mineral claims. The investment represented 32.29% of the issued and outstanding KLD Shares at the time of closing, and as at December 31, 2023. The Company exercised its right to nominate two additional directors to the board of directors of KLD.
9
Based on assessments of the relevant facts and circumstances, primarily, the Company’s ownership interests, board representation and ability to influence operating, strategic and financing decisions, the Company concluded that it has had significant influence over KLD for the period from May 25, 2023 and has accounted for its investment in KLD as an investment in an associate.
The KLD Shares are listed on the TSXV.
3.3.10At-The-Market Offering
On August 26, 2022, the Company announced that it had entered into an equity distribution agreement dated August 26, 2022, providing for an at-the-market equity offering program (“ATM”), with BMO Nesbitt Burns Inc. and Paradigm Capital Inc., as the Canadian agents, and BMO Capital Markets Corp., as the U.S. agent. The intention of the ATM was to allow New Found Gold, through the agents and from time to time, to offer and sell, in Canada and the United States through the facilities of the TSXV and NYSE American, such number of Common Shares as would have an aggregate offering price of up to US$100 million. The sales of Common Shares through the ATM were made pursuant to, and qualified in Canada by, a prospectus supplement dated August, 26, 2022, to the 2022 Base Shelf and in the U.S. pursuant to a prospectus supplement contained in the effective Registration Statement.
During the twelve months ended December 31, 2023, the Company sold 3,552,224 Common Shares under the ATM at an average price of $6.47 for gross proceeds of $22,980,338, or net proceeds of $22,440,215, and paid an aggregate commission of $540,123.
During the twelve months ended December 31, 2024, the Company sold 5,857,242 Common Shares under the ATM at an average price of $4.70 for gross proceeds of $27,522,494, or net proceeds of $26,604,884, and paid an aggregate commission of $917,610. As at September 30, 2024, the ATM was terminated.
3.3.112025 Base Shelf Prospectus
On May 23, 2025, the Company filed a final short form base shelf prospectus (the “2025 Base Shelf”) and a Registration Statement with respect to the offerings of securities of the Company, allowing the Company to raise aggregate gross proceeds of up to US$300 million over 25 months.
3.3.122025 Bought Deal Offering
On June 12, 2025, the Company completed a bought deal offering of (i) 24,610,000 flow-through Common Shares at a price of $2.29 per Common Share; and (ii) 4,370,000 non flow-through Common Shares at a price of $1.63 per Common Share, for aggregate proceeds of $63,480,000, closing the first tranche of the offering on June 3, 2025 and the second and final tranche on June 12, 2025. The Company incurred share issuance costs, $3,808,862 in cash of which $2,602,373 was paid to the underwriters. The premium received on the flow-through shares issued was determined to be $16,242,600.
3.3.132025 Non-Brokered Private Placement
On August 27, 2025, the Company announced the closing of a non-brokered private placement of 12,269,939 Common Shares for gross proceeds of $20,000,000 to Mr. Eric Sprott, through 2176423 Ontario Ltd., a company beneficially owned by Mr. Sprott. As a result of the private placement, Mr. Sprott beneficially owned approximately 23.1% of the Company on a non-diluted basis.
3.3.14Queensway Gold Project Advancement
On January 7, 2026, the Company announced the completion of its 2025 work program, including over 74,000 m of diamond drilling with a primary focus on resource definition and pre-development work, and a secondary focus on exploration, with high-grade discoveries such as the Dropkick zone underscoring the camp-scale potential of the district. Approximately 75% of the drilling focused on the AFZ Core area and
10
the remaining 25% focused on exploration targets outside the MRE area. Excavation, mapping and channel sampling were completed at the Iceberg and Lotto zones.
During 2025, the Company completed approximately 25% of its drilling on exploration outside the AFZ Core. This work included drill testing at the highly prospective Dropkick and Pistachio zones, as well as the newly discovered Blue Jay zone. High-grade gold was discovered at Dropkick in late 2024 within the AFZ Peripheral area and 2025 drilling has extended the mineralized footprint to approximately 815 m along strike and 285 m down dip, with multiple high-grade intercepts both west and east of the Appleton Fault Zone.
A regional exploration program was completed in the southern portion of the Queensway Gold Project, known as Queensway South, up to 64 km south of AFZ Core. In this area, the Company continues to develop earlier-stage targets along the Appleton Fault Zone, the same structure that controls gold mineralization AFZ Core.
The Queensway land package now totals 219,175 hectares as a result of the successful completion of the acquisition of a 100% interest in certain mineral claims in central Newfoundland previously held by Exploits Discovery Corp. (“Exploits”).
3.3.15Acquisition of Maritime Resources Corp.
On November 13, 2025, the Company announced the closing of the acquisition of all of the issued and outstanding shares of Maritime that it did not already own by way of a statutory plan of arrangement pursuant to Division 5 of Part 9 of the BCBCA (the “Arrangement”). Under the terms of the arrangement agreement entered into by the Company and Maritime on September 4, 2025, each holder of common shares in the capital of Maritime (each, a “Maritime Share”) received 0.75 of a Common Share in exchange for each Maritime Share (the “Exchange Ratio”).
Immediately upon completion of the Arrangement, existing Company shareholders and former Maritime shareholders held approximately 69% and 31%, respectively, of the pro forma company on a fully-diluted in-the-money basis and Maritime became a wholly-owned subsidiary of the Company. Maritime ceased to be a reporting issuer under applicable Canadian securities laws effective January 6, 2026 and the Maritime Shares were delisted from the TSXV.
In accordance with the plan of arrangement, each option to purchase Maritime Shares (each, a “Maritime Option”) was cancelled and exchanged for a replacement option (each, a “Replacement Option”) to acquire from the Company such number of Common Shares equal to the product of: (A) that number of Maritime Shares that were issuable upon exercise of such Maritime Option immediately prior to the effective time of the transaction (the “Effective Time”) and (B) the Exchange Ratio, at an exercise price per Common Share equal to the quotient determined by dividing: (X) exercise price per Maritime Share at which such Maritime Option was exercisable immediately prior to the Effective Time, by (Y) the Exchange Ratio. Pursuant to the plan of arrangement, each outstanding Maritime share purchase warrant became exercisable for Common Shares issuable on exercise and adjusted in accordance with the Exchange Ratio.
On November 13, 2025, the Company filed a business acquisition report in connection with the Arrangement.
The strategic acquisition of Maritime marked the Company’s transformation from an exploration company into an emerging multi-asset gold producer. As a result of the Arrangement, the Company acquired the Hammerdown Gold Project, an emerging gold producer in central Newfoundland, targeted to ramp up to commercial production through 2026, with a permitted mill and tailings at Pine Cove, and a hydrometallurgical gold plant at Nugget Pond.
11
3.3.16Shares for Debt Transaction
As part of the acquisition of Maritime, the Company entered into a debt settlement agreement (the “SCP Settlement Agreement”) with SCP Resource Finance LP (“SCP”) to settle an aggregate amount of $3,276,712 in outstanding Maritime debt, rounded down to the nearest whole number of shares, related to the fees incurred by Maritime pursuant to the terms of the letter agreement with SCP dated March 20, 2024, as amended on August 8, 2025, whereby SCP was appointed as financial advisor in connection with strategic matters related to any financing or a transaction resulting in the sale of Maritime. Pursuant to the terms of the SCP Settlement Agreement, the Company agreed to issue 1,085,003 Common Shares (the “Settlement Shares”) at a deemed issue price of $3.02 per Settlement Share, based on the closing price of the Common Shares on the TSXV on November 12, 2025.
3.3.17Engagement of Cutfield Freeman & Co. Ltd.
On November 28, 2025, the Company announced that it engaged Cutfield Freeman & Co. Ltd., an independent global mining finance advisory firm, to act as its project finance advisor on developing and implementing project finance strategies for the Queensway Gold Project.
3.3.18Exploits Acquisition
On December 5, 2025, the Company announced it had successfully completed its acquisition of a 100% interest in certain mineral claims in Newfoundland and Labrador previously held by Exploits. The claims adjoin the Queensway Gold Project and increase the size of the project by up to 31%, to a total of 230,225 hectares. As consideration for the claims, the Company (i) issued 2,821,556 Common Shares to Exploits; (ii) granted to Exploits the Exploits Royalty (as defined below); and (iii) within 10 business days following a positive final determination by the Supreme Court of Newfoundland and Labrador with respect to certain disputed mineral claims, will issue 725,543 Common Shares to Exploits. As partial consideration for the claims, the Company granted to Exploits a 1.0% net smelter returns royalty on certain of the mineral claims (the “Exploits Royalty”) on the products derived from certain of the mineral licenses forming part of the claims pursuant to a royalty agreement. For three years from the date of the royalty agreement, the Company retains the right and option to purchase 0.5% of the Exploits Royalty for a price equal to $750,000.
3.3.19Recent Events
On January 26, 2026, the Company announced key advancements at its Queensway Gold Project, including entering into of a Phase 1 engineering, procurement and construction management contract.
On February 26, 2026, the Company announced a PEA and updated MRE for the Hammerdown Gold Project.
On March 5, 2026, the Company announced it had entered into a non-binding term sheet for an up to US$75,000,000 loan facility (the “Loan Facility”) with Nebari Natural Resources Credit Fund II, LP (“Nebari”). The proceeds from the Loan Facility will be used as financing for the development of the Queensway Gold Project, including the procurement of long lead items, early construction activities, upgrading and expanding the Company’s 100% owned and permitted Pine Cove Mill to accommodate Queensway Phase 1 off-site milling, and general working capital purposes. Pursuant to the non-binding term sheet, the Loan Facility will be documented by way of a senior secured debenture and advanced in two tranches: US$50,000,000 to be funded at closing (“Tranche 1”) and, subject to the satisfaction of certain conditions and if required by the Company, an additional US$25,000,000 to be funded no later than 15 months after closing (“Tranche 2”) at no current additional standby fee. Both tranches will be subject to customary arrangement fees. The Loan Facility will bear interest at a fixed annual rate of 9.25% payable quarterly in arrears, will have a term of 24 months, and will be subject to a quarterly administration fee based on a fixed annual fee of 0.50%. The Company will have the option to extend the term by an additional six months. The funds to be advanced reflect principal amounts subject to an original issue discount, which will increase if the term is extended.
12
In connection with the Loan Facility and subject to the approval of the TSXV, the Company will issue to Nebari at closing non-transferable warrants for the purchase of Common Shares. The warrants issued in connection with Tranche 1 will have an aggregate value of US$3,750,000, and the warrants issued in connection with Tranche 2 will have an aggregate value of US$1,875,000. Each warrant will be exercisable for one Common Share at an exercise price equal to a 25% premium to the lower of the volume weighted average price of the Common Shares on the TSXV for the 20 trading days prior to (a) the announcement, i.e., March 5, 2026, and (b) the date the warrants are issued, provided that the exercise price will not be below the market price as determined by the TSXV. The warrants will be exercisable for a period of 24 months following closing. If the Company extends the term of the loan by an additional six months, the expiration date of the warrants will also be extended by six months if permitted by the TSXV.
All direct and indirect subsidiaries of the Company will guarantee the Loan Facility. The Company and such guarantors will secure the Loan Facility with first-lien security interests over all of their present and after-acquired real and personal property.
The provision of the Loan Facility remains subject to customary conditions precedent, such as the negotiation, execution, delivery and registration of definitive financing documents, completion of due diligence to Nebari’s satisfaction, receipt of all necessary corporate and regulatory approvals (including approval of the TSXV), and approval by Nebari’s Investment Committee. The term sheet includes a mutual break fee in the event of a termination by either party prior to closing.
On March 17, 2026, the Company filed the Hammerdown Technical Report.
The Company completed 23,226 m of additional diamond drilling in 2024, as well as Keats excavation channel sampling, subsequent to the database cutoff for the Queensway Technical Report. This work expanded gold mineralization at the Golden Dome, Dropkick and Pistachio zones.
In 2025, the Company drilled 74,377 m across 614 holes, with about 75% dedicated to AFZC drilling in support of Phase 1 mine planning and 25% directed toward exploration targets, including the Dropkick zone.
The 2026 drill program is underway with four rigs active. Early 2026 drilling will focus on converting PEA Phase 2 open pit resources, shifting later in the year toward Phase 3 underground resource conversion.
Beginning in Q2 2026, the Company plans to expand grade control drilling, refining drill spacing based on 2025 results and completing or expanding grade control programs at Iceberg, Lotto, and Keats.
Exploration drilling in 2026 will target AFZ Core resource expansion, step-outs at Dropkick, and work along the AFZ Peripheral
An updated Queensway Technical Report, including a revised mineral resource estimate, is planned for mid 2026.
The business and operations of New Found Gold are speculative due to the high-risk nature of its business, which is the development and exploration of mineral properties. The risks listed below are not the only risks and uncertainties that New Found Gold faces. Additional risks and uncertainties not presently known to New Found Gold or that New Found Gold currently considers immaterial may also materially impair its business. These risk factors could materially affect New Found Gold’s business, financial condition and future operating results and could cause actual events to differ materially from those described in forward-looking statements relating to the Company.
If any of the following risks occur, New Found Gold’s business, financial condition and operating results could be materially adversely affected.
13
4.1Risks Related to the Company
4.1.1Exploration Stage Company
The Company is an exploration stage company and cannot give any assurance that a commercially viable deposit, or “reserve”, exists on any properties for which the Company currently has or may have (through potential future joint venture agreements or acquisitions) an interest. Determination of the existence of a reserve depends on appropriate and sufficient exploration work and the evaluation of legal, economic, and environmental factors. If the Company fails to find a commercially viable deposit on any of its properties, its financial condition and results of operations will be materially adversely affected.
4.1.2Uncertainty of Mineral Reserves and Mineral Resources Estimates
New Found Gold’s Mineral Reserves and Mineral Resources are estimates, and there is no assurance that anticipated tonnages, grades or recovery levels will be achieved, or that Mineral Reserves can be mined and processed profitably. Mineral Reserves and Mineral Resources involve uncertainties and subjective judgements based on available data. Short-term operating factors such as the need for orderly development of the ore bodies or processing new ore grades can affect profitability in any accounting period. In addition, laboratory test recoveries may not replicate in larger-scale production. Commodity price fluctuations, drilling results, metallurgical testing, and mine plan evaluations may require estimate revisions. Significant reductions in estimates of Mineral Reserves and Mineral Resources, or in New Found Gold’s ability to extract Mineral Reserves, could adversely impact New Found Gold’s business and financial position. Inferred Mineral Resources that are not Mineral Reserves lack demonstrated economic viability and require extensive exploration and investigation to determine if they can be upgraded to a higher category.
4.1.3Reliability of Historical Information
The Company has relied on, and the disclosure in the Queensway Technical Report and the Hammerdown Technical Report is based, in part, upon, historical data compiled by previous parties involved with the mineral claims that form the Queensway Gold Project and the Hammerdown Gold Project, as applicable. To the extent that any of such historical data is inaccurate or incomplete, the Company’s exploration plans may be adversely affected.
4.1.4Mineral Exploration and Development
Resource exploration and development is a speculative business, characterized by a number of significant risks including, among other things, unprofitable efforts resulting not only from the failure to discover mineral deposits but from finding mineral deposits which, though present, are insufficient in quantity and quality to return a profit from production. The marketability of minerals acquired or discovered by the Company may be affected by numerous factors which are beyond the control of the Company and which cannot be accurately predicted, such as market fluctuations, the proximity and capacity of milling facilities, mineral markets and processing equipment and such other factors as government regulations, including regulations relating to royalties, allowable production, importing and exporting of minerals and environmental protection, the combination of which factors may result in the Company not receiving an adequate return of investment capital.
There is no assurance that the Company’s mineral exploration and any development activities will result in any discoveries of commercial bodies of ore. The long-term profitability of the Company’s operations will in part be directly related to the costs and success of its exploration programs, which may be affected by a number of factors. Substantial expenditures are required to establish mineral resources through drilling and to develop the mining and processing facilities and infrastructure at any site chosen for mining. Although substantial benefits may be derived from the discovery of a major mineralized deposit, no assurance can be given that minerals will be discovered in sufficient quantities to justify commercial operations or that funds required for development can be obtained on a timely basis. Substantial expenditures are required to establish reserves through exploration and drilling, to develop metallurgical processes to extract the
14
metal from the ore and, in the case of new properties, to develop the mining and processing facilities and infrastructure at any site chosen for mining. Although substantial benefits may be derived from the discovery of a major mineralized deposit, no assurance can be given that minerals will be discovered in sufficient quantities and grades to justify commercial operations or that funds required for development can be obtained on a timely basis.
Estimates of reserves, mineral deposits and production costs can also be affected by such factors as environmental permitting regulations and requirements, weather, environmental factors, unforeseen technical difficulties, unusual or unexpected geological formations and work interruptions. In addition, the grade of ore ultimately mined may differ from that indicated by drilling results. Short term factors relating to reserves, such as the need for orderly development of ore bodies or the processing of new or different grades, may also have an adverse effect on mining operations and on the results of operations. Material changes in ore reserves, grades, stripping ratios or recovery rates may affect the economic viability of any project.
4.1.5Operational hazards and risks
Our operations will be subject to all of the hazards and risks normally encountered in the exploration and development of minerals. To the extent that we take a property to production, we will be subject to all of the hazards and risks associated with the production of minerals. These risks include:
| ● | unusual and unexpected geological formations; |
| ● | rock falls; |
| ● | seismic activity; |
| ● | flooding and other conditions involved in the extraction of material, any of which could result in damage to, or destruction of, mines and other producing facilities, damage to life or property, environmental damage and possible legal liability; |
| ● | environmental pollution, and consequent liability that could have a material adverse impact on our business, operations and financial performance; |
| ● | mechanical equipment, facility performance problems and industrial accidents; and |
| ● | periodic disruptions due to inclement or hazardous weather conditions. |
4.1.6Competition and Mineral Exploration
The mineral exploration industry is intensely competitive in all of its phases and the Company must compete in all aspects of its operations with a substantial number of large established mining companies with greater liquidity, greater access to credit and other financial resources, newer or more efficient equipment, lower cost structures, more effective risk management policies and procedures and/or greater ability than the Company to withstand losses. The Company’s competitors may be able to respond more quickly to new laws or regulations or emerging technologies or devote greater resources to the expansion of their operations, than the Company can. In addition, current and potential competitors may make strategic acquisitions or establish cooperative relationships among themselves or with third parties. Competition could adversely affect the Company’s ability to acquire suitable new mineral properties or prospects for exploration in the future. Competition could also affect the Company’s ability to raise financing to fund the exploration and development of its properties or to hire qualified personnel. The Company may not be able to compete successfully against current and future competitors, and any failure to do so could have a material adverse effect on the Company’s business, financial condition or results of operations.
4.1.7Additional Funding
The exploration and development of the Company’s mineral properties will require substantial additional capital. When such additional capital is required, the Company will need to pursue various financing transactions or arrangements, including joint venturing of projects, debt financing, equity financing or other means. Additional financing may not be available when needed or, if available, the terms of such financing might not be favourable to the Company and might involve substantial dilution to existing shareholders. The
15
Company may not be successful in locating suitable financing transactions in the time period required or at all. A failure to raise capital when needed would have a material adverse effect on the Company’s business, financial condition and results of operations. Any future issuance of securities to raise required capital will likely be dilutive to existing shareholders. In addition, debt and other debt financing may involve a pledge of assets and may be senior to interests of equity holders. The Company may incur substantial costs in pursuing future capital requirements, including investment banking fees, legal fees, accounting fees, securities law compliance fees, printing and distribution expenses and other costs.
The ability to obtain needed financing may be impaired by such factors as the capital markets (both generally and in the gold and copper industries in particular), the Company’s status as a new enterprise with a limited history, the location of the Company’s mineral properties, the price of commodities and/or the loss of key management personnel.
4.1.8Proposed Loan Facility default risk
The Company has entered into a non-binding term sheet for an up to US$75,000,000 Loan Facility. If the Company enters into this proposed Loan Facility, its assets will be pledged as security, which may limit the Company’s financial flexibility and subject the Company to a risk of default. Under the terms of the proposed Loan Facility, the Company and its subsidiaries would be required to grant a first-lien security interest over all of their present and after-acquired real and personal property. The existence of such security interest may significantly restrict the Company’s ability to obtain additional secured or unsecured financing in the future, as there may be limited, or no, unencumbered collateral available to offer to other lenders.
The proposed Loan Facility requires the Company to meet certain financial covenants. Failure to comply with these covenants could result in an event of default. If an event of default under the proposed Loan Facility occurs, Nebari could elect to declare all principal amounts outstanding thereunder at such time, together with accrued interest, to be immediately due. Furthermore, if the Company were unable to repay any amounts due and payable under the proposed Loan Facility, Nebari could proceed against the security securing such indebtedness. The Company may not have sufficient assets to repay that indebtedness and could be forced into bankruptcy, receivership or liquidation. An event of default under the proposed Loan Facility would have a material adverse effect on the Company’s operations and financial condition. In the event of a bankruptcy, receivership or liquidation, secured lenders will generally be entitled to payment of their claims from the assets of the Company before any assets are made available for distribution to the shareholders.
4.1.9Acquisition of Additional Mineral Properties
If the Company loses or abandons its interests in its mineral properties, there is no assurance that it will be able to acquire another mineral property of merit or that such an acquisition would be approved by applicable securities regulatory authorities. There is also no guarantee that applicable securities regulatory authorities will approve the acquisition of any additional properties by the Company, whether by way of an option or otherwise, should the Company wish to acquire any additional properties.
4.1.10Government or Regulatory Approvals
Exploration and development activities are dependent upon the grant of appropriate licences, concessions, leases, permits and regulatory consents, which may be withdrawn or made subject to limitations. There is no guarantee that, upon completion of any exploration, a mining licence will be granted with respect to exploration territory. There can also be no assurance that any exploration licence will be renewed or if so, on what terms. These licences place a range of past, current and future obligations on the Company. In some cases, there could be adverse consequences for breach of these obligations, ranging from penalties to, in extreme cases, suspension or termination of the relevant licence or related contract.
16
4.1.11Permits and Government Regulation
The future operations of the Company may require permits from various federal, state, provincial and local governmental authorities and will be governed by laws and regulations governing prospecting, development, mining, production, export, taxes, labour standards, occupational health, waste disposal, land use, environmental protections, mine safety and other matters.
Although Canada has a favourable legal and fiscal regime for exploration and mining, including a relatively simple system for the acquisition of mineral titles and relatively low tax burden, possible future government legislation, policies and controls relating to prospecting, development, production, environmental protection, mining taxes and labour standards could cause additional expense, capital expenditures, restrictions and delays in the activities of the Company, the extent of which cannot be predicted. Before development and production can commence on any properties, the Company must obtain regulatory and environmental approvals. There is no assurance that such approvals can be obtained on a timely basis or at all. The cost of compliance, with changes in governmental regulations, has the potential to reduce the profitability of operations. The Company is currently in compliance with all material regulations applicable to its exploration activities.
4.1.12Limited Operating History
The Company has a limited operating history and its mineral properties are exploration stage properties. As such, the Company will be subject to all of the business risks and uncertainties associated with any new business enterprise, including under-capitalization, cash shortages, limitations with respect to personnel, financial and other resources and lack of revenues. The current state of the Company’s mineral properties require significant additional expenditures before any cash flow may be generated. Although the Company possesses an experienced management team, there is no assurance that the Company will be successful in achieving a return on shareholders’ investment and the likelihood of success of the Company must be considered in light of the problems, expenses, difficulties, complications and delays frequently encountered in connection with the establishment of any business. There is no assurance that the Company can generate revenues, operate profitably, or provide a return on investment, or that it will successfully implement its plans.
An investment in the Company’s securities carries a high degree of risk and should be considered speculative by purchasers. There is no assurance that we will be successful in achieving a return on shareholders’ investment and the likelihood of our success must be considered in light of our early stage of operations. You should consider any purchase of the Company’s securities in light of the risks, expenses and problems frequently encountered by all companies in the early stages of their corporate development.
4.1.13No history of mineral production at the Queensway Gold Project
New Found Gold has no history of commercially producing metals from the Queensway Gold Project. There can be no assurance that we will successfully establish mining operations or profitably produce gold or other precious metals from the Queensway Gold Project. The development of mineral properties involves a high degree of risk and few properties that are explored are ultimately developed into producing mines. The commercial viability of a mineral deposit is dependent upon a number of factors which are beyond our control, including the attributes of the deposit, commodity prices, government policies and regulation and environmental protection. Fluctuations in the market prices of minerals may render Mineral Reserves and deposits containing relatively lower grades of mineralization uneconomic.
While our Hammerdown Gold Project is currently being brought into commercial gold production, none of our other mineral properties are currently under development or production. The future development of any properties found to be economically feasible will require applicable licenses and permits and will require the construction and operation of mines, processing plants and related infrastructure. As a result, the development of any property, including the Queensway Gold Project, will be subject to all of the risks associated with establishing new mining operations and business enterprises, including, but not limited to:
17
| ● | the timing and cost of the construction of mining and processing facilities; |
| ● | the availability and costs of skilled labour and mining equipment; |
| ● | the availability and cost of appropriate smelting and/or refining arrangements; |
| ● | the need to obtain necessary environmental and other governmental approvals and permits and the timing of those approvals and permits; |
| ● | our ability to build relationships with, and secure consent from, the Indigenous communities around our projects; and |
| ● | the availability of funds to finance construction and development activities. |
It is common in new mining operations to experience unexpected problems and delays during development, construction and mine start-up. In addition, delays in the commencement of mineral production often occur. Accordingly, there are no assurances that our activities at the Queensway Gold Project will result in profitable mining operations or that mining operations will be established at any of our properties.
4.1.14Title Risks
Although the Company has or will receive title opinions for any properties in which it has a material interest, there is no guarantee that title to such properties will not be challenged or impugned. The Company has not conducted surveys on all of the claims in which it holds direct or indirect interests. The Company’s properties may be subject to prior unregistered agreements or transfers or native land claims and title may be affected by unidentified or unknown defects. Title insurance is generally not available for mineral properties and the Company’s ability to ensure that it has obtained secure claims to individual mineral properties or mining concessions may be constrained.
A successful challenge to the Company’s title to a property or to the precise area and location of a property could cause delays or stoppages to the Company’s exploration, development or operating activities without reimbursement to the Company. Any such delays or stoppages could have a material adverse effect on the Company’s business, financial condition and results of operations.
4.1.15Laws and Regulation
The Company’s exploration activities are subject to extensive federal, provincial and local laws and regulations governing prospecting, development, production, exports, taxes, labour standards, occupational health and safety, mine safety and other matters in all the jurisdictions in which it operates. These laws and regulations are subject to change, can become more stringent and compliance can therefore become more costly. The Company applies the expertise of its management, advisors, employees and contractors to ensure compliance with current laws.
4.1.16Uninsured and Underinsured Risks
The Company faces and will face various risks associated with mining exploration and the management and administration thereof including those associated with being a public company. Some of these risks are not insurable; some may be the subject of insurance which is not commercially feasible for the Company. Those insurances which are purchased will have exclusions and deductibles which may eliminate or restrict recovery in the event of loss. In some cases, the amount of insurance purchased may not be adequate in amount or in limit.
The Company will undertake intermittent assessments of insurable risk to help ensure that the impact of uninsured/underinsured loss is minimized within reason. Risks may vary from time to time within this intermittent period due to changes in such things as operations operating conditions, laws or the climate which may leave the Company exposed to periods of additional uninsured risk.
In the event risk is uninsurable, at its reasonable and sole discretion, the Company may endeavor to implement policies and procedures, as may be applicable and/or feasible, to reduce the risk of related loss.
18
4.1.17Global Economy Risk
The volatility of global capital markets, over the past several years has generally made the raising of capital by equity or debt financing more difficult. The Company may be dependent upon capital markets to raise additional financing in the future. As such, the Company is subject to liquidity risks in meeting its operating expenditure requirements and future development cost requirements in instances where adequate cash positions are unable to be maintained or appropriate financing is unavailable.
These factors may impact the ability to raise equity or obtain loans and other credit facilities in the future and on terms favourable to the Company and its management.
In addition, as the Company’s operations expand and reliance on global supply chains increases, the impact of significant geopolitical risk and conflict globally may have a sizeable and unpredictable impact on the Company’s business, financial condition and operations. The ongoing conflict in Ukraine, Iran and Gaza, and the global response to these conflicts as it relates to sanctions, trade embargos and military support has resulted in significant uncertainty as well as economic and supply chain disruptions. Should the conflicts in Ukraine, Iran and Gaza expand or continue for an extended period of time, or should other geopolitical disputes and conflicts emerge in other regions, this could result in material adverse effects to the Company.
4.1.18Uncertainty of Trade Policies
The imposition of tariffs or other trade restrictions, particularly those threatened or imposed by the U.S. and any retaliatory tariffs imposed by Canada, could have significant repercussions for Canadian businesses and the broader economy. Increased costs of goods and services may contribute to inflation and hamper economic growth. The Company can be affected by tariffs and the consequent disruptions in global trade in several ways, including decreased availability of supplies and increases to costs related to changes in foreign exchange rates.
4.1.19Sanctions
The Company’s business, financial condition and results of operations may be negatively affected by economic and other consequences from Russia’s military action against Ukraine and the sanctions imposed in response to that action.
In late February 2022, Russia launched a large-scale military attack on Ukraine. The invasion significantly amplified already existing geopolitical tensions among Russia, Ukraine, Europe, NATO, and the West, including Canada. In response to the military action by Russia, various countries, including Canada, the United States, the United Kingdom, and European Union issued broad-ranging economic sanctions against Russia. Such sanctions included, among other things, a prohibition on doing business with certain Russian companies, large financial institutions, officials, and oligarchs; a commitment by certain countries and the European Union to remove selected Russian banks from the Society for Worldwide Interbank Financial Telecommunications, or SWIFT, the electronic banking network that connects banks globally; a ban of oil imports from Russia to the United States; and restrictive measures to prevent the Russian Central Bank from undermining the impact of the sanctions. Additional sanctions may be imposed in the future.
Such sanctions (and any future sanctions) and other actions against Russia may adversely impact, among other things, the Russian economy and various sectors of the economy, including but not limited to, financials, energy, metals and mining, engineering and defense and defense-related materials sectors; result in a decline in the value and liquidity of Russian securities; result in boycotts, tariffs, and purchasing and financing restrictions on Russia’s government, companies and certain individuals; weaken the value of the ruble; downgrade the country’s credit rating; freeze Russian securities and/or funds invested in prohibited assets and impair the ability to trade in Russian securities and/or other assets; and have other adverse consequences on the Russian government, economy, companies and region. Further, several large corporations and U.S. states have announced plans to divest interests or otherwise curtail business dealings with certain Russian businesses.
19
The ramifications of the hostilities and sanctions may not be limited to Russia, Ukraine, and Russian and Ukrainian companies and may spill over to and negatively impact other regional and global economic markets (including Europe, Canada, and the United States), companies in other countries (particularly those that have done business with Russia and Ukraine) and on various sectors, industries and markets for securities and commodities globally, such as oil and natural gas. Accordingly, the actions discussed above and the potential for a wider conflict could increase financial market volatility and cause severe negative effects on regional and global economic markets, industries, and companies. In addition, Russia may take retaliatory actions and other countermeasures, including cyberattacks and espionage against other countries and companies around the world, which may negatively impact such countries and companies.
The extent and duration of the military action or future escalation of such hostilities, the extent and impact of existing and future sanctions, market disruptions, and volatility, and the result of any diplomatic negotiations cannot be predicted.
While we expect any direct impacts to our business to be limited, the indirect impacts on the economy and on the mining industry and other industries in general could negatively affect our business and may make it more difficult for us to raise equity or debt financing. In addition, the impact of other current macro-economic factors on our business, which may be exacerbated by the war in Ukraine – including inflation, supply chain constraints and geopolitical events – is uncertain. If these levels of volatility persist or if there is a further economic slowdown, the Company’s operations, the Company’s ability to raise capital could be adversely impacted.
4.1.20Inflation
The Company’s operating costs could escalate and become uncompetitive due to supply chain disruptions, inflationary cost pressures, equipment limitations, escalating supply costs, commodity prices and additional government intervention through stimulus spending or additional regulations. The Company’s inability to manage costs may impact, among other things, future development decisions, which could have a material adverse impact on the Company’s financial performance.
4.1.21Environmental Risks
The Company’s activities are subject to extensive laws and regulations governing environment protection. The Company is also subject to various reclamation related conditions. Although the Company closely follows and believes it is operating in compliance with all applicable environmental regulations, there can be no assurance that all future requirements will be obtainable on reasonable terms. Failure to comply may result in enforcement actions causing operations to cease or be curtailed and may include corrective measures requiring capital expenditures. Intense lobbying over environmental concerns by non-governmental organizations has caused some governments to cancel or restrict development of mining projects. Current publicized concern over climate change may lead to carbon taxes, requirements for carbon offset purchases or new regulation. The costs or likelihood of such potential issues to the Company cannot be estimated at this time.
The legal framework governing this area is constantly developing, therefore the Company is unable to fully ascertain any future liability that may arise from the implementation of any new laws or regulations, although such laws and regulations are typically strict and may impose severe penalties (financial or otherwise). The proposed activities of the Company, as with any exploration, may have an environmental impact which may result in unbudgeted delays, damage, loss, and other costs and obligations including, without limitation, rehabilitation, and/or compensation.
There is also a risk that the Company’s operations and financial position may be adversely affected by the actions of environmental groups or any other group or person opposed in general to the Company’s activities and, in particular, the proposed exploration and mining by the Company within the Province of Newfoundland and Labrador.
20
4.1.22Social and Environmental Activism
There is an increasing level of public concern relating to the effects of mining on the nature landscape, in communities and on the environment. Certain non-governmental organizations, public interest groups and reporting organizations (“NGOs”) who oppose resource development can be vocal critics of the mining industry. In addition, there have been many instances in which local community groups have opposed resource extraction activities, which have resulted in disruption and delays to the relevant operation.
While the Company seeks to operate in a social responsible manner and believes it has good relationships with local communities in the regions in which it operates, NGOs, or local community organizations could direct adverse publicity against and/or disrupt the operations of the Company in respect of one or more of its properties, regardless of its successful compliance with social and environmental best practices, due to political factors, activities of unrelated third parties on lands in which the Company has an interest, or the Company’s operations specifically. Any such actions and the resulting media coverage could have an adverse effect on the reputation and financial condition of the Company or its relationships with the communities in which it has operations, which could have a material adverse effect on the Company’s business, financial condition, results of operations, cash flows, or prospects.
4.1.23Dependence on Management and Key Personnel
The success of the Company is currently largely dependent on the performance of its directors and officers. The loss of the services of any of these persons could have a materially adverse effect on the Company’s business and prospects. There is no assurance the Company can maintain the services of its directors, officers, or other qualified personnel required to operate its business. As the Company’s business activity grows, the Company will require additional key financial, administrative, and mining personnel, as well as additional operations staff. There can be no assurance that these efforts will be successful in attracting, training, and retaining qualified personnel as competition for persons with these skill sets increase. If the Company is not successful in attracting, training, and retaining qualified personnel, the efficiency of its operations could be impaired, which could have an adverse impact on the Company’s operations and financial condition.
4.1.24First Nations Land Claims
Certain of the Company’s mineral properties may now or in the future be the subject of First Nations land claims. The legal nature of First Nations land claims is a matter of considerable complexity. The impact of any such claim on the Company’s material interest in the Company’s mineral properties and/or potential ownership interest in the Company’s mineral properties in the future, cannot be predicted with any degree of certainty and no assurance can be given that a broad recognition of First Nations rights in the areas in which the Company’s mineral properties are located, by way of negotiated settlements or judicial pronouncements, would not have an adverse effect on the Company’s activities.
Even in the absence of such recognition, the Company may at some point be required to negotiate with and seek the approval of holders of First Nations interests in order to facilitate exploration and development work on the Company’s mineral properties, there is no assurance that the Company will be able to establish practical working relationships with the First Nations in the area which would allow it to ultimately develop the Company’s mineral properties.
4.1.25Claims and Legal Proceedings
The Company and/or its directors and officers may be subject to a variety of civil or other legal proceedings, with or without merit. From time to time in the ordinary course of its business, the Company may become involved in various legal proceedings, including commercial, employment and other litigation and claims, as well as governmental and other regulatory investigations and proceedings. Such matters can be time-consuming, divert management’s attention and resources and cause the Company to incur significant expenses. Furthermore, because litigation is inherently unpredictable, the results of any such actions may
21
have a material adverse effect on the Company’s business, operating results or financial condition. See Section 12 – Legal Proceedings and Regulatory Actions.
4.1.26Conflicts of Interest
Most of the Company’s directors and officers do not devote their full time to the affairs of the Company. All of the directors and some of the officers of the Company are also directors, officers and shareholders of other natural resource or public companies, and as a result they may find themselves in a position where their duty to another company conflicts with their duty to the Company. Although the Company has policies which address such potential conflicts and the BCBCA has provisions governing directors in the event of such a conflict, none of the Company’s constating documents or any of its other agreements contain any provisions mandating a procedure for addressing such conflicts of interest. There is no assurance that any such conflicts will be resolved in favour of the Company. If any such conflicts are not resolved in favour of the Company, the Company may be adversely affected.
4.1.27Gold and Metal Prices
If the Company’s mineral properties are developed from exploration properties to full production properties, the majority of our revenue will be derived from the sale of gold. Therefore, the Company’s future profitability will depend upon the world market prices of the gold for which it is exploring. The price of gold and other metals are affected by numerous factors beyond the Company’s control, including levels of supply and demand, global or regional consumptive patterns, sales by government holders, metal stock levels maintained by producers and others, increased production due to new mine developments and improved mining and production methods, speculative activities related to the sale of metals, availability and costs of metal substitutes. Moreover, gold prices are also affected by macroeconomic factors such as expectations regarding inflation, interest rates and global and regional demand for, and supply of, gold as well as general global economic conditions. These factors may have an adverse effect on the Company’s exploration, development and production activities, as well as on its ability to fund those activities.
4.1.28Negative Cash Flow from Operating Activities
The Company has no history of earnings and had negative cash flow from operating activities since inception. The Company’s Queensway Gold Project is in the exploration stage and the Company is engaged in bringing its newly acquired Hammerdown Gold Project and Pine Cove Mill operations into commercial production. The proposed exploration programs on the Company’s mineral properties are exploratory in nature. Significant capital investment will be required to achieve commercial production from the Company’s existing projects. There is no assurance that any of the Company’s mineral properties will generate earnings, operate profitably, or provide a return on investment in the future. Accordingly, the Company will be required to obtain additional financing in order to meet its future cash commitments.
4.1.29Going Concern Risk
The Company’s financial statements have been prepared assuming the Company will continue on a going-concern basis and do not include adjustments to amounts and classifications of assets and liabilities that might be necessary should the Company be unable to continue operations. The ability of the Company to continue as a going concern depends upon its ability to develop profitable operations and to continue to raise adequate financing. Management is actively targeting sources of additional financing, including through the issuance of equity securities and the arrangement of debt facilities, and project-level financing structures which would assure continuation of the Company’s operations, exploration and development programs. The Company may seek to secure debt financing in the form of credit facilities, convertible notes, or other debt instruments. In order for the Company to meet its liabilities as they come due and to continue its operations, the Company is solely dependent upon its ability to generate such financing. Although the Company has been successful in the past in generating financing, there is no assurance it will be able to do so in the future, nor is there any assurance that the terms of any debt or project financing obtained will be favourable to the Company. These items give rise to material uncertainties that cast substantial doubt as to the Company’s ability to continue as a going concern.
22
4.1.30Reporting Issuer Status
The Company is subject to reporting requirements under applicable securities law, the listing requirements of the TSXV and NYSE American and other applicable securities rules and regulations. Compliance with these requirements can increase legal and financial compliance costs, make some activities more difficult, time-consuming or costly, and increase demand on existing systems and resources. Among other things, the Company is required to file annual, quarterly and current reports with respect to its business and results of operations and maintain effective disclosure controls and procedures and internal controls over financial reporting. In order to maintain and, if required, improve disclosure controls and procedures and internal controls over financial reporting to meet this standard, significant resources and management oversight is required. As a result, management’s attention may be diverted from other business concerns, which could harm the Company’s business and results of operations. The Company may need to hire additional employees to comply with these requirements in the future, which would increase its costs and expenses.
Failure to comply with these requirements can have numerous adverse consequences including, but not limited to, the Company’s inability to file required periodic reports on a timely basis, loss of market confidence, delisting of its securities and/or governmental or private actions against the Company. There can be no assurance that the Company will be able to comply with all of these requirements or that the cost of such compliance will not prove to be a substantial competitive disadvantage vis-à-vis privately-held and larger public competitors.
4.1.31Risks Associated with Acquisitions
If appropriate opportunities present themselves, the Company may acquire mineral claims, material interests in other mineral claims, and companies that the Company believes are strategic. The Company currently has no understandings, commitments or agreements with respect to any material acquisition, other than as described in this AIF, and no other material acquisition is currently being pursued. There can be no assurance that the Company will be able to identify, negotiate or finance future acquisitions successfully, or to integrate such acquisitions with its current business. The process of integrating an acquired Company or mineral claims into the Company may result in unforeseen operating difficulties and expenditures and may absorb significant management attention that would otherwise be available for ongoing development of the Company’s business. Future acquisitions could result in potentially dilutive issuances of equity securities, the incurrence of debt, contingent liabilities, and/or amortization expenses related to goodwill and other intangible assets, which could materially adversely affect the Company’s business, results of operations and financial condition.
4.1.32Force Majeure
The Company’s projects now or in the future may be adversely affected by risks outside the control of the Company, including the price of gold on world markets, labour unrest, civil disorder, war, subversive activities or sabotage, fires, floods, explosions, or other catastrophes, pandemics, epidemics, or quarantine restrictions.
4.1.33Infrastructure
Exploration, development and processing activities depend, to one degree or another, on adequate infrastructure. Reliable roads, bridges, power sources and water supply are important elements of infrastructure, which affect access, capital and operating costs. The lack of availability on acceptable terms or the delay in the availability of any one or more of these items could prevent or delay exploration or development of the Company’s mineral properties. If adequate infrastructure is not available in a timely manner, there can be no assurance that the exploration or development of the Company’s mineral properties will be commenced or completed on a timely basis, if at all.
Furthermore, unusual or infrequent weather phenomena, sabotage, government or other interference in the maintenance or provision of necessary infrastructure could adversely affect our operations.
23
Exploration operations depend on adequate infrastructure. In particular, reliable power sources, water supply, transportation and surface facilities are necessary to explore and develop mineral projects. Failure to adequately meet these infrastructure requirements or changes in the cost of such requirements could affect the Company’s ability to carry out exploration and future development operations and could have a material adverse effect on the Company’s business, financial condition, results of operations, cash flows, or prospects.
4.1.34Climate Change Risks
The Company acknowledges climate change as an international and community concern and it supports and endorses various initiatives for voluntary actions consistent with international initiatives on climate change. However, in addition to voluntary actions, governments are moving to introduce climate change legislation and treaties at the international, national, state/provincial, and local levels. Where legislation already exists, regulation relating to emission levels and energy efficiency is becoming more stringent. Some of the costs associated with reducing emissions can be offset by increased energy efficiency and technological innovation. However, if the current regulatory trend continues, the Company expects that this could result in increased costs at some of its operations in the future.
The Company and the mining industry are facing continued geotechnical challenges, which could adversely impact the Company’s production and profitability. Unanticipated adverse geotechnical and hydrological conditions, such as landslides, floods, seismic activity, droughts, and pit wall failures, may occur in the future and such events may not be detected in advance. Geotechnical instabilities and adverse climatic conditions can be difficult to predict and are often affected by risks and hazards outside of the Company’s control, such as severe weather and considerable rainfall. Geotechnical failures could result in limited or restricted access to mine sites, suspension of operations, government investigations, increased monitoring costs, remediation costs, loss of ore, and other impacts, which could cause one or more of the Company’s projects to be less profitable than currently anticipated and could result in a material adverse effect on the Company’s business results of operations and financial position.
4.1.35Information Systems and Cyber Security
The Company’s operations depend on information technology (“IT”) systems. These IT systems could be subject to network disruptions caused by a variety of sources, including computer viruses, security breaches and cyber-attacks, as well as disruptions resulting from incidents such as cable cuts, damage to physical plants, natural disasters, terrorism, fire, power loss, vandalism, and theft.
The Company’s operations also depend on the timely maintenance, upgrade and replacement of networks, equipment, IT systems and software, as well as pre-emptive expenses to mitigate the risks of failures. Any of these and other events could result in information system failures, delays and/or increase in capital expenses. The failure of information systems or a component of information systems could, depending on the nature of any such failure, adversely impact the Company’s reputation and results of operations.
Although to date the Company has not experienced any material losses relating to cyber-attacks or other information security breaches, there can be no assurance that the Company will not incur such losses in the future. The Company’s risk and exposure to these matters cannot be fully mitigated because of, among other things, the evolving nature of these threats. As a result, cyber security and the continued development and enhancement of controls, processes and practices designed to protect systems, computers, software, data, and networks from attack, damage or unauthorized access remain a priority. As cyber threats continue to evolve, the Company may be required to expend additional resources to continue to modify or enhance protective measures or to investigate and remediate any security vulnerabilities.
24
4.2Risks Related to the Company’s Securities
4.2.1Speculative Nature of Investment Risk
An investment in the Company’s securities carries a high degree of risk and should be considered as a speculative investment. The Company has no history of earnings, limited cash reserves, a limited operating history, has not paid dividends, and is unlikely to pay dividends in the immediate or near future. The likelihood of success of the Company must be considered in light of the problems, expenses, difficulties, complications and delays frequently encountered in connection with the establishment of any business. An investment in the Company’s securities may result in the loss of an investor’s entire investment. Only potential investors who are experienced in high-risk investments and who can afford to lose their entire investment should consider an investment in the Company.
4.2.2Price may not Represent the Company’s Performance or Intrinsic Fair Value
The market price of a publicly-traded stock is affected by many variables not directly related to the corporate performance of the Company, including the market in which it is traded, the strength of the economy generally, the availability of the attractiveness of alternative investments, and the breadth of the public market for the stock. The effect of these and other factors on the market price of the Common Shares on the TSXV and the NYSE American in the future cannot be predicted.
4.2.3Securities or Industry Analysts
The trading market for the Common Shares could be influenced by research and reports that industry and/or securities analysts may publish about the Company, its business, the market, or its competitors. The Company does not have any control over these analysts and cannot assure that such analysts will cover the Company or provide favourable coverage. If any of the analysts who may cover the Company’s business change their recommendation regarding the Company’s stock adversely, or provide more favourable relative recommendations about its competitors, the stock price would likely decline. If any analysts who may cover the Company’s business were to cease coverage or fail to regularly publish reports on the Company, it could lose visibility in the financial markets, which in turn could cause the stock price or trading volume to decline.
4.2.4Price Volatility of Publicly Traded Securities
The Common Shares are listed on the TSXV and NYSE American. Securities of mineral exploration and development companies have experienced substantial volatility in the past, often based on factors unrelated to the companies’ financial performance or prospects. These factors include macroeconomic developments in North America and globally and market perceptions of the attractiveness of particular industries.
The price of the Common Shares is also likely to be significantly affected by short-term changes in gold or other mineral prices or in the Company’s financial condition or results of operations. Other factors unrelated to the Company’s performance that may affect the price of the Common Shares include the following: the extent of analytical coverage available to investors concerning the Company’s business may be limited if investment banks with research capabilities do not follow the Company; lessening in trading volume and general market interest in the Common Shares may affect an investor’s ability to trade significant numbers of Common Shares; the size of the Company’s public float may limit the ability of some institutions to invest in the Common Shares; and a substantial decline in the price of the Common Shares that persists for a significant period of time could cause the Common Shares to be delisted from such exchange, further reducing market liquidity. As a result of any of these factors, the market price of the Common Shares at any given point in time may not accurately reflect the Company’s long-term value. Securities class action litigation often has been brought against companies following periods of volatility in the market price of their securities. New Found Gold may in the future be the target of similar litigation. Securities litigation could result in substantial costs and damages and divert management’s attention and resources.
25
The market price of the Common Shares is affected by many other variables which are not directly related to the Company’s success and are, therefore, not within New Found Gold’s control. These include other developments that affect the market for all resource sector securities, the breadth of the public market for the Company’s Common Shares, the effect of the dual-listing of the Common Shares including the ability to buy and sell Common Shares in two places, different market conditions in different capital markets, different prevailing trading prices, and the attractiveness of alternative investments. The effect of these and other factors on the market price of the Common Shares is expected to make the price of the Common Shares volatile in the future, which may result in losses to investors.
4.2.5Dilution
Future sales or issuances of equity securities could decrease the value of the Common Shares, dilute shareholders’ voting power and reduce future potential earnings per Common Share. New Found Gold may sell additional equity securities in future offerings (including through the sale of securities convertible into Common Shares) and may issue additional equity securities to finance the Company’s operations, development, exploration, acquisitions or other projects. New Found Gold cannot predict the size of future sales and issuances of equity securities or the effect, if any, that future sales and issuances of equity securities will have on the market price of the Common Shares. Common Share sales or issuances of a substantial number of equity securities, or the perception that such sales could occur, may adversely affect prevailing market prices for the Common Shares. With any additional sale or issuance of equity securities, investors will suffer dilution of their voting power and may experience dilution in the Company’s earnings per Common Share.
4.2.6Dividends
To date, the Company has not paid any dividends on the outstanding Common Shares. Any decision to pay dividends on the Common Shares of the Company will be made by the Board on the basis of the Company’s earnings, financial requirements and other conditions. See “Dividends and Distributions”.
4.2.7Exchange Listings
The Company may fail to meet the continued listing requirements for the Common Shares to be listed on the TSXV and/or the NYSE American. If the TSXV or the NYSE American, as applicable, delists the Common Shares from trading on its respective exchange, the Company could face significant material adverse consequences, including: a limited availability of market quotations for the Common Shares; a determination the Common Shares are a “penny stock” which will require brokers trading in the Common Shares to follow more stringent rules and possibly resulting in a reduced level of trading activity in the secondary market for the Common Shares; a limited amount of news and analysts coverage for the Company; and a decreased ability to issue additional securities or obtain additional financing in the future.
4.2.8The Sarbanes-Oxley Act
The Company may fail to maintain adequate internal control over financial reporting pursuant to the requirements of the Sarbanes-Oxley Act (“SOX”). Management has documented and tested its internal control procedures in order to satisfy the requirements of Section 404 of the SOX. The SOX requires an annual assessment by management of the effectiveness of the Company’s internal control over financial reporting. The Company may fail to maintain the adequacy of its internal control over financial reporting as such standards are modified, supplemented or amended from time to time, and the Company may not be able to conclude, on an ongoing basis, that it has effective internal control over financial reporting in accordance with Section 404 of the SOX. The Company’s failure to satisfy the requirements of Section 404 of the SOX on an ongoing, timely basis could result in the loss of investor confidence in the reliability of its financial statements, which in turn could harm the Company’s business and negatively impact the trading price or the market value of its securities. In addition, any failure to implement required new or improved controls, or difficulties encountered in their implementation, could harm the Company’s operating results or cause it to fail to meet its reporting obligations. If the Company expands, the challenges involved in
26
implementing appropriate internal control over financial reporting will increase and will require that the Company continues to monitor its internal control over financial reporting. Although the Company intends to expend time and incur costs, as necessary, to ensure ongoing compliance, it cannot be certain that it will be successful in complying with Section 404 of the SOX.
4.2.9U.S. Federal Income Tax
The Company may be a “passive foreign investment company” (“PFIC”), which may have adverse U.S. federal income tax consequences for U.S. investors. U.S. investors should be aware that they could be subject to certain adverse U.S. federal income tax consequences in the event that we are classified as a “passive foreign investment company” for U.S. federal income tax purposes. The determination of whether we are a PFIC for a taxable year depends, in part, on the application of complex U.S. federal income tax rules, which are subject to differing interpretations, and the determination will depend on the composition of our income, expenses and assets from time to time and the nature of the activities performed by our officers and employees. Prospective investors should carefully read the tax discussion in any applicable prospectus for more information and consult their own tax advisers regarding the likelihood and consequences of the Company being treated as a PFIC for U.S. federal income tax purposes, including the advisability of making certain elections that may mitigate certain possible adverse U.S. federal income tax consequences but may result in an inclusion in gross income without receipt of such income.
4.2.10Foreign Private Issuer
The Company is a foreign private issuer under applicable U.S. federal securities laws and, therefore, is not required to comply with all of the periodic disclosure and current reporting requirements of the Exchange Act and related rules and regulations. As a result, the Company does not file the same reports that a U.S. domestic issuer would file with the SEC, although it will be required to file with or furnish to the SEC the continuous disclosure documents that the Company is required to file in Canada under Canadian securities laws. In addition, the Company’s officers, directors and principal shareholders are exempt from the reporting and “short swing” profit recovery provisions of Section 16 of the Exchange Act. Therefore, the Company’s securityholders may not know on as timely a basis when its officers, directors and principal shareholders purchase or sell securities of the Company as the reporting periods under the corresponding Canadian insider reporting requirements are longer. In addition, as a foreign private issuer, the Company is exempt from the proxy rules under the Exchange Act. We are also exempt from Regulation FD, which prohibits issuers from making selective disclosures of material non-public information. While we expect to comply with the corresponding requirements relating to proxy statements and disclosure of material non-public information under Canadian securities laws, these requirements differ from those under the Exchange Act and Regulation FD and shareholders should not expect to receive in every case the same information at the same time as such information is provided by U.S. domestic companies.
4.2.11Foreign Private Issuer Status
In order to maintain its current status as a foreign private issuer, 50% or more of the Company’s Common Shares must be directly or indirectly owned of record by non-residents of the United States unless the Company also satisfies one of the additional requirements necessary to preserve this status. The Company may in the future lose its foreign private issuer status if a majority of the Common Shares are owned of record in the United States and the Company fails to meet the additional requirements necessary to avoid loss of foreign private issuer status. The regulatory and compliance costs to the Company under U.S. federal securities laws as a U.S. domestic issuer may be significantly more than the costs the Company incurs as a Canadian foreign private issuer eligible to use the multijurisdictional disclosure system (“MJDS”). If the Company is not a foreign private issuer, it would not be eligible to use the MJDS or other foreign issuer forms and would be required to file periodic and current reports and registration statements on U.S. domestic issuer forms with the SEC, which are more detailed and extensive than the forms available to a foreign private issuer.
27
4.2.12Enforcing Judgments in U.S. Courts
As the Company is a Canadian corporation and most of its directors and officers reside in Canada, it may be difficult or impossible for investors in the United States to effect service or to realize on judgments obtained in the United States predicated upon the civil liability provisions of the U.S. federal securities laws. A judgment of a U.S. court predicated solely upon such civil liabilities may be enforceable in Canada by a Canadian court if the U.S. court in which the judgment was obtained had jurisdiction, as determined by the Canadian court, in the matter. Investors should not assume that Canadian courts: (i) would enforce judgments of U.S. courts obtained in actions against the Company or such persons predicated upon the civil liability provisions of the U.S. federal securities laws or the securities or blue-sky laws of any state within the United States, or (ii) would enforce, in original actions, liabilities against the Company or such persons predicated upon the U.S. federal securities laws or any such state securities or blue-sky laws. Similarly, some of the Company’s directors and officers are residents of countries other than Canada and all or a substantial portion of the assets of such persons are located outside Canada. As a result, it may be difficult or impossible for Canadian investors to initiate a lawsuit within Canada against these persons. In addition, it may not be possible for Canadian investors to collect from these persons judgments obtained in courts in Canada predicated on the civil liability provisions of securities legislation of certain of the provinces and territories of Canada. It may also be difficult or impossible for Canadian investors to succeed in a lawsuit in the United States based solely on violations of Canadian securities law.
New Found Gold commissioned SLR Consulting to prepare the Queensway Technical Report in compliance with NI 43-101 for its 100% owned Queensway Gold Project, located near Gander, Newfoundland and Labrador, Canada. The Queensway Technical Report documents all data and data collection procedures for the Queensway Gold Project up until June 30, 2025. The Queensway Technical Report is titled “NI 43-101 Technical Report, Queensway Gold Project, Newfoundland and Labrador, Canada.” The Queensway Technical Report was filed on September 2, 2025 and has an effective date of June 30, 2025 (the “Queensway Technical Report Effective Date”).
The Qualified Persons for the Queensway Technical Report are Pierre Landry, P.Geo., Lance Engelbrecht, P. Eng. and David M. Robson, P.Eng. of SLR Consulting and Sheldon H. Smith, P.Geo. of Stantec (each, a “Qualified Person” or “QP”). All authors are Qualified Persons as defined in NI 43-101 and are “independent” of New Found Gold and the Queensway Gold Project as defined in NI 43-101. Mr. Robson takes responsibility for overall preparation of the Queensway Technical Report, as well as Sections 2, 3, 12.3, 14.3, 15, 16, 18, 19, 21, 22, 24, and related disclosure in Sections 1, 25, 26, and 27. Mr. Landry takes responsibility for the preparation of sections 4 to 12.2, 14 (exclusive of 14.3), 23, and related disclosure in Sections 1, 25, 26, and 27 of the Queensway Technical Report. Mr. Engelbrecht takes responsibility for the preparation of Section 12.4, 13, 17, and related disclosure in Sections 1, 25, 26, and 27 of the Queensway Technical Report. Mr. Smith takes responsibility for the preparation of Section 12.5, 20 and related disclosure in Sections 1, 25, 26, and 27 of the Queensway Technical Report. Mr. Landry and Mr. Robson, each of SLR Consulting, visited the Queensway Gold Project on October 24 and 25, 2024. Mr. Smith of Stantec visited the Queensway Gold Project on March 18, 2025. Mr. Robson visited a prospective toll milling facility on May 12, 2025.
The scientific and technical information in this section relating to the Queensway Gold Project is derived from, and in some instances is a direct extract from, and is based on the assumptions, qualifications and procedures set out in, the Queensway Technical Report. Such assumptions, qualifications and procedures are not fully described in this section and the following summary does not purport to be a complete summary of the Queensway Technical Report. Reference should be made to the full text of the Queensway Technical Report, which is available for review under New Found Gold’s profile on SEDAR+ at www.sedarplus.ca and on EDGAR at www.sec.gov. Capitalized terms used but not otherwise defined in this section have the meanings given to such terms in the Queensway Technical Report.
28
The technical content disclosed in this section was reviewed and approved by the authors of the Queensway Technical Report, each a Qualified Person as defined in NI 43-101.
5.2Property Description, Location and Access
The Queensway Gold Project consists of 7,018 claims across 98 mineral licences, covering a total area of 175,450 ha. It includes three main Mineral Resource areas: AFZ Core, AFZ Peripheral, and Joe Batt’s Pond (“JBP”). AFZ Core hosts several key gold (“Au”) zones, including Keats, Iceberg, Keats West, Lotto, Golden Joint, K2, etc. AFZ Peripheral contains the Big Vein, Pristine, HM, and Midway zones, while JBP features the H Pond, 1744, and Pocket Pond zones. The distance from AFZ Core to AFZ Peripheral is approximately 7.5 kilometres (“km”), and from AFZ Core to JBP, approximately 5.5 km. The Queensway Gold Project is in an advanced exploration stage.
The Queensway Gold Project is located on the northeast portion of the Island of Newfoundland, Newfoundland and Labrador, along the east coast of Canada (Figure 1). The Queensway Gold Project is located approximately 15 km west of the Town of Gander, NL and can be accessed from Gander via the Trans-Canada Highway (“TCH”), which passes through the Queensway North (“QWN”) and Twin Ponds claim areas. The approximate centre of the Queensway Gold Project is UTM, Zone 21N, NAD83: 645000 m Easting, 5402000 m Northing.
The TCH provides road access across all of Newfoundland with an east-west distance of 928 km. The TCH passes through eight licenses in the QWN block and one license in the Twin Ponds block.
The Queensway Gold Project can also be accessed by the Northwest Gander River Road, which runs on the west portion of the Queensway South (“QWS”) claims area from Gander Lake and crosses the river into the QWS claims. About halfway, at the steel bridge, approximately 15 km south of Gander Lake, additional access roads lead into the south Gander Lake area. Within the claims areas, most of the Queensway Gold Project is accessible via gravel access roads, including the AFZ road, the H Pond Road to areas along the JBP Fault Zone (“JBPFZ”), and the JBP Road on the eastern margin of QWN in the cottage area. Many quad/harvester trails and winter roads provide excellent access for heavy equipment when required.
The areas in the far south of the QWS area are best reached by four wheel drive trucks and all-terrain vehicles (“ATV”) along resource roads that begin at the Bay d’Espoir Highway (Route 360), which spurs off the TCH at the Town of Bishop’s Falls, NL.
In addition to road and ATV access, the mineral licenses along the shores of Gander Lake can easily be accessed by boat. The Queensway Gold Project can also be accessed by helicopter from the Newfoundland Helicopters base in the Town of Appleton and via Gander International Airport and from small craft float planes based near the international airport in Gander.
The nearest seaports are north of the TCH at the towns of Lewisporte and Botwood which are approximately 40 km and 70 km, respectively, by road from the town of Glenwood. Both port locations have excellent harbour facilities and capabilities.
The Town of Gander is located 15 km to the east of the QWN claims along the TCH. Gander has typical amenities for a major city: an international airport and most of the equipment and supplies required for industrial operations. The people of Gander are also a source for much of the labour required for New Found Gold’s exploration programs and future operations.
29
The small town of Appleton, located within the QWN claim area, hosts a helicopter base and an environmental remediation company. In the Appleton Industrial Park, New Found Gold has purchased lots that host a fenced-in core yard, an office trailer and shipping containers for storage of sample pulps.
Electricity is available from the NL provincial grid, which has three electricity transmission corridors that cross the Queensway Gold Project lands.
30
Figure 1: Six Sub-properties of the Queensway Gold Project
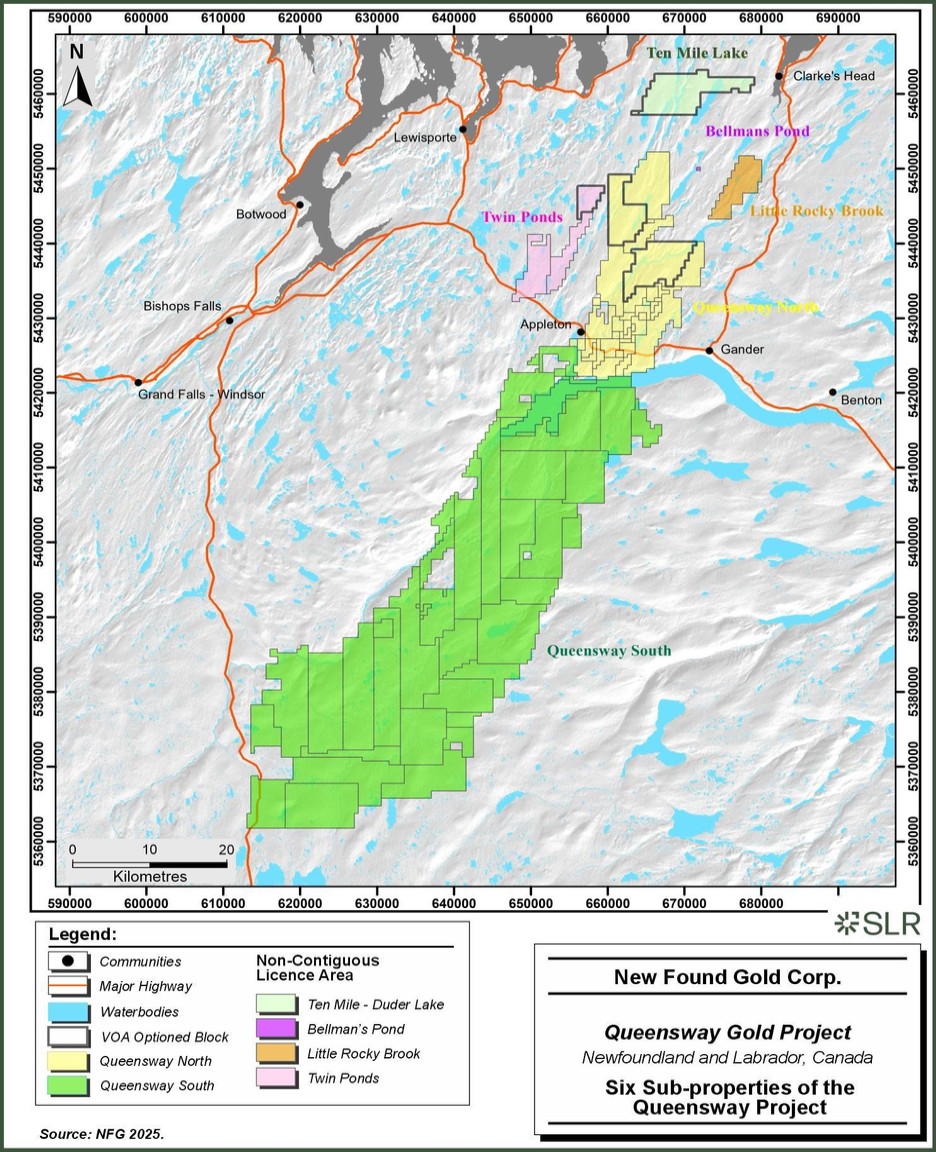
31
5.2.1Land Tenure
The Queensway Gold Project is defined by 98 mineral licences that comprise 7,018 claims, with each claim having an area of 25 ha (500 m x 500 m). In total, the Queensway Gold Project encompasses an area of 175,450 ha (1,755 km2). The licences can be separated spatially into groups, or blocks, based on their contiguous groupings. The blocks have no specific administrative or legal significance but are helpful in presenting and explaining a variety of exploration activities over a very large area. The blocks include:
Two large contiguous blocks, QWN and QWS, separated by Gander Lake:
| ● | QWN consists of 42 contiguous mineral licences (1,127 claims) and is situated north of Gander Lake. |
| ● | QWS consists of 49 contiguous mineral licences (5,339 claims) and is situated south and west of Gander Lake. |
Four smaller blocks of single or multiple contiguous groups of licences (Twin Ponds, Ten Mile-Duder Lake, Bellman’s Pond, and Little Rocky Brook):
| ● | Twin Ponds block consists of three contiguous mineral licences (226 claims) for a total area of 5,650 ha, and is situated west of the Gander River. |
| ● | Ten Mile-Duder Lake block consists of two contiguous mineral licences (211 claims), for a total area of 5,275 ha, situated west of the Gander River. |
| ● | Bellman’s Pond block consists of one mineral licence (one claim) with an area of 25 ha and is situated west of the Gander River. |
| ● | Little Rocky Brook block consists of one mineral licence (114 contiguous claims), for an area of 2,850 ha and is situated west of the Gander River. |
A total of 92.2% of the claims are owned by New Found Gold, with the remaining 7.8% owned by separate licence holders and are subject to a single option agreement (the “VOA Option Agreement”) between New Found Gold and the current property owners (Aidan O’Neil, Suraj Amarnani, and Josh Vann).
Following the many changes in claim ownership, Palisade Resources Corp. (“Palisade”), later renamed to New Found Gold Corp. in June 2017, began to consolidate the large land package that now forms the Queensway Gold Project.
The licences were acquired through 1) online map staking with the Government of NL, 2) the successful completion of a series of Option Agreements, and 3) some of the licences were originally acquired by Palisade, New Found Gold’s predecessor.
On July 9, 2024, New Found Gold acquired a 100% interest in LabGold’s Kingsway Project. Pursuant to the acquisition, New Found Gold issued to LabGold 5,263,157 Common Shares as consideration.
On May 17, 2024, New Found Gold acquired a 100% interest in three mineral licences previously held by Sky Gold. Pursuant to the acquisition, New Found Gold purchased the licences for $35,000.
In addition, five licences are currently owned by separate licence holders and are subject to New Found Gold satisfying conditions of the VOA Option Agreement between New Found Gold and the current property owners (Aidan O’Neil, Suraj Amarnani, and Josh Vann).
32
The ownership for each of the four groups is further summarized as follows:
| ● | 92.2% of the claims that make up the Queensway Gold Project are fully owned by New Found Gold. They consist of 6,473 claims within 98 mineral licences in QWN, QWS, Twin Ponds, Bellman’s Pond, and Little Rocky Brook. |
| ● | 4.83% of the claims as part of the VOA Option Agreement are owned by Aidan O’Neil. They consist of 339 claims within two mineral licences at Ten Mile-Duder Lake and QWN. |
| ● | 2.99% of the claims as part of the VOA Option Agreement are owned by Suraj Amarnani. They consist of 210 claims within two mineral licences at Twin Ponds and QWN. |
| ● | 0.03% of the claims as part of the VOA Option Agreement are owned by Josh Vann. They consist of two claims within one mineral licence at Ten Mile-Duder Lake. |
5.2.2Mineral Tenure Information and Maintenance
Mineral rights in NL are managed by the Mineral Lands Division of the Department of Industry, Energy, and Technology (“IET”), which coordinates map-staking of Crown mineral licences through the online Mineral Lands Administration Portal. Within the area of a mineral licence, there are separate mineral claims, up to 256 coterminous claims per licence area.
With respect to mineral licence maintenance in NL, New Found Gold must abide by two financial obligations to maintain the licences in good standing:
1. | Minimum expenditures for ongoing assessment, in which the province requires licence-holders to spend a minimum amount on their exploration activities each year. These minimum expenditure commitments increase with time, as summarized in Table 1. |
New Found Gold’s remaining minimum exploration expenditure obligation for the entire Queensway Gold Project as of March 31, 2025 is $228,397.03 with $1,589,256.57 in 2026. With the current drilling program plans scheduled to continue throughout 2025, and with ongoing surface reconnaissance and mapping activities, the money New Found Gold spends on exploration will exceed the required minimum in 2025.
In each year of a mineral licence being issued, the minimum annual assessment work must be completed by the anniversary, unless there are excess exploration expenditures reported. After an expenditures due date, an assessment report must be submitted within 60 days of the anniversary date. Excess assessment work expenditures are credited to the licence and can be carried forward to satisfy the expenditure requirements in future years except for the transition to Year 20 when all expenditures are defaulted to Year 20 dues.
Any mineral licence holder who intends to conduct an exploration program must obtain mineral exploration approval (“MEA”) from the IET before the activity can commence.
2. | Licence renewal fees are required every five years to Year 20 and every year after that, if kept in good standing. The renewal date for each licence is determined by the original staking date of the mineral claims. Mineral licence renewal fees in NL are structured based on the age of the licence. Mineral licence renewal date is distinct from the anniversary date, which governs annual exploration expenditures and assessment work. |
Table 2 shows the renewal fee per claim for each of the five-year intervals. These fees are due every five years from Year 5 through Year 20, and then annually from Year 21 onward. New Found Gold’s annual renewal fees for the licences that reach their renewal date in 2025 are $80,175.
33
Table 1: Minimum Expenditures for Mineral Claims in Newfoundland and Labrador
Year | | Required Expenditure | |
|---|---|---|---|
1 | | $ | 200.00/Claim |
2 | | $ | 250.00/Claim |
3 | | $ | 300.00/Claim |
4 | | $ | 350.00/Claim |
5 | | $ | 400.00/Claim |
6 to 10 | | $ | 600.00/Claim |
11 to 15 | | $ | 900.00/Claim |
16 to 20 | | $ | 1,200.00/Claim |
21 to 25 | | $ | 2,000.00/Claim |
26 to 30 | | $ | 2,500.00/Claim |
31 Onward | | $ | 3,000.00/Claim |
Table 2: Renewal Fees for Mineral Claims in Newfoundland and Labrador
Year | | Renewal Fee | |
5 | | $ | 25.00/Claim |
10 | | $ | 50.00/Claim |
15 | | $ | 100.00/Claim |
20 Onward | | $ | 200.00/Claim |
5.2.3Access and Surface Rights
Title to surface rights in Newfoundland is required only for the development of a mineral resource under a mining lease. For exploration activities, including both non-ground-disturbing and ground-disturbing work, licence holders must obtain an MEA and/or a letter of acceptance from the NL Department of Industry, Energy and Technology for all valid mineral licence(s) to be explored under the proposed program. These approvals regulate land use and environmental compliance but do not confer ownership of surface rights.
New Found Gold does not own surface rights on the Queensway Gold Project except for the Core Yard at Appleton. On an as-needed basis, New Found Gold negotiates agreements that allow exploration activities to be conducted on property owned and administered by others:
| ● | The Province of Newfoundland and Labrador, which administers Crown Lands, |
| ● | The municipalities of Appleton and Glenwood, |
| ● | Property owners of residential properties in Appleton and Glenwood and of cottages and cabins, granted or licence to occupy, outside municipal boundaries. |
In addition to stipulating the times when New Found Gold can conduct work, and the nature of the work that is permitted, these agreements also specify New Found Gold’s responsibility for restoring land to an acceptable condition following field activities.
For exploration activities on Crown Lands, approval is required from the Mineral Lands Division of the IET. The primary focus of these applications and approvals is to prevent or minimize adverse impacts on the environment, fish, and wildlife.
If the Queensway Gold Project advances to the mine production stage, New Found Gold would need to obtain surface rights by applying for a surface lease to the IET, accompanied by a legal survey. Surface leases are issued by the IET in consultation with the Minister appointed to administer the Lands Act.
34
To the best of the SLR Consulting QP’s knowledge, there are no significant factors, or risks that may affect access, or the right or ability of New Found Gold to perform exploration work on the Queensway Gold Project.
5.2.4VOA Option Agreement
On November 2, 2022, New Found Gold executed the VOA Option Agreement with Aidan O’Neil, Suraj Amarnani, Josh Vann, and VOA Exploration Inc. (collectively referred to as the “Optionors”). The VOA Option Agreement grants New Found Gold exclusive right and option to acquire a 100% title and interest in a property defined by five mineral licences: 035047M and 035197M, 035048M and 035198M, and 035050M, owned by Aidan O’Neil, Suraj Amarnani, and Josh Vann respectively (the “VOA Option”). The claims included in these five mineral licences represent 7.8% of the Queensway Gold Project claims.
In connection with the grant of the VOA Option, New Found Gold shall have the right to enter onto and occupy the optioned property to conduct activities as contemplated in the VOA Option Agreement.
For New Found Gold to exercise the VOA Option, New Found Gold shall 1) issue an aggregate of 487,078 Common Shares (the “Share Issuances”) and 2) make aggregate cash payments of $2,350,000 (the “Cash Payments”) to the Optionors as follows:
| ● | $300,000 and 89,463 Common Shares on or before November 2, 2025. |
| ● | $600,000 and 129,224 Common Shares on or before November 2, 2026. |
| ● | $800,000 and 119,284 Common Shares on or before November 2, 2027. |
New Found Gold has already made cash payments and made Share Issuances pursuant to the VOA Option as follows:
| ● | New Found Gold has paid $200,000 and issued 39,762 Common Shares upon on the later of (i) Staking Confirmation Date (as defined in the VOA Option Agreement) and (ii) the receipt of the TSXV approval. |
| ● | New Found Gold has paid $200,000 and issued 39,762 Common Shares prior to or on the deadline of November 2, 2023. |
| ● | New Found Gold has paid $250,000 and issued 69,583 Common Shares prior to or on the deadline of November 2, 2024. |
New Found Gold shall pay all Cash Payments and register all Common Shares issued under the VOA Option Agreement to VOA Exploration Inc. unless otherwise instructed in writing by the Optionors. VOA Exploration Inc. is the consortium of Vann, O’Neil, and Amarnani.
Upon New Found Gold completing the Cash Payments and the Share Issuances set forth above, New Found Gold will immediately be deemed to have exercised the VOA Option and acquired a 100% interest in the property free and clear of all encumbrances with no further action required by it resulting in the Optionors’ interest in the property being immediately transferred to New Found Gold. The terms of the VOA Option Agreement do not include any mandatory work commitments, advanced royalty payments, or granting of royalties.
5.2.5Royalties
Seventy-three of the 98 Queensway Gold Project mineral licences (74%) are currently subject to a net smelter returns (“NSR”) royalty; the other 25 licences are not subject to any royalty. Some royalties were
35
formed within agreements between New Found Gold and the various individuals and companies that optioned their mineral rights to New Found Gold in return for financial compensation that included NSR royalties. Others arise from financing provided by GoldSpot Discoveries Corp. (“GoldSpot”) in 2019. All claims acquired after the New Found Gold-GoldSpot Agreement execution date and contiguous to the New Found Gold-GoldSpot Agreement original claims are subject to a 1% NSR royalty to GoldSpot less royalties at the time of acquisition. Currently, the NSR royalties range from 0.4% to 3.0% for the 78 licences subject to an NSR royalty.
Royalties associated with the New Found Gold-LabGold Purchase Agreement state that mineral licences 027636M, 207637M, and 035204M are subject to a 1% NSR royalty plus $1 per ounce of gold in the ‘indicated mineral resource’ and ‘measured mineral resource’ categories, as defined by Canadian Institute of Mining, Metallurgy and Petroleum CIM Definition Standards for Mineral Resources and Mineral reserves (“CIM (2014) definitions”). In addition, an advance royalty of $50,000 per annum will be payable, at the election of the Royalty Holder (as defined therein), in cash or common shares, commencing on March 3, 2026, and continuing each year thereafter until commencement of commercial production.
Many of New Found Gold’s option and financing agreements have included a buyback provision that allows New Found Gold to reduce the NSR royalty by making a lump sum payment to the holder of the royalty. For example, on November 15, 2021, New Found Gold announced that it had exercised its buyback option and entered into three royalty purchase agreements to acquire a total of 0.6% NSR related to the Linear and JBP Linear Properties. These royalties, originally granted under a 2016 agreement, cover key areas of the Queensway Gold Project, including the Keats, Golden Joint, and Lotto discoveries. Following the transaction, a 0.4% NSR royalty remains on the Keats-Golden Joint-Lotto-Big Dave corridor. Were New Found Gold to exercise all of its buyback rights, the NSR royalties would range between 0.5% and 1.0% for the 28 licences that are subject to an NSR royalty.
The SLR Consulting QP is not aware of any environmental liabilities or other restrictions to New Found Gold’s exploration activities, outside the established 300 m Gander Lake Buffer, wetland and watercourse buffers of 30 m to 100 m along Gander River and Gander Lake Tributaries. Exploration can generally be conducted year-round once the necessary approvals have been received from the Mineral Lands Division, Environment and Climate Change, and/or from the relevant municipal governments and individual property owners.
New Found Gold has no reason to assume that they will not obtain the necessary permits to advance the Queensway Gold Project, provided regulatory requirements continue to be met.
The extensive historical exploration of the Queensway Gold Project was completed by multiple operators and prospectors, spanning over four decades, from the 1980s through to early 2024. The exploration methods used include surface geochemical sampling, trenching, drilling, and airborne and ground geophysical surveys.
Surface geochemical sampling covers the widest geographical extent of the Queensway Gold Project, and amounts to approximately 3,500 till samples, over 600 stream and lake sediment samples, 6,500 rock samples, and over 27,000 soil samples. This extensive dataset has identified several gold-in-soil or gold-in-till anomalies that have led to surface gold discoveries.
A total of over 330 trenches have been historically completed across the Queensway Gold Project, targeting previously discovered gold-in-soil and gold-in-till anomalies. Over 1,600 channel samples were taken from trenches that reached bedrock.
A total of 16 companies completed 766 drill holes (totalling 133,181.1 m) over the history of the Queensway Gold Project. The majority were diamond drill holes, with a portion of holes completed using rotary air
36
blasting (“RAB”) and reverse circulation (“RC”) techniques. Much of the historical drilling occurred north of Gander Lake along the two principal fault zones: AFZ and JBPFZ.
Over 50 historical airborne and ground geophysical surveys have been conducted throughout the Queensway Gold Project; including very low frequency electromagnetic, electromagnetic, magnetic, induced polarization, versatile time domain electromagnetic and controlled source audio-frequency magnetotellurics. Most of the geographical extent of these geophysical surveys is concentrated along either the AFZ and JBPFZ, or in the QWS claims group around the Pauls Pond and Greenwood Pond gold showings.
Table 3: Summary of Historical Exploration Work Completed on the Queensway Gold Project
Years | Companies | Optionor/ | Location | Prospecting | Mapping | Rock | Geo- | Trench- | Drill- | Program Highlights |
|---|---|---|---|---|---|---|---|---|---|---|
1955-1956 | Newfoundland and Labrador Corporation | | Caribou Lake | | X | | X | | X | First documented exploration work |
1974 | Bison Petroleum & Minerals Ltd. | NALCO | Caribou Lake | | | | X | | X | |
1979-1981 | Hudson’s Bay Oil & Gas Company Limited | NALCO | Gander Lake | | X | | X | X | X | |
C. Reid | ||||||||||
1987-1991 | Falconbridge Ltd. | | SW Gander River | | | | | | | |
| X | X | X | | X | | ||||
Twin Ponds | | | | | | | | |||
JBPFZ | X | X | X | | X | X | | |||
1987- 1988 | Noranda | | Gander Lake Outflow | | | X | X | X | X | 5-28 ppm (outcrop samples); |
| | | | | | |||||
Appleton | ||||||||||
1988- 1990 | Noranda Exploration | | Twin Ponds | | | X | X | X | X | 2.45 ppm (pan concentrate); |
Big Pond | ||||||||||
Blue Peter | ||||||||||
1990- 1991 | Manor Resources | | Twin Ponds | X | | X | X | | X | 2 ppm (soil sample) |
1992- 1994 | Gander River Minerals | | AFZ | | | | X | X | X | 2.3 m © 14.8 ppm (drillhole) |
Noranda Exploration | ||||||||||
1995- 2004 | | L.L. Chan | Pauls Pond | X | | X | | | | 7.68 ppm (till) |
Greenwood Pond | ||||||||||
1997-1998 | | P. Crocker | AFZ | X | | X | | | | 153.4 ppm (grab sample) |
D. Barbour | ||||||||||
R. Churchill |
37
Years | Companies | Optionor/ | Location | Prospecting | Mapping | Rock | Geo- | Trench- | Drill- | Program Highlights |
|---|---|---|---|---|---|---|---|---|---|---|
1997-2001 | Altius Minerals | Forex Resources | Aztec Trend | X | | X | X | | | 2.1 ppm (grab sample) |
Cornerstone Resources | Greenwood Pond | |||||||||
| Pauls Pond | |||||||||
1998-2016 | Krinor Resources | A. & K. Keats | AFZ | X | | | | | | Discovery of Dome prospect |
P. Dimmell | ||||||||||
1999-2000 | United Carina | | AFX | X | | X | | X | X | Several drillhole intervals with gold grades above 10 ppm. |
7984M (AFZ) | ||||||||||
1999-2001 | Cornerstone Resources | | Pauls Pond | X | | X | X | | | 0.8 – 2.1 ppm (grab samples) |
2000- 2002 | | C. Reid | AFZ to JBPFX | X | | | | | | VG noted near Gander Lake |
7179M (AFZ) | ||||||||||
2000-2009 | | L. & E. Quinlan | AFZ | X | | X | | | | Discovered Lachlan prospect; |
JBPFZ | ||||||||||
2002 | Grayd Resources | Fortis GeoServices | Greenwood Pond | X | X | | X | X | | 10.9 ppm (grab sample) |
2002-2005 | Candente Resources | | Greenwood Pond | X | | | X | | X | >1,000 ppm (quartz boulders); |
Pauls Pond | ||||||||||
Goose Pond | ||||||||||
AFZ | | X | | | X | X | 0.4 m @ 7.2 ppm (drill hole); | |||
2002- 2005 | Crosshair Exploration and Mining | | Big Pond | X | X | X | | X | X | 40 – 50 ppm (trench samples) |
Dan’s Pond | ||||||||||
Pauls Pond | X | | X | X | X | X | 10 - 15 ppm (trench samples); | |||
2003- 2006 | Paragon Minerals | KriASK Syndicate | JBPFZ | X | | X | X | X | X | 1x0.5 m boulder with 798 ppm Au gives the 798 Zone its name; |
Rubicon Minerals | H-Pond | |||||||||
Pocket Pond | ||||||||||
2004-2005 | Spruce Ridge Resources | | Gander Lake | X | | X | | X | | 1.2 ppm (trench sample) |
Little Harbour | ||||||||||
2005-2014 | | R. & E. Quinlan | AFZ to JBPFZ | X | | X | | | | 18.7 ppm (grab sample); |
Quinlan Prospecting | 12652M (AFZ) |
38
Years | Companies | Optionor/ | Location | Prospecting | Mapping | Rock | Geo- | Trench- | Drill- | Program Highlights | |
|---|---|---|---|---|---|---|---|---|---|---|---|
2007- 2008 | Paragon Minerals | | AFZ | | | | | | X | Last drilling on AFZ pre-NFG; | |
Rubicon Minerals | |||||||||||
2007-2010 | | J. Sceviour | Pauls Pond | X | | X | | | | Surface float samples above 0.2 ppm | |
2011- 2012 | Soldi Ventures | | AFZ | | | | | | X | 5.4m @ 9.8 ppm (drill hole); | |
2011-2012 | Metals Creek Resources | | Gander Lake | X | | X | | X | | 59.4 ppm (grab sample); | |
2020-2021 | Sky Gold Corp. | | Mustang | | | X | | | X | | |
2020- 2024 | Labrador Gold Corp. | | Kingsway | X | X | X | X | X | X | 501 drill holes defining 9 gold prospects | |
Table 4: Summary of Historical Drilling at Queensway
Company | | Start Date | | End Date | | Total Length | | No. of Holes |
|---|---|---|---|---|---|---|---|---|
Newfoundland and Labrador Corporation (NALCO) | | 1955-12-12 | | 1956-02-26 | | 1,224.4 | | 9 |
Bison Petroleum & Minerals Ltd | | 1969-09-06 | | 1969-10-11 | | 831.8 | | 6 |
Hudson’s Bay Oil & Gas Company Limited | | 1980-08-10 | | 1980-09-18 | | 392.1 | | 7 |
Falconbridge Ltd | | 1987-09-23 | | 1987-10-19 | | 1,018.6 | | 12 |
Noranda Exploration Company Ltd | | 1987-12-11 | | 1990-11-08 | | 2,085.3 | | 24 |
Gander River Minerals | | 1991-03-06 | | 1994-02-14 | | 1,954.0 | | 18 |
Manor Resources Inc | | 1991-06-30 | | 1991-07-01 | | 50.3 | | 1 |
United Carina Resources | | 1999-10-22 | | 2000-03-08 | | 3,649.3 | | 38 |
VVC Exploration | | 2003-01-01 | | 2003-02-28 | | 1,486.3 | | 18 |
Camdenite Resources Corp | | 2003-02-14 | | 2004-10-09 | | 1,430.0 | | 9 |
Rubicon Minerals Corp | | 2004-06-10 | | 2005-03-19 | | 6,545.9 | | 42 |
Paragon Minerals Corp | | 2005-01-14 | | 2008-07-05 | | 5,677.0 | | 33 |
Crosshair Exploration & Mining | | 2005-05-12 | | 2005-05-28 | | 488.2 | | 6 |
Soldi Ventures | | 2011-11-16 | | 2012-02-10 | | 2,759.9 | | 23 |
Sky Gold Corp. | | 2020 | | 2021 | | 3,352.0 | | 19 |
Labrador Gold Corp. (rotary air blasting) | | 2020 | | 2022 | | 8,382.0 | | 154 |
Labrador Gold Corp. (reverse circulation) | | 2020 | | 2022 | | 434.0 | | 6 |
Labrador Gold Corp. (diamond drilling) | | 2021 | | 2024 | | 91,420.0 | | 341 |
Totals | | | | | | 133,181.1 | | 766 |
The QP is not aware of any MREs, whether compliant with current CIM Definition Standards and NI 43-101 requirements, historical, or non-compliant, having been prepared by previous operators.
There has been no production from the Queensway Gold Project.
5.4Geological Setting, Mineralization and Deposit Types
The Queensway Gold Project is situated in the northeastern Canadian portion of the Appalachian Orogen, which extends from Scandinavia in the north to Georgia, U.S., in the south.
39
The geology of the Queensway Gold Project constitutes a poly-deformed fold and thrust belt that overprints Cambrian continental shelf rocks, Ordovician ophiolitic and marine carbonate/siliciclastic rocks, Silurian shallow marine/terrestrial sequences, and Silurian magmatic rocks. The Appleton and JBP faults are major structures that transect the Queensway Gold Project and are spatially associated with epizonal gold mineralization.
Gold mineralization at the Queensway Gold Project has been identified in several gold zones in both the QWN and QWS blocks. In general, these gold zones are interpreted to be indicative of an orogenic epizonal gold system, and are characterized by:
| 1. | Strong gold mineralization in quartz-carbonate veins that is associated with complex networks of brittle fault zones which are commonly discordant to the regional northeast trending foliation and stratigraphy. Mineralization typically occurs as coarse grains of free visible gold in multiphase quartz-carbonate veins that are brecciated, massive-vuggy, laminated, or that have a closely spaced stockwork texture. |
| 2. | A gold association with arsenic-bearing minerals, in addition to antimony and tungsten, including arsenopyrite and boulangerite. |
| 3. | An alteration halo around most of the gold-rich veins that is associated with the changes in the mineralogy of white micas. |
The Queensway Gold Project is interpreted as an orogenic gold deposit, a globally significant deposit type that hosts some of the richest gold systems known.
The Queensway Gold Project consists of an extensive land package that encompasses over 110 km of strike on the AFZ and JBPFZ that, through continued exploration, have demonstrated a spatial relationship to the known gold discoveries. The extensive glacial cover limits outcrop exposure, however, since 2016, New Found Gold has made considerable advancements in their ground field activities, utilizing exploration techniques such as soil and till sampling, and trenching to identify potential bedrock sources of gold mineralization advancing many targets to the drilling phase.
New Found Gold has conducted a variety of ground exploration programs since 2016, including prospecting, geochemical sampling (till, soil, rock and channel (Table 5)), trenching, geological/structural mapping, geophysical surveys, and satellite imagery. A yearly summary of theses activities can be found in the subsections of Section 9 of the Queensway Technical Report.
Table 5: Sampling Summary from New Found Gold’s Exploration at the Queensway Property
Year | | QWN | | QWS | | KW | | TP | | LRB | | BP | | SP | | TMDL | | Total |
|---|---|---|---|---|---|---|---|---|---|---|---|---|---|---|---|---|---|---|
A) Prospecting rock samples | | | | | | | | | | | | | | | | | | |
2017 | | 582 | | 171 | | — | | 30 | | — | | — | | — | | — | | 783 |
2018 | | 101 | | 368 | | — | | 41 | | — | | — | | — | | — | | 510 |
2020 | | 119 | | 1,061 | | — | | 4 | | — | | — | | — | | — | | 1,184 |
2021 | | 206 | | 1,589 | | 2 | | — | | 164 | | 6 | | — | | — | | 1,967 |
2022 | | 52 | | 892 | | — | | 2 | | — | | — | | — | | — | | 946 |
2023 | | 1,834 | | 1,215 | | 1 | | 16 | | — | | 6 | | 130 | | 340 | | 3,542 |
2024 (Jan 1 - Nov 1) | | 38 | | 28 | | 58 | | — | | — | | — | | 1 | | — | | 125 |
2024 (Nov 2 - Dec 31) | | 1 | | 159 | | 9 | | — | | — | | — | | — | | — | | 169 |
2025 (Jan 1 - Jun 30) | | 11 | | 74 | | 1 | | — | | 29 | | 3 | | 6 | | 46 | | 170 |
Total | | 2,944 | | 5,557 | | 71 | | 93 | | 193 | | 15 | | 137 | | 386 | | 9,396 |
B) Till samples | | | | | | | | | | | | | | | | | | |
2016 | | 59 | | - | | - | | - | | - | | - | | - | | - | | 59 |
2018 | | - | | 584 | | - | | - | | - | | - | | - | | - | | 584 |
2020 | | - | | 602 | | - | | 102 | | - | | - | | - | | - | | 704 |
40
Year | | QWN | | QWS | | KW | | TP | | LRB | | BP | | SP | | TMDL | | Total |
|---|---|---|---|---|---|---|---|---|---|---|---|---|---|---|---|---|---|---|
2021 | | 213 | | 93 | | - | | - | | 103 | | - | | - | | - | | 409 |
2022 | | - | | 77 | | - | | - | | - | | - | | - | | - | | 77 |
Total | | 272 | | 1,356 | | 0 | | 102 | | 103 | | 0 | | 0 | | 0 | | 1,833 |
C) Soil samples | | | | | | | | | | | | | | | | | | |
2017 | | 2 | | - | | - | | - | | - | | - | | - | | - | | 2 |
2018 | | - | | 756 | | - | | - | | - | | - | | - | | - | | 756 |
2021 | | 12 | | 376 | | - | | - | | - | | - | | - | | - | | 388 |
2022 | | 435 | | 9,648 | | - | | - | | - | | - | | - | | - | | 10,083 |
2023 | | 5,502 | | 9,402 | | - | | - | | - | | - | | - | | - | | 14,904 |
2024 (Jan 1 - Nov 1) | | 550 | | 835 | | - | | - | | - | | - | | - | | - | | 1,385 |
2024 (Nov 2 - Dec 31) | | - | | 309 | | - | | - | | - | | - | | - | | - | | 309 |
2025 (Jan 1 - Jun 30) | | 289 | | 1,323 | | - | | - | | 149 | | - | | - | | - | | 1,761 |
Total | | 6,790 | | 22,649 | | 0 | | 0 | | 149 | | 0 | | 0 | | 0 | | 29,588 |
D) Trench channel samples | | | | | | | | | | | | | | | | | | |
2017 | | 122 | | - | | - | | - | | - | | - | | - | | - | | 122 |
2018 | | 51 | | - | | - | | - | | - | | - | | - | | - | | 51 |
2020 | | 54 | | - | | - | | - | | - | | - | | - | | - | | 54 |
2021 | | - | | 52 | | - | | - | | - | | - | | - | | - | | 52 |
2022 | | - | | 156 | | - | | - | | - | | - | | - | | - | | 156 |
2023 | | - | | 333 | | - | | - | | - | | - | | - | | - | | 333 |
2024 (Jan 1 - Nov 1) | | 2,641 | | 1 | | - | | - | | - | | - | | - | | - | | 2,642 |
2025 (Jan 1 – Jun 30) | | 1,103 | | - | | - | | - | | - | | - | | - | | - | | 1,103 |
Total | | 3,971 | | 542 | | 0 | | 0 | | 0 | | 0 | | 0 | | 0 | | 4,513 |
Note. QWN - Queensway North, QWS - Queensway South, TP - Twin Ponds, LRB - Little Rocky Brook, BP - Bellman’s Pond, TMDL - Ten Mile-Duder Lake.
Since 2019, and up until November 1, 2024, a total of 587,696 m of drilling and channel sampling in 2,437 holes and channels has been completed by New Found Gold. This drilling and channel sampling has expanded the known mineralization at Keats and led to the discovery, and subsequent expansion, of Lotto, Golden Joint, Keats North, Keats West, Iceberg, K2, and numerous other zones.
The majority of the exploration drilling completed to date has been focused on a five kilometre (“AFZ Core area”) long segment of the AFZ and is largely limited to the top 250 m vertical depth. At QWN alone, New Found Gold controls over 22 km of strike along the AFZ. The Queensway Gold Project offers the potential to: 1) expand known discoveries at depth within the AFZ Core area, 2) identify new near-surface discoveries along strike of the main discovery area, and 3) advance existing targets and identify new targets at QWS and along the JBPFZ.
As of the resource database closure date of November 1, 2024 for the Queensway Technical Report, a total of 723,377 m in 3,224 drill holes and trenches has been completed on the Queensway Gold Project by New Found Gold and previous operators. Of this, New Found Gold has completed 586,044 m in 2,410 holes and 1,652 m in 27 channels since 2019. Table 6 provides a complete summary of these drilling programs. The number of holes and total length included in Table 6 includes holes that were not completed or were abandoned part way through, but does not include holes drilled by previous operators that are located outside of the current property boundaries. Drill holes that were abandoned or were in-progress at the time the database was closed were omitted from the resource database. Excluding holes outside of the property and those that were incomplete, results in a total of 3,214 “on-property” holes.
41
Table 6: Summary of Drilling on the Queensway Gold Project as of November 1, 2024
A)AFZ Core
Historical | 2019 | 2020 | 2021 | 2022 | 2023 | 2024 | Total | |||||||||
No. | Length | No. | Length | No. | Length | No. | Length | No. | Length | No. | Length | No. | Length | No. | Length | |
New Found Gold Corp. | — | — | 4 | 585 | 67 | 13,593 | 359 | 99,978 | 621 | 173,287 | 931 | 177,373 | 176 | 57,924 | 2,158 | 522,740 |
Altius Resources Inc | 8 | 1,037 | — | — | — | — | — | — | — | — | — | — | — | — | 8 | 1,037 |
Candente Resources Corp | 5 | 665 | — | — | — | — | — | — | — | — | — | — | — | — | 5 | 665 |
Gander River Minerals | 13 | 1,357 | — | — | — | — | — | — | — | — | — | — | — | — | 13 | 1,357 |
Manor Resources Inc | 3 | 204 | — | — | — | — | — | — | — | — | — | — | — | — | 3 | 204 |
Noranda Exploraztion Company Ltd | 24 | 2,039 | — | — | — | — | — | — | — | — | — | — | — | — | 24 | 2,039 |
Paragon Minerals Corp | 6 | 625 | — | — | — | — | — | — | — | — | — | — | — | — | 6 | 625 |
Rubicon Minerals Corp | 15 | 1,725 | — | — | — | — | — | — | — | — | — | — | — | — | 15 | 1,725 |
Sky Gold Corp | — | — | — | — | 7 | 1,308 | 12 | 2,044 | — | — | — | — | — | — | 19 | 3,352 |
Soldi Ventures | 23 | 2,776 | — | — | — | — | — | — | — | — | — | — | — | — | 23 | 2,776 |
United Carina Resources | 38 | 3,652 | — | — | — | — | — | — | — | — | — | — | — | — | 38 | 3,652 |
VVC Exploration | 18 | 1,486 | — | — | — | — | — | — | — | — | — | — | — | — | 18 | 1,486 |
Total | 153 | 15,566 | 4 | 585 | 74 | 14,901 | 371 | 102,022 | 621 | 173,287 | 931 | 177,373 | 176 | 57,924 | 2,330 | 541,659 |
B)AFZ Peripheral
2020 | 2021 | 2022 | 2023 | 2024 | Total | |||||||
No. of | Length | No. of | Length | No. of | Length | No. of | Length | No. of | Length | No. of | Length | |
New Found Gold Corp. | — | — | — | — | — | — | — | — | 25 | 7,928 | 25 | 7,928 |
Labrador Gold Corp. | 26 | 1,670 | 218 | 30,895 | 128 | 37,671 | 124 | 29,812 | 6 | 534 | 502 | 100,582 |
Total | 26 | 1,670 | 218 | 30,895 | 128 | 37,671 | 124 | 29,812 | 31 | 8,462 | 527 | 108,511 |
42
C)JBP
Historical (2004- | 2019 | 2020 | 2021 | 2022 | 2023 | Total | ||||||||
No. of | Length | No. of | Length | No. of | Length | No. of | Length | No. of | Length | No. of | Length | No. of | Length | |
New Found Gold Corp. | — | — | 6 | 1,400 | — | — | 71 | 18,182 | 15 | 5,376 | 12 | 3,162 | 104 | 28,120 |
Paragon Minerals Corp | 27 | 5,057 | — | — | — | — | — | — | — | — | — | — | 27 | 5,057 |
Rubicon Minerals Corp | 27 | 4,822 | — | — | — | — | — | — | — | — | — | — | 27 | 4,822 |
Total | 54 | 9,879 | 6 | 1,400 | — | — | 71 | 18,182 | 15 | 5,376 | 12 | 3,162 | 158 | 37,999 |
D)QWS
Historical (1955-2005) | 2022 | 2023 | 2024 | Total | ||||||
No. of | Length | No. of | Length | No. of | Length | No. of | Length | No. of | Length | |
New Found Gold Corp. | — | — | 33 | 7,255 | 37 | 8,379 | 19 | 3,425 | 89 | 19,059 |
Bison Petroleum & Minerals Ltd | 6 | 832 | — | — | — | — | — | — | 6 | 832 |
Candente Resources Corp | 4 | 766 | — | — | — | — | — | — | 4 | 766 |
Crosshair Exploration & Mining | 6 | 616 | — | — | — | — | — | — | 6 | 616 |
Falconbridge Ltd | 12 | 1,019 | — | — | — | — | — | — | 12 | 1,019 |
Hudson’s Bay Oil & Gas Company Limited | 7 | 392 | — | — | — | — | — | — | 7 | 392 |
NALCO | 9 | 1,224 | — | — | — | — | — | — | 9 | 1,224 |
Noranda Exploration Company Ltd | 10 | 853 | — | — | — | — | — | — | 10 | 853 |
Total | 54 | 5,702 | 33 | 7,255 | 37 | 8,379 | 19 | 3,425 | 143 | 24,761 |
E)VOA
Company | Historical (1991) | 2023 | 2024 | Total | ||||
No. of Holes | Length | No. of | Length | No. of | Length | No. of | Length | |
New Found Gold Corp. | — | — | 26 | 6,285 | 1 | 402 | 27 | 6,687 |
Gander River Minerals | 5 | 600 | — | — | — | — | 5 | 600 |
Total | 5 | 600 | 26 | 6,285 | 1 | 402 | 32 | 7,287 |
43
F)Twin Ponds
Company | 2022 | Total | ||
No. of Holes | Length | No. of Holes | Length | |
New Found Gold Corp. | 7 | 1,509 | 7 | 1,509 |
Total | 7 | 1,509 | 7 | 1,509 |
G)QWN Trenching
Company | 2024 | Total | ||
No. of Channels | Length | No. of Channels | Length | |
New Found Gold Corp. | 27 | 1,652 | 27 | 1,652 |
Total | 27 | 1,652 | 27 | 1,652 |
H)Queensway Gold Project Total
| Historical | 2019 | 2020 | 2021 | 2022 | 2023 | 2024 | Total | ||||||||
Company | No. | Length | No. | Length | No. | Length | No. | Length | No. | Length | No. | Length | No. | Length | No. | Length |
New Found Gold Corp. | — | — | 10 | 1,985 | 67 | 13,593 | 430 | 118,160 | 676 | 187,427 | 1,006 | 195,200 | 248 | 71,331 | 2,437 | 587,696 |
Labrador Gold Corp. | — | — | — | — | 26 | 1,670 | 218 | 30,895 | 128 | 37,671 | 124 | 29,812 | 6 | 534 | 502 | 100,582 |
Historical Companies | 266 | 31,747 | — | — | 7 | 1,308 | 12 | 2,044 | — | — | — | — | — | — | 285 | 35,099 |
Total | 266 | 31,747 | 10 | 1,985 | 100 | 16,572 | 660 | 151,098 | 804 | 225,098 | 1,130 | 225,012 | 254 | 71,865 | 3,224 | 723,377 |
44
5.7Sampling, Analysis and Data Verification
5.7.1Sampling
Between 2017 and 2025, New Found Gold collected and assessed various sample types at the Queensway Gold Project. These include: till, soil, surface rock, and trench channel samples since 2017; and drill core samples since 2019.
Till samples were collected and prepared to analyze gold grain size and quantity. In the field, samples were screened using an 8 mm sieve to remove pebbles. Approximately 13 kg of fine material (<8 mm) and 1 kg of coarse material (>8 mm) were packed in heavy-duty plastic bags and sealed. The fine fraction was analyzed for gold content, while the coarse fraction was used for lithology logging. Samples were sent to Overburden Drilling Management (“ODM”) for concentration. LabGold utilized a similar methodology, the major difference being the use of a 9mm screen, and collection of 11 kg of fine material (<9 mm). All LabGold samples were sent to ODM who created a concentrate.
New Found Gold geologists collected soil samples using a Dutch Auger to reach the B-soil horizon. The HALO mass spectrometer was used to identify alteration halos in the samples. Since July 2022, samples were dried and sieved on-site, then bagged, labelled, and sent for analysis to Eastern Analytical in Springdale, NL, and ALS in Vancouver, BC. LabGold utilized a “Dutch Auger” to penetrate down to and sample the B, B/C or C horizon. The soil samples were shipped for analysis to Bureau Veritas (“BV”) in Vancouver, BC in 2020 to 2021, and to SGS Grand Falls, NL for preparation, with analysis at SGS in Burnaby, BC in 2023.
Rock samples, including surface outcrop, float, and channel samples, were collected by New Found Gold geologists. These samples were placed in heavy-duty plastic bags, labelled, sealed, and transported to New Found Gold’s core facility in Gander, NL. At the core facility, labels were verified, and samples were amalgamated into larger bags for transport to various laboratories, including Eastern Analytical, ALS Canada, MSALABS in Val-d’Or, QC, and SGS Canada Inc. (“SGS Canada” or “SGS”) in Burnaby, BC. The samples are transported in large plastic totes with lids secured using ball-locked metal truck seals. All rock samples collected by LabGold were analysed at Eastern Analytical in Springdale, NL.
HQ-sized diamond drill core are transported in sealed core boxes to the primary core facility in Gander, NL. At the facility, the core is logged and analyzed using the HALO hyperspectral mineral identifier before sampling. After geological and structural logging is complete, samples ranging from 0.3 m to 1.0 m in length are marked out by the logging geologist, with sample tags inserted. Samples respect geological contacts, especially where there is a change in lithology or mineralization style. Photos are taken of the tagged core before the core is then transferred to a cutting section, where it is sawn in half using diamond saw blades by a trained core technician. Half of the core is placed in plastic sample bags and secured with a zip tie for laboratory analysis, while the other half is stored in the core boxes for reference at New Found Gold’s sample storage facility in Appleton Business Park, NL. In cases of poor core competency, a hydraulic splitter may be used. Sample labels are checked and placed into larger bags before being transported by New Found Gold employees to laboratories. The samples are carried in large plastic totes with lids secured using ball-locked metal truck seals. The designated laboratories include Eastern Analytical, ALS Canada, MSALABS, and SGS Canada. LabGold transported HQ and NQ core to the LabGold primary core facility in Gander, NL. Here the core was logged and photographed. The drill core samples range from 0.1 m to 5.1 m, with 0.5 m to 1.0 m as the typical optimal sample length. Samples selected for analysis were cut in half using an electric core saw along the line originally drawn on the core during orientation. Half of the sample was placed in a sealed plastic bag, with the corresponding sample tag, and the other half of the core remaining in the core box. The core samples were transported directly to Eastern Analytical laboratory in Springdale, NL.
LabGold contracted GroundTruth Exploration of Dawson City, Yukon (“GroundTruth”), to conduct and manage RAB and RC drilling. GroundTruth personnel collected all rock chips from RAB/RC drilling. Once a run was complete, the collection bucket was removed from the drill, and rock chip material passed through
45
a splitter, producing an 87.5%/12.5% split. The 12.5% split was placed in a plastic sample bag for analytical processing. The remaining 87.5% was placed in a container as ‘retention’ material. From the retention material a small number of chips were selected for portable X-ray fluorescence analysis on site, and a small portion placed in chip tray for logging. Duplicate samples were collected utilizing three to four scoops taken using a PVC pipe. Rock chip samples were transported to Eastern Analytical for analysis.
5.7.2Sample Security
Samples are inventoried, placed in rice bags secured with cable ties, and then packed in labelled shipping bins with numbered security seals. Samples are collected, packaged, transported, and received under a strict and traceable chain of custody (“CoC”). New Found Gold staff delivered samples to commercial carriers, where they are directly loaded into trucks, or placed in a designated, secure area. Currently, all ALS samples are shipped by commercial courier along with a CoC document, which includes sample numbers, and is signed by both the courier and the New Found Gold representative to confirm the state of the shipment.
The sample shipments are tracked in the MX Deposit database, and the laboratory is notified. Upon receipt, the laboratory informs New Found Gold’s designated staff, and the samples are verified against New Found Gold’s submittal form for any discrepancies.
LabGold samples (soil, till, rock, chip, core) were stored at New Found Gold’s core logging facility in Glenwood, which was locked when not in use and had security camera monitoring. Individually bagged, uniquely numbered samples were placed into rice bags. The rice bags were labelled with New Found Gold’s name, series of sample numbers in the bag, total number of samples, and the rice bag number in the sequence of rice bags submitted for the batch. Each rice bag was sealed with a unique barcode ID security tag. This information was recorded, scanned, and entered into MX Deposit, which was also used to track sample status.
Samples sent in NL were delivered by New Found Gold representatives to Eastern Analytical and SGS. Samples sent outside NL were placed in crates and/or on wooden pallets and shipped via courier to ODM, BV, and ALS.
5.7.3Analytical and Test Laboratories Accreditation
New Found Gold has utilized various independent and commercially accredited laboratories that meet ISO/IEC 17025:2017 standards, including Eastern Analytical, ALS Canada, SGS Canada, and MSALABS. The laboratories are independent of New Found Gold and have no known relationship with the issuer.
Other intermittent analytical work was conducted at Activation Laboratories Ltd. (“ActLabs”) in Ancaster, ON (till multi-element analysis), ODM in Nepean, ON (till heavy-mineral concentrates), and SGS in Burnaby, BC (check analytical laboratory).
The laboratories that performed multi-element inductively couple plasma (“ICP”) analyses (Eastern Analytical, ALS, and ActLabs) are ISO-accredited for multi-element analytical methods.
LabGold utilized multiple independent commercial laboratories from 2020 to 2024, including Eastern Analytical, BV, SGS, ALS, and ODM.
5.7.4Sample Preparation and Analysis
ODM created a concentrate of the till samples provided by New Found Gold and LabGold. Prior to 2019, the concentrates were created using a screening and tabling procedure. After 2019, they were created using ODM’s Heavy Mineral Concentrate preparation procedure. The gold content of each sample was estimated from the number of gold grains found in the concentrate and their size. The shape and texture of the grains were also recorded, and the mineralogy of the associated heavy minerals was described. Multi-
46
element analysis of till samples was performed in ActLabs using instrumental neutron activation analysis (“INAA”) to measure multi-element chemistry (1H INAA(INAAGEO)/Total Digestion ICP(TOTAL)). This method employs a 4-acid “near total” digestion for determining resistive elements, followed by ICP analysis. Multi-element analysis of LabGold till samples was performed by BV and Eastern Analytical. At BV samples were analyzed by method AQ200. This method employs aqua regia digestion, followed by ICP-MS analysis. At Eastern Analytical, gold analysis of the till samples were completed by fire assay, with atomic absorption analysis. Multi-element analysis was completed by 4-acid digestion, with ICP-OES analysis.
At Eastern Analytical, soil samples were dried and sieved through an 80 mesh (-180 µm) before gold analysis. Similarly, at New Found Gold, soil samples were dried and screened through an 80 mesh. Soil samples analyzed at Eastern Analytical utilized a fire assay package (code: Au AA30) and multi-element ICP (Au+34 elements). Soil samples analyzed at ALS Global utilized a trace gold plus multi-element package (ALS code: AuME-ST44). BV in Burnaby, BC was utilized by LabGold for gold analysis of soil samples. The analysis was completed using method code AQ201 (15 g aqua regia digestion, with ICP-MS analysis). Thirty-six other elements were included with this method. SGS was also utilized by LAB for gold analysis of soil samples. The analysis was completed using method code GE_ARM3V25 (25 g aqua regia digestion, with ICP-MS analysis). 48 other elements were included with this method.
The New Found Gold samples were prepared and analyzed using various methods to ensure precise determination of the gold grade. Initial routine analysis was performed using FA techniques. Samples with initial results over 1 ppm Au, or from expected mineralized zones, were analyzed by SFA. In 2022, the screen threshold was raised to 2 ppm Au. Starting in May, 2022, half of the drill core samples were analysed by PhotonAssayTM. Initially, all material was analyzed from samples with gold grades greater than 1 ppm Au, or from expected zones of mineralization, and a weighted average was used. In November 2023, that threshold was modified to 0.8 ppm Au or samples with visible gold. Starting in January 2024, all channel and drill core samples underwent photon assay. The detailed preparation and analysis workflow is presented below by laboratory and analytical target.
5.7.5QA/QC Protocols
New Found Gold has established a robust quality assurance and quality control (“QA/QC”) protocol, integrating quality control samples at a frequency of 1 in 10 samples. These samples include blanks, certified reference materials (“CRM”), and core field duplicates. The blank material, sourced from quartz sandstone of the Botwood Group at Peter’s River Quarry in central Newfoundland, was submitted to the laboratory in quantities of 500 g to 600 g for routine fire assays and approximately 3 kg for SFA. The CRMs, obtained from Ore Research and Exploration Pty Ltd., are certified, homogenous, quality control materials provided in sealed packets.
New Found Gold collaborated with Analytical Solutions to design and review the QA/QC program at the Queensway Gold Project. Under the guidance of an independent third party, New Found Gold implemented the QA/QC protocols and analyzed the results. QC data were assessed upon receipt from the laboratories, and necessary actions were taken if assay results for CRMs and blanks were outside the acceptable tolerances. Furthermore, New Found Gold conducted laboratory check assays and compared conventional screen fire assays with PhotonAssayTM analyses. The laboratories also performed pulp duplicate and coarse reject duplicate analyses.
A total of 711,262 samples, including 86,660 control samples, were submitted to ALS or MSLABS for analysis, representing a total insertion rate of 12%.
The SLR Consulting QP has reviewed the adequacy of sample preparation, security, and analytical procedures conducted by New Found Gold from the start of the Queensway exploration programs in 2019 through to the Queensway Technical Report Effective Date. This review found no material issues or inconsistencies that could adversely affect the quality or reliability of the data.
47
Overall, the SLR Consulting QP is of the opinion that New Found Gold’s sampling, analytical methods, and QA/QC program meet industry standards and are suitable for use in the MRE.
5.7.6Data Verification
New Found Gold’s technical staff independently verify the accuracy, completeness, and reliability of the data they collect. This verification process includes evaluating collar locations, downhole surveys, geological and geotechnical data, bulk density measurements, and assay results.
Drill hole collars were initially positioned using a RTK GPS receiver, ensuring high-accuracy spatial data for each hole. Final collar surveys were conducted using a TN14 Gyrocompass to confirm azimuth and dip before drilling commenced. For drill programs requiring alternative placement methods (e.g., barge-supported drilling), adjustments were made, and RTK GPS data was collected near the drill mast to approximate location accuracy. New Found Gold staff reviewed the drill collar database and cross-referenced the recorded positions with field surveys.
Downhole azimuth and dip data were recorded using IMDEX’s Reflex EZ-Trac survey tool at 50 m intervals during drilling, with an increased frequency of 15 m intervals upon hole completion. For directional drilling, a DeviGyro system was employed, providing continuous surveys at 3 m intervals for improved accuracy. In cases where drill hole diameters transitioned from HQ to NQ size, DeviGyro surveys were used to mitigate the influence of magnetic interference on results. New Found Gold staff verified survey data by reviewing consistency in azimuth and dip values across multiple survey passes, checking them for erroneous values.
Geological and geotechnical logging was conducted at New Found Gold’s core logging facility in Gander, NL, by trained geologists and technicians. Core logging included detailed lithological descriptions, mineralization styles, and structural data, with orientation measurements where applicable. Since December 2020, OTV and ATV images have been systematically collected for select drill holes, providing high-resolution structural data. In 2024, the ACT III core orientation tool was used on holes that exceeded the wireline length of the OTV and ATV probes. New Found Gold staff reviewed the geological and geotechnical data for completeness (missing or incomplete interval or point data), geological and geotechnical viability (e.g., recovery and rock quality designation within plausible range of values), and errors using built-in validation reporting within Seequent’s MX Deposit and Leapfrog (e.g., overlapping intervals, intervals that cross lithological boundaries, intervals that exceed hole depth, and null fields that require data). Core recovery exceeded 95% in most intervals. Any errors identified were then reviewed and corrected in the MX Deposit database.
Bulk density measurements were conducted using three methods: gamma-gamma downhole logging, gas pycnometer density measurements, and wax immersion Archimedes testing. New Found Gold reviewed the results from gamma-gamma logging and gas pycnometer measurements, comparing them to wax immersion Archimedes values. Based on this assessment, New Found Gold decided to discontinue gamma-gamma logging and gas pycnometer measurements, prioritizing wax immersion Archimedes testing.
Assay results are received via email from the laboratory. All result certificates are imported into MX Deposit by New Found Gold staff. All but PhotonAssayTM extinction results are imported unedited. For extinction results, an application programmed by an external consultant is used to ensure the weighting method is consistent. Spot checks are performed intermittently to ensure the script is functioning properly. During import, results are checked for CRM performance, spelling errors, missing samples, or results which fall outside the expected ranges. The laboratory will be informed, and re-assay initiated for any CRM failures. Blank contamination will also result in follow-up with the laboratory. Any strongly anomalous gold result from a portion of core where logging geologists did not flag visible gold is retrieved from the core archive for review.
After purchasing or finalizing an agreement on a property (such as the purchase of Kingsway from LabGold), a verification process is undertaken to import the assay data into the New Found Gold drilling
48
database. Samples first have their start and end points validated before import. CRM and blank parameters are entered into the database to validate laboratory performance during import. All original result certificates received from the laboratory are imported individually into the database. New Found Gold will contact the laboratory where possible to validate the method, laboratory accreditation, and request a selection of raw certificates for validation. Where possible, anomalous zones are validated either from core photos or retrieving core.
SLR Consulting found no material discrepancies identified that would impact the validity of the MRE. SLR Consulting’s QP is of the opinion that the verification process confirms the reliability of the assay database, ensuring its suitability for use for Mineral Resource estimation.
5.8Mineral Processing and Metallurgical Testing
Since 2023, New Found Gold has completed two phases of metallurgical test work, and a third phase is in progress. Phase 1 of the test work evaluated three mineralized zones, Keats, Golden Joint, and Lotto, and phase 2 studied mineralization from the Iceberg and Iceberg East zones. The phase 3 test work currently underway is examining mineralized material from Keats West.
Samples used in test work were selected to provide a wide range of gold head grades for evaluation. Since the samples were selected prior to the completion of geological modelling and resource estimation, their selection did not benefit from detailed knowledge of grade distributions within each zone or the extent of each zone.
Test work to date on samples from the Keats, Lotto, Golden Joint, and Iceberg zones has focused on a gravity concentration-CIL flowsheet and included exploratory test work using master composites and variability test work using variability composites. The master composites for each zone were produced by combining portions from all of the variability composites from their respective zones.
Exploratory test work using the Keats and Lotto master composites resulted in high GRG recoveries, while indicating that preg-robbing affected cyanide leaching extractions from the gravity tails. Therefore, subsequent variability testing on composites from these zones used gravity concentration followed by CIL of the gravity tails. The variability test work was conducted at three grind sizes for each composite, 212 µm, 75 µm, and 37 µm, to assess the effect of grind size on gold recovery, with a P80 of 75 µm ultimately being chosen as the optimum grind size.
Analysis of the CIL test results from the variability test work using Keats, Lotto, and Golden Joint composites showed that there was a relationship between leach extraction and arsenic head grade, indicating that a portion of the gold in the samples was associated with arsenic and refractory to leaching. This relationship was pronounced in the samples with lower gold head grades (<4g/t Au). This analysis, together with mineralogical data indicated that the unleached gold was likely associated with arsenopyrite (and possibly pyrite) and not well liberated.
Exploratory flotation test work was completed on Keats, Lotto, and Iceberg master composites as well as four variability composites from the Keats and Lotto zones selected due to their relatively poor gravity-CIL responses (with overall gold extractions ranging from 57% to 73%). Carbon flotation aimed at rejecting carbon to minimize its pre-robbing effect indicated that some loss of gold would occur in this step and overall extraction was not beneficially affected. Sulphide flotation was effective at recovering gold from gravity and carbon flotation tails into a concentrate, however, re-grinding of that concentrate was not effective at improving gold extraction during leaching. Additionally, the flotation concentrates contained elevated levels of arsenic that would be subject to penalties if sold to concentrate processors.
During the flotation test work, pre-aeration prior to leaching appeared to be beneficial in reducing cyanide consumption during subsequent leaching of the sulphide concentrates.
49
The flotation tests using Keats, Keats West, Lotto, and Iceberg composites resulted in overall gold recoveries to gravity and sulphide concentrates ranging from 89% to 97% with sulphide concentrates containing 9 g/t Au to 67 g/t Au. Cleaner flotation test work to upgrade the concentrates is expected to result in some gold losses, however, the flotation tests completed to date did not include CIL of the sulphide flotation tails, and it is possible that gold losses through cleaner flotation would be offset by additional gold recovery from leaching the flotation tails. This possibility has not yet been confirmed during test work.
In general, the test work completed to date indicated that gold was present in two main forms in the samples tested: free gold amenable to gravity recovery and extraction by cyanide leaching, and gold associated with arsenic that was only partially amenable to cyanide leaching and highly amenable to recovery by flotation. Higher grade samples (>4 g/t Au) contained higher proportions of free gold, while the lower grade samples (<4g/t Au) tended to be increasingly characterized at decreasing gold grades by partially liberated or unliberated gold associated with arsenic.
Comminution test work was completed on master composites from each zone and a selection of eight Iceberg variability composites and indicated that the material was amenable to conventional crushing and grinding.
Preliminary test work on three composite samples from Keats West was completed, with initial tests using a gravity concentration-CIL flowsheet indicating that CIL extraction from the gravity tails was poor. Preliminary results from flotation test work on gravity tails of the master composites indicated that flotation was effective at recovering the unleachable gold. The test work included two-stage cleaning of the sulphide rougher concentrates, which showed that concentrate could be produced with adequate gold grades to make a saleable concentrate attractive to processors, although containing elevated (penalizable) levels of arsenic.
Geological and mineralization domains were constructed by New Found Gold and reviewed by SLR Consulting. The initial Mineral Resource estimate was prepared by SLR Consulting. The resource database was closed on November 1, 2024 and contains 3,214 drill holes for a total of 723,387 m, for which 550,949 m have assay intervals.
The Mineral Resource estimate is grouped into three primary areas. The AFZ Core area contains the majority of zones, including K2 and Monte Carlo; Keats West, Cokes, and Powerline; Keats, Keats South, Iceberg, Iceberg Alley, Knob, and Golden Bullet; as well as Lotto, Golden Joint, Jackpot, and Honeypot. These zone names reflect the most prominent veins contributing to the contained metal within each zone, though each zone includes numerous additional veins beyond those listed. The AFZ Peripheral area includes the Big Vein, Pristine, HM, and Midway zones. The JBP area includes the H Pond, 1744, and Pocket Pond zones. All Mineral Resources are located within the QWN block; no Mineral Resources have been estimated for QWS.
Geological and mineralization wireframes were constructed using Leapfrog Geo software, while grade estimation for the AFZ Core area was completed using the Python-based Resource Modelling Solutions Platform (“RMSP”). Grade estimation for the AFZ Peripheral and JBP areas was completed using Leapfrog Geo.
Gold grade was interpolated using a third-order ID3 algorithm, with search neighbourhood parameters supported by variography undertaken for key veins.
Average bulk density was assigned to geological and mineralization domain, supported by drill core sample measurements made using the water immersion method.
The estimates were validated through visual comparison of block and composite grades, statistical comparison of block and composite grades, swath plots, and comparison with Nearest Neighbour check
50
estimates for all veins. For selected high-value veins within the RMSP estimate, further check ID3 estimates were completed in Leapfrog Geo.
Block models were rotated 30° clockwise about the vertical axis. The estimation block model has a parent block dimension of 2.5 m x 2.5 m x 5 m, with a minimum sub-block size of 0.625 m x 0.625 m x 1.25 m.
For the purposes of open pit optimization, the block model was re-blocked to 5 m x 5 m x 5 m, while open pit Mineral Resources are reported from a block model regularized to the parent cell size. Underground reporting panels were generated from the original estimation sub-block model, which was also used to report the underground Mineral Resources.
To demonstrate reasonable prospects for eventual economic extraction (“RPEEE”), open pit Mineral Resources are constrained by a preliminary optimized open pit shell and reported above a cut-off grade of 0.3 g/t Au.
Underground Mineral Resources are constrained by reporting panels generated at a cut-off grade of 1.65 g/t Au and a minimum mining width of 1.8 m.
CIM (2014) definitions were used for Mineral Resource classification.
Mineral Resources for the Queensway Gold Project (all located within the QWN block) are tabulated in Table 7, with an effective date of March 15, 2025:
Table 7: Summary of Mineral Resources — Effective Date March 15, 2025
Zone | Area | Category | Tonnage | Grade | Contained |
Open Pit | |||||
K2, Monte Carlo | AFZ Core | Indicated | 3,588 | 1.51 | 175 |
Inferred | 3,755 | 1.22 | 147 | ||
Keats West, Cokes, Powerline | AFZ Core | Indicated | 4,392 | 1.85 | 261 |
Inferred | 2,410 | 1.33 | 103 | ||
Keats, Keats South, Iceberg, Iceberg East, Iceberg Alley, Knob, Golden Bullet | AFZ Core | Indicated | 7,004 | 2.94 | 662 |
Inferred | 1,037 | 0.84 | 28 | ||
Lotto, Golden Joint, Jackpot, Honeypot | AFZ Core | Indicated | 1,205 | 3.16 | 122 |
Inferred | 1,078 | 1.31 | 45 | ||
Big Vein, Pristine, HM, Midway | AFZ Peripheral | Indicated | 995 | 0.82 | 26 |
Inferred | 474 | 1.56 | 24 | ||
H Pond, 1744, Pocket Pond | JBP | Indicated | 83 | 1.54 | 4 |
Inferred | 206 | 1.66 | 11 | ||
Total | | Indicated | 17,267 | 2.25 | 1,249 |
Inferred | 8,960 | 1.24 | 358 | ||
Underground | |||||
K2, Monte Carlo | AFZ Core | Indicated | 32 | 3.02 | 3 |
Inferred | 335 | 2.78 | 30 | ||
Keats West, Cokes, Powerline | AFZ Core | Indicated | — | — | — |
Inferred | 28 | 2.76 | 3 | ||
Keats, Keats South, Iceberg, Iceberg East, Iceberg Alley, Knob, Golden Bullet | AFZ Core | Indicated | 306 | 5.13 | 50 |
Inferred | 660 | 4.53 | 96 | ||
Lotto, Golden Joint, Jackpot, Honeypot | AFZ Core | Indicated | 303 | 6.97 | 68 |
Inferred | 394 | 6.34 | 80 | ||
Big Vein, Pristine, HM, Midway | AFZ Peripheral | Indicated | 100 | 5.42 | 17 |
Inferred | 119 | 5.72 | 22 | ||
51
Zone | Area | Category | Tonnage | Grade | Contained |
H Pond, 1744, Pocket Pond | JBP | Indicated | 30 | 4.09 | 4 |
Inferred | 214 | 2.79 | 19 | ||
Total | | Indicated | 771 | 5.76 | 142 |
| Inferred | 1,749 | 4.44 | 250 |
Zone | Area | Category | Tonnage | Grade | Contained |
Open Pit + Underground | |||||
Total | | Indicated | 18,038 | 2.40 | 1,392 |
| Inferred | 10,709 | 1.77 | 608 | |
Notes:
| (1) | CIM (2014) definitions were followed for Mineral Resources. |
| (2) | Mineral Resources are estimated using a long-term gold price of US$2,200 per ounce, and a US$/C$ exchange rate of US$1.00 = C$1.43. |
| (3) | Open pit Mineral Resources are estimated at a cut-off grade of 0.3 g/t Au and constrained by a preliminary optimized pit shell with a pit slope angle of 45° and bench height of 5 m. |
| (4) | RPEEE for underground Mineral Resources was demonstrated by constraining with MSO shapes generated at a cut-off grade of 1.65 g/t Au, with heights of 10 m, lengths of 5 m, and a minimum mining width of 1.8 m. |
| (5) | The optimized pit shell, underground reporting shapes, and cut-off grades were generated by assuming metallurgical recovery of 90%, standard treatment and refining charges, mining costs of C$5.0/t moved for open pit and C$120/t processed for underground, processing costs of C$20/t processed, and general and administrative costs of C$7.5/t processed. |
| (6) | Mineral Resources that are not Mineral Reserves do not have demonstrated economic viability. |
| (7) | Bulk density within the vein and halo mineralization domains is 2.7 t/m3. |
| (8) | Numbers may not add due to rounding. |
New Found Gold is not aware of any environmental, permitting, legal, title, taxation, socio-economic, marketing, political, or other relevant factors that could materially affect the Mineral Resource estimate other than those discussed in the Queensway Technical Report.
No Mineral Reserves are defined for the Queensway Gold Project.
A scoping level mine design, production schedule, and associated mining cost model were developed for the Queensway Gold Project based on an open pit mining method and underground mining method. The mine plan is based on conventional open pit truck and shovel methods with a complementary high grade underground cut and fill mine. The PEA is preliminary in nature and includes Inferred Mineral Resources that are considered too speculative geologically to have the economic considerations applied to them that would enable them to be categorized as Mineral Reserves. There is no certainty that the results of the PEA will be realized. Mineral Resources that are not Mineral Reserves have not demonstrated economic viability.
The portion of the Indicated and Inferred Mineral Resources used for evaluation purposes in the PEA above the cut-off value, including allowances for dilution and mining loss, is referred to as run of mine (“ROM”) in the Queensway Technical Report. SLR Consulting cautions that ROM quantities cannot be considered Mineral Reserves. Inferred Mineral Resources are estimated to form the basis for approximately 33% of ROM quantity estimates. There is no guarantee that further exploration will upgrade any of the Inferred Mineral Resources.
The portion of Indicated and Inferred Mineral Resources used in the PEA evaluation, above a cut-off grade of 0.3 g/t Au, and inclusive of dilution and mining loss allowances, is based on a pit optimization study that supports a mine life of 13 years. The ultimate pit design was guided by a Whittle pit shell that incorporates the Queensway Gold Project boundary and accounts for the TCH constraint to the southwest.
52
The open pit operation will consist of 17 pits. The three main pits – Iceberg, Keats, and Keats West – are sequenced early in the mine life and will subsequently serve as the in-pit tailings storage facility (“IPTSF”). The open pit optimization was completed with a 5 m x 5 m x 5 m block model. The open pit operation is planned to be an owner-operated mining fleet, using smaller equipment to minimize dilution and maximize selectivity. The equipment fleet will consist of 70 tonne-class haulage trucks and 10 cubic metre (“m3”) shovels. The mining sequence and rate have been optimized to prioritize higher grades first by ensuring the highest grades for the 700 tpd Phase 1 operation and moving into Phase 2 at 7,000 tpd and having an open pit available for in-pit tailings deposition starting in Year 5.
The underground operation will take place from Year 6 to Year 10 in five zones, accessible from five surface portals collared from the smaller open pits. The primary mining method will be mechanized cut and fill. A 3 m x 7 m stope size was selected to minimize dilution while maximizing selectivity. The backfill method will be a combination of rock fill and cemented rockfill. Initial capital development is planned for one year, followed by ongoing capital development over three additional years. It is envisaged that capital development will be executed using contractors, while production mining will be accomplished by owner operators.
The open pit production phase will extend from Year 1 through Year 13, with the LOM open pit production, including pre-production, estimated at 26.3 Mt at an average grade of 1.62 g/t Au. During the same period, approximately 158 Mt of waste rock will be mined, resulting in an average strip ratio of 6:1. Processing of open pit ROM material through toll milling operations will be conducted from Year 1 through Year 5 and the on-site plant starts in Year 5. Underground mining operations are planned from Year 6 to Year 10, covering a five-year period. Total LOM underground production is estimated at 1.07 Mt of ROM material with an average grade of 6.67 g/t Au. In the final two years (Years 14 and 15), the onsite plant will process the remaining low grade material that was stockpiled over the course of the mine life. The combined LOM production schedule for both open pit and underground operations is 27.4 Mt at an average grade of 1.85 g/t Au.
The infill drilling currently being conducted is targeting the Inferred material to upgrade to Indicated.
5.11Processing and Recovery Operations
The PEA is based on a two-phase approach to processing. In the first phase (Year 1 through Year 5 of the life-of-mine (“LOM”)) mineralized material will be mined from the Keats and Iceberg zones. High grade material will be trucked to a third-party mill and processed, while lower grade material will be stockpiled near the location of a future on-site processing plant at the Queensway Gold Project. This will allow for revenue generation prior to and during the construction of capital-intensive on-site facilities (mainly the new processing plant), as well as provide mined-out pits into which tailings from the future processing plant can be deposited, which will eliminate the need to construct a surface tailings impoundment. In the second phase (Year 5 through Year 15), ROM and stockpiled material will be processed in the new Queensway processing plant.
The third-party mill will process high grade material sourced from the Keats and Iceberg zones at a rate of 700 tpd. ROM material will be crushed at Queensway before being loaded into trucks and transported to the toll mill. The mill will use a conventional grind-gravity concentration-CIL flowsheet to produce doré bars. Tailings will be deposited in the adjacent existing, permitted, tailings management facility. The mill will require modifications and refurbishment to process the Queensway Gold Project material, and an estimate of the cost of these has been included in the Queensway Gold Project capital cost estimate. The new processing plant to be built at the Queensway Gold Project site will have a design throughput capacity of 7,000 tpd and will be constructed during Years 3 and 4 of the LOM. It will be commissioned and will ramp up production during Year 5. The mill will operate for 11 years until the end of the current LOM in Year 15, and will process material from the medium and low grade stockpiles created during Years 1 through 5 of the LOM, as well as current ROM material. The process will consist of single-stage crushing, grinding in a semi-autogenous grinding and ball mill circuit, and gravity concentration, followed by intensive cyanide leaching of the gravity concentrate, flotation to produce a sulphide concentrate containing gold for sale,
53
cyanide leaching of the flotation tails in a CIL circuit, cyanide destruction, and tailings thickening and disposal in mined-out pits. The crushing circuit will have a utilization of 75%, allowing for planned maintenance and unplanned down time, while the balance of the plant will have a utilization of 92%. The crushed ore stockpile will allow routine crusher maintenance to be carried out without interrupting feed to the mill. Reagent and consumable consumptions will be further defined and optimized during future test work. For the PEA, their consumptions have been based on the exploratory test work completed to date and from comparable projects.
Electrical energy will be sourced from the provincial grid and consumption for the Queensway processing plant has been estimated from preliminary estimates of major equipment motor sizes plus an allowance for smaller equipment. The total connected load is estimated at approximately 19 MW, with nominal demand estimated at 14.3 MW.
Fresh water make up has been assumed to be sourced from local sources, primarily well water, and may include water from pit dewatering. Make-up water requirements will depend largely on how much water can be recycled from in-pit tailings disposal, however, it is anticipated that fresh water requirements will be less than approximately 100 m3/h.
5.12Infrastructure, Permitting and Compliance Activities
The Queensway Gold Project will be developed following a phased approach and will require infrastructure to support mining operations. Infrastructure that is required to support operations includes:
| ● | Surface development, including clearing, grubbing, and terracing. |
| ● | Development of roads around the Queensway Gold Project, including an access road, service roads, and haul roads. |
| ● | Realignment of existing transmission lines and the establishment of a dedicated incoming transmission line, substation, and power distribution. |
| ● | Waste Rock Storage Facility and Overburden Storage Facility development. |
| ● | Water management infrastructure including intake water, effluent treatment plant, diversion ditches, sedimentation ponds, potable water, sewage system, process water, and fire water. |
| ● | Surface buildings such as administration, dry complex, warehouse, mobile equipment maintenance shop, temporary accommodations. |
| ● | IPTSF. |
The Queensway Gold Project area is located on the Island of Newfoundland, near the towns of Gander and Appleton. There are numerous rivers, ponds and wetlands in the area, including Gander Lake and its watershed. The region is home to a variety of typical boreal forest wildlife and bird species that are adapted to long winters and short summers. Several species at risk (“SAR”) and species of special concern (“SOCC”) have been identified as occurring within the Queensway Gold Project area, including two bat species and several avifauna species. No SAR plant species were identified during field investigations, but flora species considered to be SOCC have been documented. Critical habitat, as defined by the Species at Risk Act for the terrestrial species noted above has not been identified in the Queensway Gold Project area. Management of potential Queensway Gold Project interactions with SAR and SOCC will require close collaboration with regulators and development of Queensway Gold Project-specific mitigation and monitoring.
The Queensway Gold Project area is located within the Gander River Watershed. Gander Lake, located southwest of the Queensway Gold Project area, discharges northwest through Gander River until it reaches Gander Bay. A portion of the Queensway Gold Project area occurs within the Public Protected Water Supply Area (“PPWSA”) surrounding Gander Lake, which serves as the drinking water source for Gander and surrounding communities. Queensway Gold Project area contact water will be directed away from the PPWSA and to the site water management system which will discharge treated water within the Gander River watershed outside the PPWSA. The Gander River is a scheduled salmon river and has a well-known recreational salmon fishery.
54
The Queensway Gold Project area is adjacent to the TCH and the municipal boundary of the Town of Appleton. Recreational and harvesting activities are known to occur in the vicinity of the Queensway Gold Project area given the abundance of access trails and roads, including the T’Railway Provincial Park, located south of the Queensway Gold Project area. New Found Gold’s commitment to stakeholder engagement includes regular community meetings, open forums, and regulatory consultation designed to provide transparency and mutual understanding. As the Queensway Gold Project is developed, New Found Gold will implement a formal engagement strategy with stakeholders and is committed to working collaboratively with stakeholders to contribute positively to NL’s well-being and prosperity.
As the Queensway Gold Project is proposed to advance in phases, the applicability of the provincial and federal EA processes is dependent on the phase and associated annual production capacity. Phase 1 (700 tpd) is proposed to be assessed as a stand-alone undertaking and will be subject to the provincial Environmental Assessment (“EA”) process. As the Queensway Gold Project advances to Phases 2 and 3 with a planned annual production rate of 7,000 tpd, these phases would be subject to both provincial EA and federal EA requirements.
Groundwater levels within the area studied are generally shallow and ranged from 2.98 metre below ground surface (“mbgs”) to -0.23 mbgs (artesian) during the 2023 field program. Local shallow groundwater flows generally in westerly and northerly directions towards the Gander River with some localized flow in the vicinity of other surface water features, such as Herman’s Pond. Hydraulic conductivities, calculated based on preliminary hydraulic testing of four exploration boreholes, range from 2.1 × 10⁻⁹ metres per second (“m/s”) to 2.0 × 10⁻⁸ m/s with geometric mean of 6.2 × 10⁻⁹ m/s. Dewatering of groundwater infiltration will be required during operations and will create a radius of influence around the open pits, which will lower groundwater and surface water levels within that radius of influence.
Based on the geochemical evaluation to date, most of the waste rock at the QWN prospects is generally non-reactive. However, the exposed black siltstone / graphitic siltstone will require appropriate management. Data assessment and comparison with other deposits indicate that metal leaching / acid rock drainage will have a limited impact at Queensway. Nonetheless, there is some potential for neutral leaching of metals and metalloids from the waste rock. Kinetic test work is ongoing; however, preliminary results indicate tailings are net neutralizing and there is a limited metal(loid) leaching potential with more leaching potential from the Keats and Lotto tailings compared to the other prospects. There are potential water quality impacts from neutral to alkaline drainage, with the potential for arsenic and antimony mobilization to exceed relevant water quality limits. However, these elements can be controlled with the use of mitigation measures. The similarities in results between saturated columns and humidity cell tests suggest that sulphide oxidation is not a significant mechanism of metal release at the time of reporting. Instead, element release is primarily due to physical flushing.
Rehabilitation and closure of the open pits includes deposition of tailings commencing in Phase 2 in the Keats, Keats West and Iceberg pits where tailings will be water covered, limiting subsequent oxidation potential. Other pits are proposed to flood successively after they are mined out as part of progressive rehabilitation during operations and in closure to form pit lakes. Mine infrastructure will be removed in keeping with NL mining closure and rehabilitation planning requirements. Remaining mine rock stockpiles will be covered to limit infiltration and increase the proportion of non-contact runoff. Covers will include a growth medium to enhance vegetation growth on the stockpile to further enhance evapotranspiration, stabilize soils against erosion and act as a starting point for terrestrial ecosystem development.
5.13Capital and Operating Costs
The capital costs for the Queensway Gold Project are based on Q2 2025 estimates. The capital cost estimate corresponds with an Association of the Advancement of Cost Engineering Class 5 level of detail, with associated accuracy of -30% to +50%, and was developed by SLR Consulting. The Queensway Gold Project capital cost estimate is divided into different Phases and disciplines, as shown in Table 8.
55
Table 8: Overall Queensway Gold Project Capital Cost Estimate (C$ 000)
Discipline | Phase 1 | Phase 2 | Phase 3 | Sustaining | Total |
|---|---|---|---|---|---|
Capital Spend Period | Year 1 | Years 2 to 4 | Year 5 | Years 2 to 12 | LOM |
Mining | 47,749 | — | 104,162 | 321,365 | 473,276 |
Onsite Processing | — | 220,504 | | | 220,504 |
Onsite Infrastructure | 15,680 | 23,520 | | 4,000 | 43,200 |
Offsite Infrastructure | 40,497 | — | | | 40,497 |
Indirects/Owner’s Costs/EPCM | 19,906 | 109,750 | 10,000 | | 139,656 |
Contingency | 30,958 | 88,444 | 28,540 | | 147,942 |
Total | 154,790 | 442,218 | 142,702 | 325,365 | 1,065,075 |
In addition to the capital costs noted in the table above, closure costs, net of salvage value, are estimated to be C$30 million, occurring at the end of the Queensway Gold Project life. The phases of capital are described herein.
5.13.1Phase 1 Off-site Toll Milling
This phase of the Queensway Gold Project consists of access and establishment of the site, development of open pit mining, the refurbishment of an off-site toll mill, and relocation of power lines. Spending for Phase 1 occurs in Queensway Gold Project Year 1.
5.13.2Phase 2 On-site Processing Plant
Phase 2 capital spending includes the development of the on-site processing plant at Queensway, including some infrastructure not already developed in Phase 1, and the preparation of one of the mined out pits to receive tailings. Phase 2 spending occurs from Year 2 to Year 4, in advance of process plant start up in Year 5.
5.13.3Phase 3 Underground Mine
Phase 3 capital refers to the development of the underground mines at the Queensway Gold Project. Phase 3 capital will occur in Year 5.
5.13.4Sustaining Capital
Sustaining capital generally refers to capital spending that occurs after the initial period, and in this case, refers mostly to open pit mining (from Year 2 onward) and underground mining (from Year 6 onward). Within open pit mining, sustaining capital covers ongoing equipment purchases and lease payments, ongoing development of service roads and haul roads, clearing of future mining areas, the mobile maintenance shop, and surface water management. The underground mining sustaining capital costs refer to ongoing capital development. There is a nominal amount included for surface infrastructure sustaining capital, related to IPTSF operations.
5.13.5Operating Costs
Operating costs were estimated for the Queensway Gold Project and were developed based on first principles and comparisons against other existing mining operations. A summary of operating costs is shown in Table 9.
56
Table 9: Summary of Operating Costs (C$ 000)
Area | | Avg. Year 2 - Year 4 | Avg. Year 6 - Year 9 |
LOM | Toll Milling | Underground Mining | |
Mining (Open Pit) | 906,607 | 67,778 | 78,230 |
Mining (Underground) | 188,525 | — | 40,956 |
Third-Party Processing + Handling | 143,747 | 31,941 | — |
Processing | 549,501 | — | 53,232 |
G&A | 188,746 | 9,720 | 14,508 |
Subtotal | 1,977,125 | 109,440 | 186,925 |
| | | |
Treatment and Refining Charges | 262,412 | 701 | 29,941 |
Royalties | 19,774 | 1,093 | 2,030 |
Subtotal | 282,186 | 1,794 | 31,972 |
| | | |
Total | 2,259,312 | 111,234 | 218,897 |
5.13.6Cash Flow Analysis
SLR Consulting has prepared its own unlevered after-tax LOM cash flow model based on the information contained in the Queensway Technical Report to confirm the physical and economic parameters of the Queensway Gold Project. The model does not take into account financing costs. All costs are in Q2 2025 C$ dollars with no allowance for inflation. An after-tax cash flow summary is presented in Table 10.
57
Table 10: Annual After-Tax Cash Flow Summary
Economic Model Annual Summary | ||||||||||||||||||||
| Company New Found Gold Corp. | |||||||||||||||||||
Calendar Year | | | Year 1 | Year 2 | Year 3 | Year 4 | Year 5 | Year 6 | Year 7 | Year 8 | Year 9 | Year 10 | Year 11 | Year 12 | Year 13 | Year 14 | Year 15 | Year 16 | Year 17 | |
Project Timeline in Years | C$ & Metric Units | LoM Avg / Total | 1 | 2 | 3 | 4 | 5 | 6 | 7 | 8 | 9 | 10 | 11 | 12 | 13 | 14 | 15 | 16 | 17 | |
Market Prices | | | ||||||||||||||||||
Gold, Forecast | US$/oz | $2,500 | $2,500 | $2,500 | $2,500 | $2,500 | $2,500 | $2,500 | $2,500 | $2,500 | $2,500 | $2,500 | $2,500 | $2,500 | $2,500 | $2,500 | $2,500 | $2,500 | $0 | |
Physicals | | | ||||||||||||||||||
1) Open Pit | | | | | | | | | | | | | | | | | | | | |
Total Open Pit Resource Mined | kt | 26,303 | 1,401 | 2,131 | 4,223 | 2,921 | 1,772 | 1,813 | 2,311 | 2,036 | 1,973 | 1,736 | 1,625 | 1,498 | 863 | - | - | - | - | |
Total Waste Mined | kt | 158,328 | 9,444 | 10,075 | 11,989 | 14,077 | 15,133 | 14,442 | 14,516 | 14,671 | 15,044 | 14,161 | 13,108 | 7,739 | 3,931 | - | - | - | - | |
Total Material Mined | kt | 184,632 | 10,845 | 12,206 | 16,212 | 16,998 | 16,905 | 16,255 | 16,827 | 16,707 | 17,017 | 15,897 | 14,733 | 9,237 | 4,793 | - | - | - | - | |
2) Underground | | | | | | | | | | | | | | | | | | | | |
Total Underground Resource Mined | kt | 1,069 | - | - | - | - | - | 171 | 286 | 214 | 270 | 129 | - | - | - | - | - | - | - | |
Total Waste Mined | kt | 1,695 | - | - | - | - | 445 | 430 | 513 | 307 | - | - | - | - | - | - | - | - | - | |
Total Material Mined | kt | 2,765 | - | - | - | - | 445 | 600 | 800 | 521 | 270 | 129 | - | - | - | - | - | - | - | |
Stockpile - In | | 9,825 | 1,273 | 1,876 | 3,968 | 2,665 | - | - | 42 | - | - | - | - | - | - | - | - | - | - | |
Stockpile - Out | | 9,825 | - | - | - | - | 528 | 571 | - | 305 | 312 | 690 | 930 | 1,057 | 1,692 | 2,555 | 1,184 | - | - | |
Total Resource Processed | kt | 27,373 | 128 | 255 | 255 | 256 | 2,300 | 2,555 | 2,555 | 2,555 | 2,555 | 2,555 | 2,555 | 2,555 | 2,555 | 2,555 | 1,184 | - | - | |
Gold Grade | g/t | 1.85 | 12.54 | 12.28 | 9.99 | 8.13 | 3.55 | 2.43 | 2.52 | 1.62 | 1.54 | 1.13 | 1.01 | 1.15 | 0.77 | 0.52 | 0.52 | - | - | |
Contained Gold | koz | 1,626 | 51 | 101 | 82 | 67 | 262 | 200 | 207 | 133 | 127 | 93 | 83 | 94 | 63 | 43 | 20 | - | - | |
Average Recovery, Gold | % | 91.9% | 92.1% | 92.1% | 92.1% | 92.1% | 92.3% | 92.1% | 93.4% | 92.8% | 92.9% | 91.2% | 90.3% | 89.5% | 89.2% | 89.0% | 89.2% | - | - | |
Recovered Gold | koz | 1,494 | 47 | 93 | 75 | 62 | 242 | 184 | 193 | 124 | 118 | 84 | 74.90 | 84.46 | 56.36 | 37.99 | 17.63 | - | - | |
Processing by Plant | | | | | | | | | | | | | | | | | | | | |
1) Third Party Mill | | | | | | | | | | | | | | | | | | | | |
Mill Feed | kt | 1,150 | 128 | 255 | 255 | 256 | 256 | - | - | - | - | - | - | - | - | - | - | - | - | |
Au Grade | g/t | 9.64 | 12.54 | 12.28 | 9.99 | 8.13 | 6.73 | - | - | - | - | - | - | - | - | - | - | - | - | |
Contained Au | koz | 357 | 51 | 101 | 82 | 67 | 55 | - | - | - | - | - | - | - | - | - | - | - | - | |
2) Queensway Mill | | | | | | | | | | | | | | | | | | | | |
Mill Feed | kt | 26,223 | - | - | - | - | 2,044 | 2,555 | 2,555 | 2,555 | 2,555 | 2,555 | 2,555 | 2,555 | 2,555 | 2,555 | 1,184 | - | - | |
Au Grade | g/t | 1.51 | - | - | - | - | 3.15 | 2.43 | 2.52 | 1.62 | 1.54 | 1.13 | 1.01 | 1.15 | 0.77 | 0.52 | 0.52 | - | - | |
Contained Au | koz | 1,269 | - | - | - | - | 207 | 200 | 207 | 133 | 127 | 93 | 83 | 94 | 63 | 43 | 20 | - | - | |
Recovery by Process | | | | | | | | | | | | | | | | | | | | |
Third Party Toll Mill | % | | 92.1% | 92.1% | 92.1% | 92.1% | 92.1% | - | - | - | - | - | - | - | - | - | - | - | - | |
Queensway Mill – Dore | % | | - | - | - | - | 56.3% | 49.2% | 58.2% | 54.6% | 55.2% | 45.2% | 40.0% | 22.4% | 22.7% | 25.1% | 27.7% | - | - | |
Queensway Mill – Concentrate | % | | - | - | - | - | 36.1% | 42.9% | 35.2% | 38.2% | 37.7% | 46.0% | 50.3% | 67.0% | 66.5% | 63.9% | 61.5% | - | - | |
Recovered Gold by Process | | | | | | | | | | | | | | | | | | | | |
Third Party Toll Mill – Dore | koz | 328 | 47 | 93 | 75 | 62 | 51 | - | - | - | - | - | - | - | - | - | - | - | - | |
Queensway Mill – Dore | koz | 605 | - | - | - | - | 116 | 98 | 121 | 73 | 70 | 42 | 33 | 21 | 14 | 11 | 5 | - | - | |
Queensway Mill – Concentrate | koz | 561 | - | - | - | - | 75 | 86 | 73 | 51 | 48 | 43 | 42 | 63 | 42 | 27 | 12 | - | - | |
Recovered Gold | koz | 1,494 | 47 | 93 | 75 | 62 | 242 | 184 | 193 | 124 | 118 | 84 | 75 | 84 | 56 | 38 | 18 | - | - | |
Payable Gold | | | | | | | | | | | | | | | | | | | | |
Payable Gold, Dore | % | 99.9% | 99.9% | 99.9% | 99.9% | 99.9% | 99.9% | 99.9% | 99.9% | 99.9% | 99.9% | 99.9% | 99.9% | 99.9% | 99.9% | 99.9% | 99.9% | - | - | |
Payable Gold, Concentrate | % | 93.3% | - | - | - | - | 93.3% | 93.3% | 93.3% | 93.3% | 93.3% | 93.3% | 93.3% | 93.3% | 93.3% | 93.3% | 93.3% | - | - | |
Payable Gold, Dore | koz | 933 | 47 | 93 | 75 | 62 | 167 | 98 | 120 | 73 | 70 | 42 | 33 | 21 | 14 | 11 | 5 | - | - | |
Payable Gold, Concentrate | koz | 524 | - | - | - | - | 70 | 80 | 68 | 48 | 45 | 40 | 39 | 59 | 39 | 25 | 11 | - | - | |
Payable Gold, Total | koz | 1,456 | 47 | 93 | 75 | 62 | 237 | 178 | 188 | 120 | 114 | 82 | 72 | 80 | 54 | 36 | 17 | - | - | |
58
Cash Flow | | | |||||||||||||||||||
Gold Gross Revenue | 100% | C$000s | 5,205,967 | 169,251 | 332,005 | 269,701 | 220,072 | 847,507 | 637,417 | 673,468 | 430,429 | 408,869 | 291,789 | 257,761 | 286,808 | 191,460 | 129,296 | 60,133 | - | - | |
Gross Revenue Before By-Product Credits | 100% | C$000s | 5,205,967 | 169,251 | 332,005 | 269,701 | 220,072 | 847,507 | 637,417 | 673,468 | 430,429 | 408,869 | 291,789 | 257,761 | 286,808 | 191,460 | 129,296 | 60,133 | - | - | |
Gross Revenue After By-Product Credits | | C$000s | 5,205,967 | 169,251 | 332,005 | 269,701 | 220,072 | 847,507 | 637,417 | 673,468 | 430,429 | 408,869 | 291,789 | 257,761 | 286,808 | 191,460 | 129,296 | 60,133 | - | - | |
OP Mining Cost | | C$000s | (906,607) | (53,797) | (58,398) | (70,871) | (74,066) | (79,474) | (78,945) | (77,628) | (78,886) | (77,459) | (74,508) | (71,472) | (54,503) | (37,602) | (12,811) | (6,189) | - | - | |
UG Mining Cost | | C$000s | (188,525) | - | - | - | - | (1,500) | (32,238) | (47,389) | (38,915) | (45,283) | (23,200) | - | - | - | - | - | - | - | |
Third-Party Processing & Material Handling | | C$000s | (143,747) | (15,949) | (31,934) | (31,903) | (31,986) | (31,975) | - | - | - | - | - | - | - | - | - | - | - | - | |
Queensway Mill Processing | | C$000s | (549,501) | - | - | - | - | (45,263) | (53,232) | (53,232) | (53,232) | (53,232) | (53,232) | (53,232) | (53,232) | (53,232) | (53,232) | (25,152) | - | - | |
Site Support G&A Cost | | C$000s | (188,746) | (7,254) | (9,720) | (9,720) | (9,720) | (14,508) | (14,508) | (14,508) | (14,508) | (14,508) | (14,508) | (14,508) | (14,508) | (14,508) | (14,508) | (7,254) | - | - | |
TC/RC charges | | C$000s | (262,412) | (433) | (850) | (691) | (564) | (35,375) | (39,752) | (34,046) | (23,739) | (22,229) | (19,669) | (19,186) | (28,846) | (19,162) | (12,441) | (5,430) | - | - | |
Third Party Royalty | | C$000s | (19,774) | (675) | (1,325) | (1,076) | (878) | (3,249) | (2,391) | (2,558) | (1,627) | (1,547) | (1,088) | (954) | (1,032) | (689) | (467) | (219) | - | - | |
Subtotal Cash Costs Before By-Product Credits | | C$000s | (2,259,312) | (78,108) | (102,227) | (114,261) | (117,214) | (211,343) | (221,066) | (229,359) | (210,906) | (214,258) | (186,205) | (159,352) | (152,120) | (125,192) | (93,459) | (44,243) | - | - | |
Total Cash Costs After By-Product Credits | | C$000s | (2,259,312) | (78,108) | (102,227) | (114,261) | (117,214) | (211,343) | (221,066) | (229,359) | (210,906) | (214,258) | (186,205) | (159,352) | (152,120) | (125,192) | (93,459) | (44,243) | - | - | |
Operating Margin | 57% | C$000s | 2,946,655 | 91,143 | 229,778 | 155,440 | 102,858 | 636,165 | 416,352 | 444,109 | 219,523 | 194,611 | 105,584 | 98,409 | 134,688 | 66,268 | 35,837 | 15,890 | - | - | |
Off-site Other Operating Expenses | | C$000s | - | - | - | - | - | - | - | - | - | - | - | - | - | - | - | - | - | - | |
EBITDA | | C$000s | 2,946,655 | 91,143 | 229,778 | 155,440 | 102,858 | 636,165 | 416,352 | 444,109 | 219,523 | 194,611 | 105,584 | 98,409 | 134,688 | 66,268 | 35,837 | 15,890 | - | - | |
Depreciation Allowance | | C$000s | (781,792) | (46,567) | (18,486) | (13,593) | (121,501) | (151,820) | (113,809) | (85,330) | (63,991) | (48,000) | (36,016) | (27,033) | (20,300) | (15,251) | (11,466) | (8,627) | - | - | |
Earnings Before Taxes | | C$000s | 2,164,863 | 44,576 | 211,292 | 141,847 | (18,643) | 484,344 | 302,543 | 358,779 | 155,532 | 146,611 | 69,568 | 71,376 | 114,388 | 51,016 | 24,371 | 7,263 | - | - | |
NFLD Mining tax | | C$000s | (262,510) | (1,546) | (23,752) | (16,229) | - | (66,636) | (37,348) | (44,166) | (15,705) | (19,675) | (7,205) | (7,030) | (15,805) | (5,900) | (1,511) | - | - | - | |
Federal & Provincial Income Tax | | C$000s | (461,091) | (9,904) | (42,887) | (30,962) | 14,434 | (116,563) | (59,090) | (72,317) | (28,955) | (36,534) | (17,736) | (18,169) | (28,837) | (13,535) | (6,858) | (2,179) | 9,000 | - | |
Net Income | | C$000s | 1,441,262 | 33,126 | 144,654 | 94,656 | (4,209) | 301,146 | 206,105 | 242,296 | 110,871 | 90,401 | 44,627 | 46,177 | 69,746 | 31,581 | 16,002 | 5,084 | 9,000 | - | |
Non-Cash Add Back - Depreciation | | C$000s | 781,792 | 46,567 | 18,486 | 13,593 | 121,501 | 151,820 | 113,809 | 85,330 | 63,991 | 48,000 | 36,016 | 27,033 | 20,300 | 15,251 | 11,466 | 8,627 | - | - | |
Working Capital | | C$000s | - | - | - | - | - | - | - | - | - | - | - | - | - | - | - | - | - | - | |
Operating Cash Flow | | C$000s | 2,223,054 | 79,693 | 163,140 | 108,249 | 117,293 | 452,966 | 319,914 | 327,626 | 174,862 | 138,401 | 80,643 | 73,210 | 90,046 | 46,832 | 27,468 | 13,711 | 9,000 | - | |
Phase 1 - Initial Capital | | $000s | (154,790) | (154,790) | - | - | - | - | - | - | - | - | - | - | - | - | - | - | - | - | |
Phase 2 - Queensway Plant Growth Capital | | C$000s | (442,218) | - | (50,086) | (191,166) | (200,966) | - | - | - | - | - | - | - | - | - | - | - | - | - | |
Phase 3 - UG Growth Capital | | C$000s | (142,702) | - | - | - | - | (142,702) | - | - | - | - | - | - | - | - | - | - | - | - | |
Sustaining Capital | | C$000s | (325,365) | - | (44,585) | (22,411) | (29,472) | (29,165) | (68,229) | (73,557) | (43,309) | (5,154) | (3,242) | (3,782) | (2,459) | - | - | - | - | - | |
Closure/Reclamation Costs | | C$000s | (30,000) | - | - | - | - | - | - | - | - | - | - | - | - | - | - | - | (30,000) | - | |
Total Capital | | C$000s | (1,095,075) | (154,790) | (94,671) | (213,577) | (230,437) | (171,867) | (68,229) | (73,557) | (43,309) | (5,154) | (3,242) | (3,782) | (2,459) | - | - | - | (30,000) | - | |
Cash Flow Adj./Reimbursements | | C$000s | - | - | - | - | - | - | - | - | - | - | - | - | - | - | - | - | - | - | |
LoM Metrics | | | |||||||||||||||||||
Economic Metrics | | | | | | | | | | | | | | | | | | | |||
a) Pre-Tax | | | | | | | | | | | | | | | | | | | |||
Free Cash Flow | | C$000s | 1,851,580 | (63,647) | 135,106 | (58,136) | (127,579) | 464,297 | 348,123 | 370,552 | 176,214 | 189,457 | 102,342 | 94,627 | 132,229 | 66,268 | 35,837 | 15,890 | (30,000) | - | |
Cumulative Free Cash Flow | | C$000s | | (63,647) | 71,460 | 13,323 | (114,256) | 350,042 | 698,165 | 1,068,717 | 1,244,931 | 1,434,387 | 1,536,730 | 1,631,357 | 1,763,585 | 1,829,853 | 1,865,690 | 1,881,580 | 1,851,580 | 1,851,580 | |
NPV @ 5% | | C$000s | 1,273,981 | | | | | | | | | | | | | | | | | | |
NPV @ 8% | | C$000s | 1,031,855 | | | | | | | | | | | | | | | | | | |
IRR% | | | 128.1% | | | | | | | | | | | | | | | | | | |
b) After-Tax | | | | | | | | | | | | | | | | | | | | | |
Free Cash Flow | | C$000s | 1,127,978 | (75,097) | 68,468 | (105,328) | (113,145) | 281,099 | 251,685 | 254,069 | 131,553 | 133,247 | 77,401 | 69,428 | 87,587 | 46,832 | 27,468 | 13,711 | (21,000) | - | |
Cumulative Free Cash Flow | | C$000s | | (75,097) | (6,629) | (111,957) | (225,101) | 55,997 | 307,682 | 561,751 | 693,305 | 826,552 | 903,953 | 973,380 | 1,060,967 | 1,107,800 | 1,135,267 | 1,148,978 | 1,127,978 | 1,127,978 | |
NPV @ 5% | | C$000s | 742,631 | | | | | | | | | | | | | | | | | | |
NPV @ 8% | | C$000s | 583,456 | | | | | | | | | | | | | | | | | | |
IRR% | | 56.3% | | | | | | | | | | | | | | | | | | ||
Operating Metrics Sales Metrics | | | |||||||||||||||||||
| | | |||||||||||||||||||
59
SLR Consulting prepared a LOM unlevered after-tax cash flow model to confirm the economics of the Queensway Gold Project over the LOM. Economics have been evaluated using the discounted cash flow (“DCF”) method by considering LOM production on a 100% basis, annual processed tonnages, and gold grades. The associated metal recoveries, metal prices, operating costs, treatment and refining charges, initial and sustaining capital costs, reclamation and closure costs, and income tax and royalties were also considered in the DCF.
The base discount rate assumed in the Queensway Technical Report is 5% as per New Found Gold corporate guidance. Discounted present values of annual cash flows are summed to arrive at the Queensway Gold Project Base Case net present value (“NPV”). The Internal Rate of Return (“IRR”) is also calculated, given the Queensway Gold Project is under development considering Phase 1, Phase 2 and Phase 3 investments, and with initial gold production targeted for 2027 pending regulatory approval.
The economic analysis of the Queensway Gold Project’s Base Case confirms that the Queensway Gold Project’s Mineral Resources have reasonable prospects for economic extraction at a LOM price of US$2,500/oz Au, and that further advancement of Queensway Gold Project studies is warranted.
The Queensway Gold Project’s Base Case undiscounted pre-tax net cash flow is approximately C$1,852 million and the undiscounted after-tax net cash flow is approximately C$1,128 million.
The Queensway Gold Project Base Case pre-tax NPV at a 5% discount rate is approximately C$1,273 million and the Base Case after-tax NPV at a 5% discount rate is approximately C$743 million. The Base Case pre-tax IRR is 128% and the after-tax IRR is 56%.
The World Gold Council adjusted operating cost is US$1,085/oz Au. The mine life sustaining capital cost is US$171/oz Au, for an all in sustaining cost of US$1,256/oz Au. The mine average annual gold production during the LOM is approximately 99,600 oz.
On a pre-tax, undiscounted basis, the payback of Phase 1 of the Queensway Gold Project occurs within one year of expenditures, and the payback of Phase 2 also occurs within one year of expenditures. On an after-tax undiscounted basis, positive cumulative cashflow is achieved within one year of completion of Phase 2 expenditures.
5.14 Exploration, Development and Production
The QPs recommend that the Queensway Gold Project proceed to undertake a Preliminary Feasibility Study while simultaneously converting Inferred Mineral Resources into the Indicated category through an exploration drilling program and conducting field investigations that support key design inputs of the Queensway Gold Project plan. The QPs make the following recommendations by area.
5.14.1 Geology and Mineral Resources
| 1. | Conduct additional trenching, channel sampling, and detailed mapping to continue to improve structural modelling and refine mineralization wireframe interpretations. |
| 2. | Continue exploring while balancing potential with cost-effectiveness, focusing efforts on: (a)infill drilling within the pit shells to convert unclassified material to Inferred Resource and, where drill density permits, to upgrade Inferred material to the Indicated category in support of future economic studies; (b) near-surface expansion along the AFZ and JBPFZ; (c) extensions of open underground reporting panels at depth and along strike; and (d) deep drilling in the AFZ Core to follow up widely spaced high grade intercepts. |
| 3. | Consider targeted closely spaced RC or diamond drilling in areas that are expected to have the greatest impact on early LOM production. |
60
| 4. | Consider completing a closely spaced drill program focusing on grade continuity followed by an updated MRE to target material representative of the Phase 1 mining and processing conditions. |
| 5. | Conduct test work to acquire more spatially representative wax-coated water immersion density measurements for the various rock types. |
| 6. | In conjunction with the future metallurgical test work outlined in Section 13.7 of the Queensway Technical Report, consider the development of a geometallurgical model, if warranted, to account for recovery variability and support process planning for future technical evaluations beyond the PEA stage. |
| 7. | Continue to evaluate the geological and grade continuity of mineralized vein wireframe interpretations hosted within or extending into the modelled AFZ structure. |
| 8. | Continue assaying samples with multielement ICP as it helps support both lithology interpretation as well as mineralized wireframe interpretation and could support a future geometallurgical model. |
5.14.2Mining
Open Pit Mining
| 1. | Evaluate different bench heights. All pits have been designed with five metre operating bench heights, however, in some higher elevations of the pits it may be possible to mine waste rock on 10 m high benches, which is more cost effective and may facilitate higher pit sinking rates in term of vertical metres per year. This is considered a project opportunity that has not been incorporated into the base case mine plan. |
| 2. | Adhere to a strict grade control program to achieve good control of dilution. Higher than expected dilution would have a negative impact on project economics. |
| 3. | Examine the possibility of backfilling mined out pits. Backfilling is not proposed in this PEA, however, it is considered an opportunity for future mine planning once the full extent of the Mineral Resources has been defined. |
| 4. | Complete a geotechnical site investigation program that includes additional geotechnical core drilling and sample collection for laboratory testing, to further assess rock mass conditions and structural orientations in the next phase of the study. A geotechnical study has not yet been completed for the Queensway Gold Project. |
| 5. | Complete geochemical characterization of waste rock and economic mineralized material prior to the start of mining operations, with the findings used to guide waste rock management strategies and understand tailings geochemistry. Barren rock and uneconomic mineralized material should be classified as either potentially acid- generating (“PAG”) or non-acid-generating (“non-PAG”) waste rock. A comprehensive study is advised to assess the potential presence and volume of PAG material within the planned mining limits. At this stage, no waste volumes by category have been estimated. |
| 6. | Conduct further hydrogeological and hydrological site characterization, taking seepage and runoff management requirements into account. |
Underground Mining
| 1. | Conduct a geotechnical study to determine the rock mass characteristics of the site. The study will help determine the appropriate mining methods. |
61
| 2. | Increase exploration drilling at depth, based on the identified mineable material, to potentially increase inventory. |
| 3. | Increase diamond drilling to convert Inferred Resources to Indicated Resources. |
| 4. | The deposits are narrow and steeply dipping. Dilution control will be critical to the success of the operation. Upon completion of the geotechnical program, validate the consolidation requirements of the backfill to minimize dilution in the sill and help prevent hanging wall failure over the height of the mineable areas. Unconsolidated backfill may compress and allow for hanging wall movement, which may cause failures. |
5.14.3Mineral processing
| 1. | Conduct test work to evaluate the production of a saleable sulphide concentrate containing gold, building on the preliminary flotation test work already completed. Sulphide flotation could be employed before or after cyanide leaching (which would require cyanide destruction prior to flotation), and both of these options should be evaluated in test work and in a subsequent trade-off study to determine which would be the preferrable option. |
| 2. | While initial test work focused on the gravity concentration-CIL flowsheet, the poor recovery of refractory gold using this flowsheet, particularly for low grade material and Keats West samples, necessitated the inclusion of sulphide flotation in the flowsheet. Focus future test work on supporting the gravity concentration-sulphide flotation-flotation tails leaching flowsheet. This will include process optimization and variability test work using samples representative of spatial and grade distribution of material in the mine plan, and which will also support the future declaration of Mineral Reserves. |
| 3. | Conduct sulphide oxidation test work on flotation concentrates to assess their amenability to this technique to support trade-off studies evaluating the technical and economic characteristics of different sulphide oxidation technologies. |
| 4. | Continue the pre-aeration step in future CIL testing. |
| 5. | Coordinate future sample selection and test work with the development of a geological model that includes additional species such as cyanide soluble gold, sulphur, arsenic, iron, and organic carbon, and that will provide detailed information on gold grade distribution within the various zones. Additionally, the development of mine plans during more advanced stages of study should be used to ensure that samples selected for test work represent material that would be processed in a mill. |
5.14.4Infrastructure
| 1. | Engage with the various owners of the three transmission lines and one fibreoptic line that require relocation to determine next steps in selecting modified routes. |
| 2. | Engage with NL Power and NL Hydro to determine the feasibility of utilizing one of the transmission lines to provide power to the site. |
| 3. | Develop a detailed electrical load list and site power distribution schematic as part of future studies. |
| 4. | Carry out geotechnical and hydrogeological investigations around the three pits that form the IPTSF (i.e., Iceberg, Keats W/N, and Keats) to characterize the overburden, bedrock, and groundwater conditions to support advancing the IPTSF design. |
| 5. | Conduct borrow source investigations to identify and characterize suitable sources of construction materials. |
62
| 6. | Develop a site-wide water balance model that accounts for all project flows including pit dewatering. |
5.14.5Environment, Permitting, and Social/Community Engagement
| 1. | Continue environmental baseline work including geochemical testing, water resources, fisheries, and other work required to complete provincial and federal environmental assessment requirements. |
| 2. | Proceed to development of water management plans, on-site tailings management plans, and mine rock management plans to reduce and mitigate potential negative environmental impacts. |
| 3. | Continue regulator and stakeholder engagement leading into EA and permitting to build trust, gain input, ensure compliance, and achieve social licence to proceed with the Queensway Gold Project. |
5.14.6Capital and Operating Costs
It is recommended that capital and operating costs be updated and refined as part of the overall recommendation to advance the Queensway Gold Project to the next level of study.
WSP Canada Inc., (“WSP”) was commissioned by Maritime, a wholly owned subsidiary of New Found Gold to prepare a PEA and Technical Report in compliance with NI 43-101 for its 100% owned Hammerdown Gold Project, located in the north-central portion of the island of Newfoundland in the Province of Newfoundland and Labrador on the east coast of Canada. The Hammerdown and Orion deposits are located approximately 95 km by road from Pine Cove, which includes a permitted and operating processing plant and tailings facility. Commercial production at the Hammerdown deposit is expected to be achieved in H2/26. The Stog’er Tight deposit is located on the Pine Cove property, 4 km east of Pine Cove. The Company’s 100% owned flagship Queensway Gold Project is located approximately 270 km by road from Pine Cove and approximately 15 km west of the town of Gander. The Hammerdown Technical Report documents all data and data collection procedures for the Hammerdown Gold Project up until the Resource database closure on June 16, 2025. The Hammerdown Technical Report is titled “NI 43-101 Technical Report, Hammerdown Gold Project, Newfoundland and Labrador, Canada.” The Hammerdown Technical Report was filed on March 17, 2026 and has an effective date of February 18, 2026.
The Qualified Persons for the Hammerdown Technical Report are:
| ● | William Richard McBride, P.Eng., WSP Canada Inc., responsible for Introduction, Market Studies and Contracts, compiling of Capital and Operating Costs, Economic Analysis. |
| ● | Dachun (David) Jin, P.Eng., WSP Canada Inc., responsible for Project Infrastructure, Electrical and Water Management Capital Costs. |
| ● | Stephen Coates, P.Eng., Evomine Consulting Inc., responsible for Mineral Reserve Estimate, Mining Methods, Project Infrastructure, Subsection for haul roads and stockpiles, LOM Plan, Mining Capital and Operating Costs. |
| ● | Christian Beaulieu, P.Geo., Minéralis Consulting Services Inc., responsible for Property Description and Location, Accessibility, Climate, Local Resources, Infrastructure, and Physiography, History, Geological Setting and Mineralization (Hammerdown deposit), Deposit Types (Hammerdown deposit) Exploration (Hammerdown deposit), Drilling (Hammerdown deposit), Sample Preparation, Analyses, and Security (Hammerdown deposit), Data Verification (Hammerdown deposit only), MRE (Hammerdown deposit), Adjacent Properties. |
63
| ● | Michael Levy, P.Eng., JDS Energy & Mining Inc. responsible for Geotechnical Analysis and Slope Design Parameters for Hammerdown, Orion and Stog’er Tight deposits open pits. |
| ● | Chafana Hamed Sako, P.Geo., Norda Stelo Inc., responsible for Geological Setting and Mineralization (Orion deposit), Deposit Types (Orion deposit), Exploration (Orion deposit), Drilling (Orion deposit), Sample Preparation, Analyses, and Security (Orion deposit), Data Verification (Orion deposit), MRE (Orion and Stog’er Tight deposits). |
| ● | James Guiraud, P.Geo., Norda Stelo Inc., responsible for Geological Setting and Mineralization (Stog’er Tight deposit), Deposit Types (Stog’er Tight deposit), Exploration (Stog’er Tight deposit), Drilling (Stog’er Tight deposit), Sample Preparation, Analyses, and Security (Stog’er Tight deposit), Data Verification (Stog’er Tight deposit). |
| ● | Stacy J. Freudigmann, P.Eng., Canenco Consulting Corp., responsible for Mineral Processing and Metallurgical Testing, Recovery Methods, Sorting and Crushing Plant Capital and Operating Costs. |
| ● | Sheldon H. Smith, P.Geo., Stantec Consulting Ltd., responsible for Property Description and Location - Subsection for environmental risks and liabilities, Mining Methods - Subsection for hydrogeology and geochemistry, Environmental Studies, Permitting, and Social or Community Impact, Closure Costs. |
| ● | J. Alex Mcintyre, P.Eng., Knight Piesold Ltd., responsible for Project Infrastructure - Subsection for tailings, Environmental Studies, Permitting, and Social or Community Impact - Subsection for closure, TSF Operating Costs. |
| ● | Neil J. Lincoln, P.Eng., Lincoln Metallurgical, Inc., responsible for Recovery Methods - input, Mill Capital and Operating Costs, general and administrative (“G&A”) costs, Haulage. |
The scientific and technical information in this section relating to the Hammerdown Gold Project is derived from, and in some instances is a direct extract from, and is based on the assumptions, qualifications and procedures set out in, the Hammerdown Technical Report. Such assumptions, qualifications and procedures are not fully described in this section and the following summary does not purport to be a complete summary of the Hammerdown Technical Report. Reference should be made to the full text of the Hammerdown Technical Report, which is available for review under New Found Gold’s profile on SEDAR+ at www.sedarplus.ca and on EDGAR at www.sec.gov. Capitalized terms used but not otherwise defined in this section have the meanings given to such terms in the Hammerdown Technical Report.
The technical content disclosed in this section was reviewed and approved by the authors of the Hammerdown Technical Report, each a Qualified Person as defined in NI 43-101.
6.2Property Description, Location and Access
The Hammerdown Gold Project comprises two 100%-owned mineral properties, the Hammerdown Property near Springdale and the Pine Cove Property on the Baie Verte Peninsula in north-central Newfoundland and Labrador, Canada. The properties are located approximately 40 km apart and share centralized processing infrastructure at the Pine Cove Mill. The Trans-Canada Highway runs along the southern boundary of the Hammerdown Property, and nearby communities include King’s Point and Springdale (Hammerdown) and Ming’s Bight and Baie Verte (Pine Cove).
The Hammerdown Property consists of 24 mineral licences comprising 1,595 claims and four mining leases covering approximately 39,875 ha. It includes the Green Bay, Whisker Valley, and Gull Ridge blocks, with the Hammerdown and Orion deposits located within the Green Bay block. The Pine Cove Property comprises nine mineral licences totaling 191 claims and eight mining leases covering approximately 4,775 ha and includes the Pine Cove mill complex, the Stog’er Tight deposit, and the historic Argyle deposit.
64
The licence descriptions and mining leases are presented in Table 11 and Table 12. All mineral licences and mining leases are held 100% by New Found Gold, either directly or through its wholly owned subsidiary Maritime, following completion of a plan of arrangement in November 2025.
Table 11: Hammerdown Property mineral licence description and status by blocks
Block | Licence | License Holder | No. | Area | Issue Date | Renewal | | Expenditure | |
|---|---|---|---|---|---|---|---|---|---|
Green Bay | 015580M | Maritime | 4 | 100 | 2006-11-02 | 2026-11-02 | | $ | 5,417.58 |
024055M | Maritime | 10 | 250 | 2016-08-01 | 2026-08-01 | | | — | |
024057M | Maritime. | 2 | 50 | 2016-08-01 | 2026-08-01 | | | — | |
024058M | Maritime | 1 | 25 | 2016-08-01 | 2026-08-01 | | | — | |
031858M | Maritime | 92 | 2300 | 2021-01-14 | 2031-01-14 | | | — | |
034273M | Maritime | 6 | 150 | 2022-04-14 | 2027-04-14 | | | — | |
034928M | Maritime | 88 | 2200 | 2013-06-24 | 2028-06-24 | | $ | 66,013.20 | |
034984M | Maritime | 76 | 1900 | 2019-11-07 | 2029-11-07 | | | — | |
036218M | Maritime | 99 | 2475 | 2015-10-22 | 2030-10-22 | | $ | 140,927.63 | |
036393M | Maritime | 55 | 1375 | 2006-11-02 | 2026-11-02 | | | — | |
038139M | Maritime | 11 | 275 | 2016-08-01 | 2026-08-01 | | $ | 10,900.10 | |
038140M | Maritime | 46 | 1150 | 2016-05-05 | 2026-05-05 | | $ | 14,224.71 | |
Gull Ridge | 032151M | Maritime | 82 | 2050 | 2021-03-13 | 2026-03-13 | | $ | 42,815.50 |
032291M | Maritime | 41 | 1025 | 2021-04-04 | 2026-04-04 | | $ | 13,202.00 | |
036865M | Maritime | 6 | 150 | 2023-12-14 | 2028-12-14 | | | — | |
038116M | Maritime | 2 | 50 | 2019-02-05 | 2029-02-05 | | | — | |
038117M | Maritime | 256 | 6400 | 2019-02-05 | 2029-02-05 | | | — | |
Whisker Valley | 023006M | Maritime | 61 | 1525 | 2005-01-21 | 2027-01-21 | | $ | 122,000.00 |
026547M | Maritime | 1 | 25 | 2018-10-29 | 2028-10-29 | | | — | |
025040M | Maritime | 5 | 125 | 2017-05-11 | 2027-05-11 | | $ | 441.50 | |
038141M | Maritime | 199 | 4975 | 2015-06-30 | 2030-06-30 | | | — | |
038142M | Maritime | 219 | 5475 | 2015-03-06 | 2030-03-06 | | | — | |
038143M | Maritime | 213 | 5325 | 2019-09-11 | 2029-09-11 | | $ | 243,668.84 | |
039435M | Maritime | 20 | 500 | 2025-08-02 | 2030-08-02 | | $ | 4,000.00 | |
Table 12: Pine Cove Property mineral license description and status
Property | License | License Holder | No. | Area | Issue Date | Renewal | | Expenditure | |
|---|---|---|---|---|---|---|---|---|---|
Pine Cove | 007513M | Maritime. | 3 | 75 | 2000-06-05 | 2026-06-05 | | $ | 13,322.99 |
008014M | Maritime | 10 | 250 | 2001-05-28 | 2026-05-28 | | | — | |
013261M | Maritime | 3 | 75 | 2007-03-29 | 2027-03-29 | | | — | |
015523M | Maritime | 4 | 100 | 2002-08-02 | 2026-08-02 | | | — | |
019308M | Maritime | 1 | 25 | 2011-09-12 | 2026-09-12 | | | — | |
020405M | Maritime | 1 | 25 | 2012-09-03 | 2027-09-03 | | $ | 587.72 | |
023292M | New Found Gold | 9 | 225 | 2015-09-10 | 2030-09-10 | | | — | |
040022M | Maritime | 63 | 1575 | 2005-12-22 | 2025-12-22 | | $ | 126,000.00 | |
040023M | Maritime. | 97 | 2425 | 2005-12-22 | 2025-12-22 | | $ | 194,000.00 | |
Mineral tenure is administered by the Government of Newfoundland and Labrador, with licences maintained in good standing through required assessment expenditures and renewal fees. Minimum expenditures for ongoing assessment, in which the province requires licence-holders to spend a minimum amount on their exploration activities each year. These minimum expenditure commitments increase with time, as summarized in Table 13. As of early 2026, the combined minimum exploration expenditure commitment for the properties is approximately $1.0 million. Table 14 shows the renewal fee per claim for each of the five-year intervals. These fees are due every five years from Year 5 through Year 20, and then annually from Year 21 onward.
65
Table 13: Minimum expenditures for mineral claims in Newfoundland and Labrador
Year | | Required Expenditure | |
|---|---|---|---|
1 | | $ | 200.00/Claim |
2 | | $ | 250.00/Claim |
3 | | $ | 300.00/Claim |
4 | | $ | 350.00/Claim |
5 | | $ | 400.00/Claim |
6 to 10 | | $ | 600.00/Claim |
11 to 15 | | $ | 900.00/Claim |
16 to 20 | | $ | 1,200.00/Claim |
21 to 25 | | $ | 2,000.00/Claim |
26 to 30 | | $ | 2,500.00/Claim |
31 Onward | | $ | 3,000.00/Claim |
Table 14: Renewal fees for mineral claims in Newfoundland and Labrador
Year | | Renewal Fee | |
5 | | $ | 25.00/Claim |
10 | | $ | 50.00/Claim |
15 | | $ | 100.00/Claim |
20 Onward | | $ | 200.00/Claim |
The Project benefits from existing mining leases, surface rights, and established infrastructure. The Hammerdown Property contains active mining leases and associated surface leases supporting site infrastructure, while the Pine Cove Property hosts the permitted Pine Cove processing plant, in-pit tailings storage facility, and access to the Port Rousse deep-water port. Certain areas of the properties are subject to net smelter return (NSR) royalties and other royalty interests, generally ranging from 1% to 3% NSR on applicable deposits.
New Found Gold currently has mining leases that cover 710.9 ha and 371.4 ha of surface leases in the vicinity of the Hammerdown deposit on the Hammerdown Property. Across the Pine Cove Property, New Found Gold currently has mining leases that cover 1,177.4 ha and 491.1 ha of surface leases that encompass the historic Pine Cove Mine and Mill and Argyle deposit, and the Stog’er Tight deposit along with other advanced historic mineral prospects on the Pine Cove Property. On an as-needed basis, New Found Gold negotiates agreements that allow exploration activities to be conducted on property owned and administered by others.
To the best of the Qualified Person’s knowledge, there are no significant legal, title, environmental, or access issues that would materially affect the Company’s ability to conduct exploration, development, or mining activities on the Project.
66
Figure 2: Location map of the Hammerdown Gold Project, comprising the Hammerdown and Pine Cove properties in north-central Newfoundland; inset map of the Island of Newfoundland
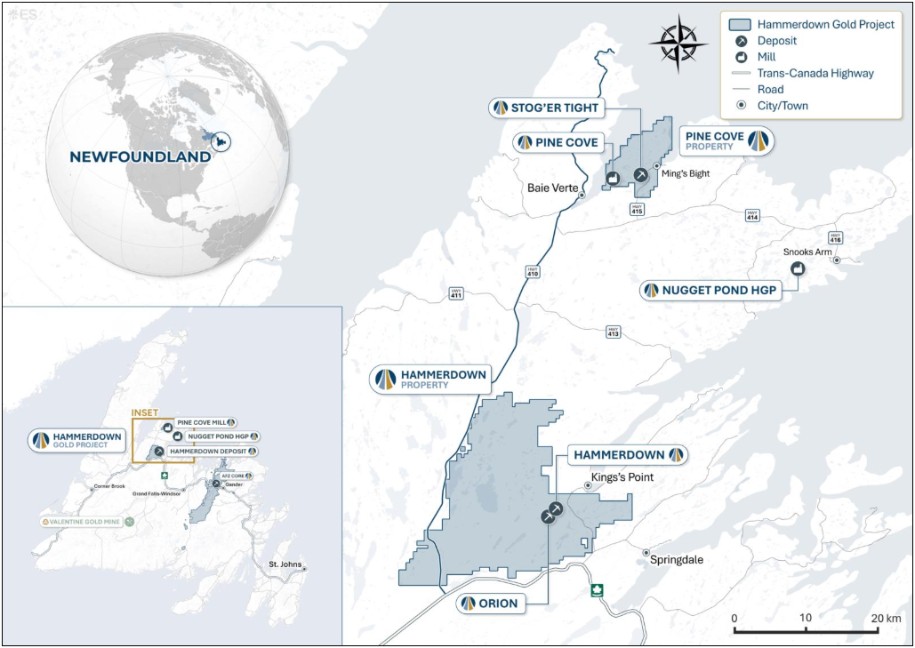
6.2.1 | Royalties |
A summary of all royalties applicable to the Hammerdown and Pine Cove Properties is provided in Table 15 and
Table 16. Net smelter return (“NSR”) royalties applicable to licences subject to gold production in this PEA range from 1% to 3.0%. Royalties as they related to mining leases only are summarized in the text that follows.
Hammerdown Property
Commander Resources Ltd. originally held a 2% NSR royalty on the Hammerdown deposit and a series of surrounding claims, excluding the Orion Mining Lease. Maritime Resources Corp. held the right to acquire a 50% interest in this royalty prior to the commencement of commercial production. On September 17, 2020, Maritime exercised this early buy-down right at a mutually agreed reduced consideration of $750,000, resulting in Commander retaining a 1% NSR royalty.
In 2024, Commander Resources Ltd. sold its royalty portfolio, including the remaining 1% NSR royalty applicable to the Hammerdown Deposit and broader Green Bay assets, to TMRF Canada Inc. As a result of this transaction, TMRF Canada Inc. is the sole holder of the Commander-originated NSR royalty interests affecting the Hammerdown Deposit and associated Commander Claims.
During 2016, there were 21,070,000 royalty units sold for $0.01 per unit for gross proceeds of $210,700 in connection with project financing activities. The purchasers of the 2016 offerings were provided the option
67
to purchase royalty units that would return 100% of the original investment made by the purchasers paid out of production from the Company’s Green Bay project (“the Project”). Total royalties payable from the Royalty Units (“Royalty Payment”) are capped at $3,160,500, an amount equal to the total equity units and royalty units purchased. Royalty payments will be made annually beginning on the first anniversary of the date of commencement of commercial production for the Project. Royalty Payments will be funded solely from 10% of annual net cash flow from the Project, with net cash flow representing net production revenues realized from the Project after deduction of all Project operating and debt servicing costs.
In summary, the Hammerdown deposit is subject to a 1% NSR royalty and the Orion deposit is not subject to any royalty payment.
Table 15: Summary of the existing royalty agreements related to the Hammerdown Gold Property
Deposit/ | Parties | Mining | Royalty details | AOI | Payable |
|---|---|---|---|---|---|
Green Bay | Inomin Mines Inc. (“Optionor”, formerly, Inovent Capital Inc.), Maritime Resources Corp. (“Optionee”), and Dean Fraser (“Existing Royalty Holder”) | This relates to current active mineral licences: 36393M (predecessor mineral licences: 15847M and 25391M), 34928M (predecessor mineral licence: 21789M), 38140M (predecessor mineral licences: 23899M, 23904M, 23953M, 23958M, 23959M, and 24037M), 38139M (predecessor mineral licence: 24056M), 24057M and 24058M, And AOI licences (as confirmed by Unregistered Addendum dated September 15, 2011, and made between Inomin Mines Inc., and Maritime Resources Corp.): 038143M (predecessor mineral licence: 31227M), 38117M (predecessor mineral licence: 26826M), 34984M (predecessor mineral licences: 27455M, 27458M, and 27452M), and 31858M. | Royalty Details: Additional Information: | Being within 3km of the perimeter of the Property (as defined therein) as constituted on the date of the Option exercise, but excluding the Rambler Property (as defined therein) | Inomin Mines |
Green Bay | Inovent Capital Inc. (“Inovent”), and Dean Fraser (“Fraser”) | Relates to current active mineral licences 36393M (predecessor mineral licences: 12676M, 12677M, 12678M, 15847M, and 19770M), 24055M, 38139M (predecessor | Royalty Details: | Nil | Dean Fraser |
68
Deposit/ | Parties | Mining | Royalty details | AOI | Payable |
| | mineral licence: 24056M), 24057M, 24058M, 34928M (predecessor mineral licence: 21789M), 38140M (predecessor mineral licences: 23899M, 23958M, 23904M, 23953M, 24037M, and 23959M) | 1.5% of the right, title and interest of Fraser in and to the NSR, leaving Fraser with 1% of the NSR. Inovent to pay Fraser $1,000,000 for same. | | |
Hammerdown / Green Bay | BMB Capital Corp. (“Optionee”) and Commander Resources Ltd. (“Optionor”) | Option and Royalty Agreement over current active mineral licence 36393M (predecessor mineral licences: 15579M and 15581M), 15580M, and current active mining lease 191 (11294M), and current active mining lease 227 (9813M), and current active mining lease 237 (15579M) | Royalty Details: | 2km of the outermost boundary of the Property as at the date of execution of the Agreement | Royalty transferred to TMRF Canada Limited (see: Vol. 38, Fol. 220, dated 2024 05 07) |
Sprucy Pond | United Gold Inc. (“Optionor”), G2B Gold Inc. (“Optionor”, and together with United Gold Inc., the “Optionors”), and Maritime Resources Corp. (“Optionee”) | This relates to current active mineral licence: 34984M (predecessor mineral licence: 27452M) | Royalty Details: | Nil | Payable To: |
El Strato | United Gold Inc. (“Optionor”), and Maritime Resources Corp. (“Optionee”) | This relates to current active mineral licence: 38141M (predecessor mineral licences: 25038M, 25075M, and 24917M) | Royalty Details: | Nil | United Gold Inc. |
Strugglers Pond | Chris Pilgrim (“Optionor”), and Maritime Resources Corp. (“Optionee”) | This relates to current active mineral licence: 38142M (predecessor mineral licence: 23130M) | Royalty Details: | Nil | Chris Pilgrim |
69
Deposit/ | Parties | Mining | Royalty details | AOI | Payable |
| | | any time up to 2-years after the commencement of Commercial Production of the Property, or any portion thereof, one-half of the NSR (1%), upon payment to the Optionor of $1,000,000 | | |
Whisker Valley | Maritime Resources Corp. (the “Optionee”), and Daniel Jacobs, Wayne Hurley, Kenneth Lewis, | This relates to current active mineral licences: 38141M (predecessor mineral licences: 23184M, 23185M, 24586M, 24585M, 24005M, 24518M, 24006M, and 24007M) 38142M (predecessor mineral licences: 23519M, 23186M, 22986M, 23508M, 24519M, 24516M) 23006M | Royalty Details: | “Property” (including “After-Acquired Property” (as defined therein)) within 3km of the perimeter of the Property on the date of Option exercise. | Daniel Jacobs, Wayne Hurley, Kenneth Lewis, Jason Flight, Cathy Earle (Estate of Frank Pollett), Frank Gill, Peter Hurley |
Whisker Valley | Jason D. White (“Optionor”), and Maritime Resources Corp. (“Optionee”) | This relates to current active mineral licence 25040M. | Royalty Details: | Nil | Jason D. White |
70
Deposit/ | Parties | Mining | Royalty details | AOI | Payable |
| | | the Optionor of $500,000 | | |
Whisker Valley | Maritime Resources Corp. (“Purchaser”), and William Stockley, Mark Stockley, and Stephen Stockley (collectively, the “Vendors”) | This relates to current active mineral licence: 38142M (predecessor mineral licence: 23128M). | Royalty Details: | Nil | William Stockley (1/3rd), Mark Stockley (1/3rd) & Stephen Stockley (1/3rd) |
Green Bay | Maritime Resources Corp. and Multiple Investors | ML# 191 (11294M), ML# 227(9813M), 011182M, 015579M -> Lease 237, 015580M, 015581M, 021169M, 021170M, 021171M, 023417M, 023418M, 023419M, 023420M, 023421M, 023422M | Royalty Payments will be funded solely from 10% of annual net cash flow from the Green Bay Project, with net cash flow representing net production revenues realized from the Project after deduction of all Project operating and debt servicing costs. Total royalties payable from the Royalty Units are capped at $3,160,500. | Nil | |
Pine Cove Property
Mining Lease 193-B, associated with the Stog’er Tight mine area, is subject to a 3% NSR royalty payable to 1512513 Alberta Ltd., with an option to purchase 1.8% of the NSR for $1,000,000.
Mining leases associated with the historic Argyle deposit, including Mining Leases 240 and 243, are subject to a 3% NSR royalty payable to Herb Froude and Tenacity Gold Mining Company Ltd.
A Net Profits Interest (“NPI”) agreement over the Pine Cove mining Leases 149 and 189 with Royal Gold Inc. whereby the Company is required to pay Royal Gold Inc. 7.5% of net profits, calculated as the gross receipts generated from the claims less all cumulative development and operating expenses.
A $3,000,000 capped NSR on two mineral exploration licences in the Pine Cove Property, which forms part of the historic Argyle deposit, is calculated at 3% when the average price of gold is less than US$2,000 per ounce for the calendar quarter and is 4% when the average price of gold is more than US$2,000 per ounce for the calendar quarter.
A $3,000,000 capped NSR of 3% on a property that forms part of the historic Argyle deposit. Once the aggregate limit has been met and 200,000 ounces of gold has been sold from the property, the NSR decreases to 1%.
71
Table 16: Summary of existing royalty agreements related to the Pine Cove Gold Property
Deposit/ Property | Parties | Mining | Royalty Details | AOI | Payable To |
|---|---|---|---|---|---|
Argyle | Anaconda Mining Inc. (“ANX”) | Relates to current active mineral licence 26993M (predecessor mineral licence: 15582M and 18617M), and current active mining leases: 240 (26993M), 243 (26993M), and 245 (26993M). | Royalty Details: | Nil | Alex (Sandy) Duffitt & Paul Strong |
Argyle | Anaconda Mining Inc. (“ANX”), Fair Haven Resources Inc. (“FH”), and Fair Haven Shareholders (“FHS”) | Relates to current active mineral licences 26993M (predecessor mineral licences: 16477M, 18621M, 18664M, 18925M, 18926M, 18927M, and | Royalty Details: | Nil | Fair Haven Resources Inc. |
Argyle | Anaconda Mining Inc. (“ANX”) Herb M. Froude (“Froude”) | Relates to current active mineral licence 26993M (predecessor | Royalty Details: | Nil | Herb Froude |
72
Deposit/ Property | Parties | Mining | Royalty Details | AOI | Payable To |
| | mineral licence: 20060M), and current active mining leases: 240 (26993M), 243 (26993M), and 245 (26993M). | NSR, if the Payor subsequently produces and sells more than 200,000 Oz from the Licenses, then the Froude NSR shall be reduced to 1% of Net Smelter Returns payable to the Payee for the incremental Oz of gold produced and sold from the Licenses over and above 200,000 Oz of gold from the Licenses | | |
Argyle | Anaconda Mining Inc. (“ANX”) & Tenacity Gold Mining Company Ltd. (“Tenacity”) | Mineral licenses 7513M, 15523M, and 26993M (predecessor mineral licences: 12433M, and 15808M), and current active mining leases 240(26993M), 243(26993M), and 245(26993M) | Royalty Details: 3% NSR increased to 4% if average gold price exceeds $2,000 USD/Oz. | Nil | Tenacity Gold Mining Company Ltd. |
| Victor A. French (“French”), and Fair Haven Resources Inc. (“FH”) | Relates to current active mineral licences 26993M (predecessor mineral licences 16477M, 18621M, and 18664M), and current active mining leases: 240 (26993M), 243 (26993M), and 245 (26993M) | Royalty Details: | Nil | Victor A. French |
| Triple Nine Resources Ltd. (“Triple Nine”), and Fair Haven Resources Inc. (“FH”) | Relates to current active mineral licence 26993M (predecessor mineral licence: 20060M), and current active mining leases: 240 (26993M), 243 (26993M), and 245 (26993M). | Royalty Details: | Nil | Triple Nine Resources Inc. |
73
Deposit/ Property | Parties | Mining | Royalty Details | AOI | Payable To |
Corkscrew / Big Bear | Anaconda Mining Inc. (“ANX”) & Seaside Realty Ltd. (“Seaside”) | Relates to current active ML #226 (10238M). | Royalty Details: | Nil | Seaside Realty |
Deer Cove | Anaconda Mining Inc. (“ANX”) & 1512513 Alberta Ltd. (“Alberta”) | Relates to current active mineral licences 8014M, 26993M (predecessor mineral licence: 20509M), and current active mining leases: 240 (26993M), 243 (26993M), 244 (8014M), and 245 (26993M) | Royalty Details: | Nil | 1512513 Alberta Ltd. |
Pine Cove | International Corona Corporation (“Vendor”), and Novagold Resources Inc. (“Purchaser”) | ML 149(2663M) & ML 189(11299M) | Royalty Details: | Nil | Transferred to RGLD Gold Canada, Inc. via Vol. 26, Folio 42 Registered 2008 11 27, see also Vol. 38, Folio 182 Registered 2023 11 22 wherein a declaration was registered confirming that RGLD Gold Canada Inc., RG Exchangeco Inc., and 7550359 Canada Inc. amalgamated resulting in RG Exchangeco Inc., which continued under the CBCA as RG Exchangeco ULC, which then amalgamated |
74
Deposit/ Property | Parties | Mining | Royalty Details | AOI | Payable To |
| | | | | with International Royalty Corporation under the CBCA under the same name. As such, International Royalty Corporation is now the holder of the International Corona NPR |
| Varna Gold Inc. (“Varna”), Dearin Geological Consulting Ltd. (“Dearin”), Zagora Resources Inc. (“Zagora”), 327884 Alberta Ltd. (“327884”), South Coast Resources Inc. (“South Coast”) | Relates to current active mining lease 149 (2633), and mining lease 189 (11299M) | Royalty Details: | 1km radially distant of any boundary or property listed in Schedule “C” which is developed by Varna, Dearin, Zagora, 327884, or their successors, assigns, or nominees | Tenacity Holdings Inc. |
Stog’er Tight East Mining Lease | Anaconda Mining Inc. (“ANX”) & 1512513 Alberta Ltd. (“Alberta”) | Mining lease 193-B | Royalty Details: | Nil | 1512513 Alberta Ltd. |
6.2.2 | Environmental Liabilities |
Environmental liabilities have been documented at the Pine Cove, Hammerdown, and Stog’er Tight sites, including historical disturbances, localized exceedances in surface water, sediment, and groundwater, and performance considerations related to existing water management and tailings infrastructure. At Pine Cove, existing tailings and water management infrastructure includes High hazard and Significant hazard dams, with recent inspections noting nonfunctioning instrumentation and limitations in deformation monitoring.
75
Baseline programs at Hammerdown have identified elevated aluminum and other metals in surface water, localized sediment exceedances downstream of historical workings, and dissolved metal exceedances in groundwater. Longterm monitoring at Stog’er Tight has recorded episodic exceedances of guideline values, and future development of the Gabbro Pit and Pit 278 will require management of pond water level changes and associated regulatory authorizations.
6.2.3 | Permits |
Hammerdown, Stog’er Tight, and Pine Cove have each completed provincial environmental assessment (EA) and were released from the process, and none have triggered federal EA requirements. Orion may require a new EA registration before development. Stog’er Tight, currently in care and maintenance, will require updated plans and approvals before mining resumes, including for Pit 278. Pine Cove is permitted to process ore and place tailings in the open pit, but modifications to Pine Cove require permitting updates. Future approvals remain subject to regulatory review and potential public or stakeholder input.
6.3 | Accessibility, Climate, Local Resources, Infrastructure and Physiography |
The Hammerdown Gold Project is located in north-central Newfoundland and Labrador, Canada, and comprises the Hammerdown Property (Green Bay, Gull Ridge and Whisker Valley blocks) near Springdale and the Pine Cove Property on the Baie Verte Peninsula. These properties collectively form the Hammerdown Gold Project (the Project). Both properties are serviced by the same regional transportation infrastructure, including paved provincial highways and a common regional airport. The Deer Lake Regional Airport located approximately 120–150 km southwest of the project area by road, provides year-round scheduled commercial air service and represents the primary air transportation hub for personnel and freight accessing the Project. Ground access to both property areas is provided via the Trans-Canada Highway and an interconnected network of provincial highways.
The Hammerdown Property is primarily serviced by the community of Springdale, located approximately 5 km east of the project area. Springdale has a population of approximately 2,800 people and is a well-established industrial service community with a long history supporting mining, forestry, and heavy industrial operations. The community provides essential services including healthcare and emergency response, in addition to municipal infrastructure. Regional air access is provided by the Deer Lake Regional Airport, located approximately 120 km southwest of Springdale.
The Town of Baie Verte serves as the primary regional service centre for the Pine Cove Property area and provides access to a regional hospital, accommodations, restaurants, banking services, vehicle maintenance, and heavy-equipment suppliers. Baie Verte and surrounding communities supply a well-trained and experienced workforce with direct familiarity in mining and industrial operations. New Found Gold holds the surface rights over the Pine Cove Mill and associated tailings storage facilities, as well as the surface rights within the Argyle and Stog’er Tight mining leases, all of which are located within the Pine Cove Property area. The historic mine site is connected to the provincial power grid and is equipped with limited backup power generation for essential services. The site also includes the Port Rousse deep-water port facility, capable of berthing Panamax-class vessels and supporting the shipment of ores, aggregates, concentrates, and providing direct marine access for bulk materials and equipment.
The region experiences a northern temperate climate with cool summers (average ~16°C) and moderately cold winters (average ~–8°C), and annual precipitation exceeding 1,000 mm. Climatic conditions permit year-round exploration and mining operations, with winter snowfall and reduced daylight representing typical but manageable seasonal factors.
The property areas are in north-central Newfoundland and share broadly similar physiographic characteristics. Topography is controlled by a northeast-trending plateau dissected by major valleys and fault-controlled escarpments, resulting in localized elevation contrasts. Vegetation is typical boreal forest with local bogs and ponds, and overburden thickness is variable.
76
6.4 |
The Hammerdown Property is located within the Baie Verte Mining District of Newfoundland and Labrador, a region with a long history of base and precious metal exploration and mining dating back to the mid-1800s. Modern gold exploration on the Green Bay block began in the mid-1980s, culminating in the discovery of the Hammerdown and Rumbullion deposits in 1988 by Noranda Exploration Company Ltd. and its joint venture partner, Major General Resources Ltd. Subsequent exploration programs through the 1990s included soil geochemistry, geophysics, trenching, and diamond drilling, which further defined the deposits and led to the discovery of additional zones, including Orion.
Between 1988 and 2004, multiple operators completed approximately 673 diamond drill holes totaling approximately 59,563 m on the property prior to Maritime’s involvement. Exploration and delineation drilling supported the advancement of the project to production under Richmont Mines Inc.
Richmont developed and operated the Hammerdown deposit between 2000 and 2004 using both open pit and underground mining methods. During this period, approximately 290,180 tonnes were milled at an average head grade of 15.74 g/t Au, resulting in total gold production of 142,998 ounces. Ore was transported for processing at the Nugget Pond mill located approximately 140 km from the site.
In 2025, Maritime recommenced development activities at Hammerdown, with ore processed at the Pine Cove Mill. Following the acquisition of Maritime by New Found Gold Corp. in November 2025, the Project is being advanced toward renewed commercial production. The combination of historical production, extensive drilling, and modern technical studies provides a strong foundation for the current development program.
The Pine Cove Property (formerly the Point Rousse Project) has a long exploration and mining history dating back to the early 1900s, beginning with limited production at the Goldenville occurrence. Modern exploration intensified in the mid-1980s, leading to the discovery and delineation of the Pine Cove, Stog’er Tight, Argyle, and Deer Cove deposits. Multiple operators conducted geochemical surveys, trenching, drilling, bulk sampling, and technical studies prior to development.
Anaconda Mining Inc. (later Signal Gold Inc.) advanced the Pine Cove deposit through feasibility studies, construction, and production beginning in 2008, achieving commercial production in 2009. Mining and processing operations between 2009 and 2023 included material from Pine Cove, Stog’er Tight, and Argyle. Over this period, approximately 3.99 Mt were milled at an average grade of 1.50 g/t Au at the Pine Cove Property (including Pine Cove, Stog’er Tight and Argyle deposits), resulting in total gold production of approximately 192,376 ounces. Ore from these deposits was processed at the Pine Cove Mill, which served as the central processing facility for the property.
In 2025, Maritime recommissioned the Pine Cove processing plant, initially using stockpiled material before transitioning to primary Hammerdown run-of-mine ore later that year. Following the acquisition of Maritime by New Found Gold in November 2025, the Pine Cove infrastructure continues to support the broader Hammerdown Gold Project.
6.5 |
6.5.1 | Regional Geology |
The Newfoundland Appalachians record a complex history involving the collision of multiple outboard exotic terranes to the Laurentian margin from the Ordovician to Devonian during the closure of the Iapetus and Rheic oceans and the assembly of Pangea. Based on distinct lithological, structural, geochronological, fauna and metallogenic characteristics, the island of Newfoundland is divided into four tectonostratigraphic zones: Humber, Dunnage, Gander, and Avalon zones, separated from one another by major faults.
77
6.5.2 | Hammerdown Deposit |
The Hammerdown Property is situated within the Notre Dame Subzone east of the Baie Verte line (BVL). It is transected by three significant fault zones that are spatially associated with gold and base metal mineralization in the project area. The property is subdivided into three blocks, Green Bay, Whisker Valley, and Gull Ridge, each characterized by distinct lithologies and mineralization styles. The Green Bay block hosts the Hammerdown and Orion deposits, which are the most significant gold zones defined on the property to date.
The Hammerdown deposit is hosted within the Hammerdown Deformation Zone (HDZ), a major high-strain structural corridor developed along the contact between mafic ophiolitic rocks and felsic volcanic rocks of the Catchers Pond Group. Gold mineralization occurs within the Hammerdown–Rumbullion–Muddy Shag vein system, comprising stacked quartz–sulphide veins localized over a ~250 m wide segment of the 1.8 km long HDZ. At depth, the vein system is truncated by the north-dipping Captain Nemo Fault, which is interpreted as a key structural control on mineralization and potential exploration targets.
Mineralization consists of quartz veins containing 5–20% pyrite with minor base metals, with gold occurring primarily as fine grains within sulphides. Gold grade correlates strongly with sulphide content. Quartz-feldspar porphyry dykes are closely associated with the main veins and locally host low-grade mineralization, while surrounding mafic volcanic rocks are generally barren.
The Hammerdown, Rumbullion and Muddy Shag zones comprise narrower, structurally controlled veins with good continuity, while the Wisteria Zone in the footwall hosts broader, lower grade disseminated mineralization associated with sericite and sulphide alteration.
6.5.3 | Orion Deposit |
The Orion deposit is hosted within the Hammerdown Deformation Zone (HDZ) and form a satellite deposit belonging to the same mineralized trend and style than the Hammerdown deposit. The Orion gold deposit is hosted by strongly deformed metavolcanics and metasedimentary units of the Ordovician Catchers Pond Group that have been thrust to the northwest along the Horsehead Fault. The intersection of the Horsehead Fault with the Orion vein system likely controls a NE plunging ore shoot in the lower part of the system. The mineralization is spatially associated with QFP dykes that correlate with those at the Hammerdown deposit and in mafic dykes and sills. Three principal mineral zones are recognized at Orion: Discovery, Main, and EMS. Mineralization consists of centimetric quartz-calcite veins systems with pyrite dissemination and minor amounts of other sulphides. The Discovery and Main zone extend for around 950 m along strike and are hosted within a sericitized felsic schist. The EMS Zone is smaller with a strike of 350 m and hosted in graphitic/cherty sedimentary unit.
6.5.4 | Stog’er Tight Deposit |
The Pine Cove Property, located approximately 6 km northeast of the town of Baie Verte, Newfoundland, is underlain by Cambro–Ordovician ophiolitic and volcano-sedimentary sequences belonging to the Point Rousse Complex and the Snooks Arm Group of the Notre Dame Subzone. These units occur east of the BVL, a regional first-order structure interpreted to exert primary control on gold mineralization. Second-order ENE-trending thrust faults, including the Scrape, Goldenville, and Deer Cove thrusts, further localize mineralized corridors and associated prospects throughout the Property. Three principal mineralized corridors are present on the Property: the Scrape Trend, Goldenville Trend, and Deer Cove Trend and host orogenic type gold deposits and prospects. The Scrape Trend represents the principal mineralized corridor on the Pine Cove Property, containing the Pine Cove, Stog’er Tight, and Argyle deposits.
The Stog’er Tight deposit is hosted by Fe-Ti–oxide–rich gabbroic sills within volcanic and volcaniclastic rocks of the Bobby Cove Formation. The Stog’er Tight deposit consists of a dense and a complex vein system of several generations where their geometry has been affected by subsequent deformation phases.
78
Gold mineralization is associated with a zoned alteration halo up to 40 m thick developed in the gabbroic sills with pyrite dissemination developed in the immediate veins wall rock. The highest gold grades at Stog’er Tight are associated with coarse, mottled pyrite. Mineralized sills contain at least three discontinuous mineralized zones 2-10 m thick, extending from 500 to 400 m along strike over 100 to 150 m down dip.
The Argyle deposit shares similar geological characteristics with the Stog’er Tight deposit including the gabbroic sill host rock, alteration type, and vein systems with pyritization in the immediate veins wall rock. The Pine Cove Deposit occurs in a series of mineralized lenses situated 50–200 m above the Scrape Thrust and hosted primarily within altered basalts of the Venam’s Bight Formation, greywackes of the Bobby Cove Formation, and gabbroic intrusions. Gold is predominantly present as microscopic inclusions within pyrite developed in multi-generational quartz-chlorite-calcite±albite breccia veins, with localized dissemination in porous sedimentary wall rocks.
The gold deposits at the Pine Cove Property are typical of orogenic gold deposits well represented by Stog’er Tight, Argyle and Pine Cove deposits and several prospects such as Anoroc, Animal Pond, Pumbly Point, Corkscrew-Big Bear, Goldenville and Deer Cove forming the three mineralized trends. Historically, the region has also the potential to host VMS style deposit (e.g. Rambler Deposit).
6.6 |
6.6.1 | Hammerdown Deposit |
Gold mineralization at the Hammerdown deposit occurs as structurally controlled quartz veins hosted by Ordovician metavolcanic and metasedimentary rocks of the Catchers Pond Group. The style of veining, alteration, host rocks, and structural setting is characteristic of orogenic (historically termed mesothermal), volcanic hosted (greenstone belt) lode gold deposits.
6.6.2 | Orion Deposit |
Gold mineralization at the Orion deposit occurs as structurally controlled quartz veins hosted by Ordovician metavolcanic and metasedimentary rocks of the Catchers Pond Group. The style of veining, alteration, host rocks, and structural setting is characteristic of orogenic (historically termed mesothermal), volcanic hosted (greenstone belt) lode gold deposits.
6.6.3 | Stog’er Tight Deposit |
Mineralization at the Stog’er Tight deposit is structurally controlled by the rheological contrast between the gabbroic sills and the surrounding rocks, which favor vein formation and precipitation of gold-bearing pyrite due to their high Fe-Ti oxides content. Considering these characteristics, the type of alteration and the strong relationship between mineralization and highly deformed rocks, the Stog’er Tight deposit can be classified as a Paleozoic example of a subclass of orogenic gold deposit (historically referred to as mesothermal) hosted in layered gabbroic sills.
6.7 |
6.7.1 | Hammerdown Property |
Maritime has held the Hammerdown Property, including the Hammerdown and Orion deposits, since 2010 and has undertaken continuous systematic exploration focused on delineating mineralization along the HDZ belonging to the Green Bay block and evaluating regional targets on the Whisker Valley and Gull Ridge blocks.
Since 2010, Maritime has focused on resource delineation and step-out drilling around the Hammerdown and Orion deposits. Programs included channel sampling, infill drilling, and drilling along strike extensions,
79
reducing geological uncertainty and supporting updated MREs. Step-out drilling delineated additional mineralized zones including Muddy Shag, Rumbullion, and Wisteria and expanded mineralization at advanced prospects northeast of Hammerdown, such as Golden Anchor, Lochinvar, Beetle Pond, and Harrys Brook.
Maritime’s regional exploration programs were primarily focussed on the Whisker Valley and Gull Ridge blocks. Exploration in these areas included mapping, prospecting, soil and rock sampling, trenching, and ground geophysics.
Exploration on the Whisker Valley block, from 2015 to 2019 identified the Gary Vein system, a 1.1 km long vein system with mineralized trenches and quartz–sulphide veins and local visible gold. Soil anomalies and IP chargeability responses corroborate mineralization, and diamond drilling confirmed significant gold grades to depths of ~150 m. The system remains open along strike and at depth. On the El Strato and Middle Arm Fault Trend, the compilation and reinterpretation of geological data indicate mineralization is associated with the structural interaction of the BVL and the Middle Arm Fault. Soil sampling and trenching along the fault consistently identify anomalous gold values, indicating a broader structurally controlled mineralized corridor. In the Kings Point corridor, located within the Kings Point Volcanic Complex, early exploration identified the Fluorite Zone, interpreted as an alkaline-type epithermal system. Ground IP surveys and subsequent drilling (2023) returned anomalous molybdenum and gold values, warranting continued evaluation.
On the Gull Ridge block, the exploration was limited to the surface geochemical soil sampling and geophysical surveys followed by a limited drilling program returning positive but not economic values.
Maritime completed multiple soil and rock sampling surveys, supplemented by large legacy datasets at the Hammerdown Property scale. The consolidated database includes 35,058 soil samples and 4,888 rock samples. Soil sampling was conducted on reconnaissance grids with fire assay and multi-element ICP analysis, while rock sampling targeted mineralized or prospective material from outcrop, float, subcrop, and trenches.
Maritime conducted a range of airborne and ground geophysical programs to refine structural interpretations and support target generation: Ground magnetics over Hammerdown–Orion corridor (2016); IP surveys at Whisker Valley on the Gary Vein prospect (2019); Volterra 3D IP survey targeting on the Hammerdown deposit extensions and an airborne magnetic–radiometric–VLF survey across Green Bay, Whisker Valley, and Gull Ridge blocks (2019); Property-scale VTEM, ZTEM, airborne IP, and magnetics and a multiple ground IP surveys and pulse EM follow-up on conductive anomalies (2021).
The Hammerdown property hosts multiple areas with significant exploration potential across the Green Bay, Whisker Valley, Gull Ridge blocks. In the Green Bay block, the Orion Main Zone remains open down-plunge and represents a priority target for resource expansion. Additional potential exists within the Golden Anchor–Lochinvar–Beetle Pond corridor, with a favourable structural environment for gold and polymetallic mineralization. In the Whisker Valley block, the Gary Vein and Kings Point Corridor warrants additional drilling to assess continuity and to confirm the epithermal potential in this area. The El Strato and Middle Arm Fault remains underexplored. The Gull Ridge block has seen the least amount of exploration but based on current understanding, the area is prospective for magmatic Ni–Cu–Co–PGE mineralization and Fe–V–Ti systems. Further geophysical surveys, including gravity and electromagnetic methods, are suggested to refine targets.
6.7.2 | Pine Cove Property |
Signal Gold/Anaconda completed extensive exploration across the Pine Cove Property prior to its 2023 acquisition by Maritime, advancing multiple deposits and prospects along the Scrape, Goldenville, and Deer Cove trends. Work included geological mapping, surface geochemistry, trenching, extensive grid-based geophysics, and systematic drilling programs, later incorporated into Maritime’s database following the 2023 acquisition.
80
From 2012 to 2015, work included airborne DIGHEM surveys, data compilation, and drilling at Pine Cove, Romeo and Juliet, Deer Cove, and Stog’er Tight. Between 2015 and 2017, exploration shifted to systematic evaluation of regional trends with rock sampling, trenching, ground IP, and drilling at key deposits. From 2019 to 2022, geophysical targeting and drilling focused on chargeability anomalies across Corkscrew–Big Bear, Animal Pond, and Goldenville, with mixed results but improved stratigraphic and structural interpretation.
The Pine Cove database includes 32,953 soil samples and 11,009 rock samples. Soil surveys used reconnaissance spacings, B-horizon sampling, and fire assay/ICP analysis. Rock sampling was selective and included outcrop, channel, float, and subcrop media. These datasets support district-scale target generation.
Signal Gold completed extensive airborne and ground geophysics, including: DIGHEM airborne magnetic–EM survey (2012); LiDAR survey (2018); ground IP and magnetics surveys at Argyle, Deer Cove, and Pine Cove East (2016–2018); ground IP (OreVision®) surveys to targeting Animal Pond, Corkscrew–Big Bear, and Goldenville prospects (2021–2022).
The Deer Cove Trend includes one of the most extensive soil anomalies in the district, though historical datasets require modern validation. The historic Pine Cove Mine remains open at depth, supported by recent resampling that returned long intervals of gold mineralization. The Balcony Zone (Romeo and Juliet prospect) also remains untested since 2013 and is considered a priority target for trenching and drilling.
6.8 |
6.8.1 | Hammerdown Deposit |
At the Hammerdown deposit and as of the Resource database closure on June 16, 2025, a total of 103,491 m of drilling and channel sampling has been completed in 1,362 drill holes and channels, of which Maritime completed 43,180 m in 666 drill holes. Since acquiring the Property in 2012, Maritime has conducted diamond drilling at Hammerdown using Springdale Forest as the drilling contractor. Drill collars were initially located using handheld or differential GPS and surveyed upon completion using NAD83 UTM coordinates. Drill holes follow historical naming conventions reflecting target areas (e.g., MP, MS, HDGC, BB). Drill pads were constructed using heavy equipment, and hole orientation (azimuth and dip) was established using compass, clinometer, and, where required, Reflex APS systems. Downhole surveys were completed at 30 m intervals using a Reflex multi-shot tool. Drill core was boxed, sealed, and transported daily to the core facility for logging and storage. Core was reconstructed, measured, and logged into the MX Deposit database, including recovery and RQD data. Sampling intervals (typically 0.20 m to 1.20 m) were selected and marked by the geologist, recorded digitally, and tagged prior to cutting. All core was photographed and securely stored, with aluminum identification tags affixed to each core box to ensure proper documentation and chain of custody.
Maritime has conducted extensive exploration, definition, and grade control programs at the Hammerdown deposit, and adjacent and regional targets between 2012 and 2025, systematically advancing the project from early drilling and surface sampling through detailed grade control in support of mine development.
Overall, the progression of work from reconnaissance drilling and surface sampling through dense grade control drilling has substantially de risked the Hammerdown deposit, supported near term mine development planning, and identified new target opportunities for additional resource expansion within and adjacent to the current mine plan.
6.8.2 | Orion Deposit |
At the Orion deposit and as of the MRE database closure on June 16, 2025, a total of 38,244 m of drilling has been completed in 177 drill holes, including 23,818 m completed by Maritime in 121 drill holes. The first drilling campaign conducted by Maritime on the Hammerdown Property was at Orion. For the Orion
81
deposit, Maritime used the same drilling protocols and chain of custody as those used for the Hammerdown deposit.
The first drilling campaign conducted by Maritime on the Hammerdown Project was at Orion, which began in 2011 with 14 NQ diameter drill holes totaling 3,687 m. Additional drilling was completed in 2020 (44 holes, 5,566 m) and 2021 (50 holes, 12,803 m), significantly expanding and refining the deposit. A further 13 NQ diameter drill holes totaling 1,763 m were completed in 2022. Collectively, Maritime’s drilling programs have substantially increased data density and improved the geological and mineralization models for the Orion deposit.
Drilling and channel sampling data generated by Maritime and previous operators have been compiled into the Maritime drill hole database, which includes surface drilling, underground drilling, and channel sampling data. The drill hole database was used to inform geological interpretation and to construct mineralization wireframes representing the vein and disseminated mineralization that comprise the Hammerdown and Orion deposits which form the basis of the MREs presented in subsequent sections.
6.8.3 | Stog’er Tight Deposit |
At the Stog’er Tight deposit and as of the resource database closure on June 16, 2025, a total of 38,619 m of drilling has been completed in 707 drill holes, including 26,284 m drilled by Signal/Anaconda in 522 drill holes between 2014 and 2021. Drilling at Stog’er Tight included diamond drilling and percussion drilling programs designed to delineate the mineralized system, confirm its extents, and support mine planning and development.
Diamond drilling programs, as reported by Signal Gold, were completed using track- and skid-mounted diamond drill rigs, with core sizes varying by program and time period. Recent drilling programs were carried out using NQ-sized diamond drilling, with HQ core utilized locally under challenging ground conditions or for geotechnical purposes. Drill collars were surveyed using differential GPS and recorded using Newfoundland MTM Zone 2 and UTM Zone 21 (NAD83) coordinates. Downhole surveys were collected at regular intervals using Reflex E-Z Shot. Core was retrieved daily and transported to a centralized facility for detailed geological and geotechnical logging, including lithology, structure, alteration, mineralization, RQD, and recovery measurements. Sampling was completed using half-core methods over intervals typically ranging from 0.5 m to 1.0 m. Samples were placed in sealed bags, grouped into rice bags, and transported by Signal Gold personnel to Eastern Analytical Ltd. (Springdale, NL) for analysis. As part of the QA/QC program, certified reference material and crushed blank samples were inserted in the sampling stream at a nominal frequency of 1 in 25 for both types. After sampling and logging the remaining core is stored on metal racks at the exploration site.
Between 2016 and 2020, a total of 3,356.3 m of percussion drilling in 184 drill holes was completed by Signal/Anaconda are designated BNP-YY-###. Percussion holes were drilled vertically using dry drilling methods by NFLD Hard Rok Inc. of Corner Brook, NL. Drill rods measured 3.66 m in length, and samples were collected at 0.91 m intervals, yielding four samples per rod. At each interval, cuttings were discharged into a clean bucket, and a representative sample (~2.5 kg) was collected using a clean scoop and placed into a labelled sample bag. Drill hole identification and corresponding sample intervals were recorded in a sample log, and grouped into sealed, labelled rice bags for transport. Collar locations were marked with labelled stakes upon completion and later surveyed using the same GPS methodology applied to the diamond drilling programs. As part of the QA/QC program, certified reference materials and coarse blanks were inserted at approximately 1 in every 25 samples. All percussion samples were transported directly by Signal Gold personnel to Eastern Analytical Ltd. in Springdale, NL for assay.
Collectively, total recent drilling at Stog’er Tight (excluding blast holes) comprises 26,284 m in 522 drill holes. Drilling completed between 2020 and 2021 effectively confirmed the limits of the Stog’er Tight mineralized system and validated the placement of planned mine infrastructure. The 2021 condemnation drilling program did not identify any new significant mineralized zones. The most recent drilling data (2021–2022) reinforced the existing geological and resource models without requiring modification. No further
82
drilling was completed at the Stog’er Tight Deposit after December 2021. This recent drilling, together with compiled historic drilling, formed the basis for prior Mineral Resource and Mineral Reserve estimates and supported mine development at the Stog’er Tight site.
6.9 |
6.9.1 | Hammerdown Deposit |
Exploration data supporting the current MRE for the Hammerdown and Pine Cove properties were generated under multiple operators and consolidated following the acquisition of Maritime and its subsidiaries by New Found Gold. Historical and current analytical work was primarily conducted by Eastern Analytical Ltd., an ISO/IEC 17025 accredited and independent laboratory located in Springdale, Newfoundland. Based on a review of available certificates and documentation, sample preparation and analytical methodologies used by previous operators are consistent with those applied during Maritime’s programs, supporting the comparability of historical and current assay data.
Drill core and channel samples were geologically logged, photographed, and securely transported to the laboratory by company personnel. Sample preparation procedures included crushing to 80% passing -10 mesh, splitting to 250 g, and pulverizing to 95% passing 150 mesh. Gold and silver analyses were conducted by 30 g fire assay with atomic absorption (AA) finish, with re-analysis of over-limit samples following dilution. Sample security protocols included sealed sample bags and rice sacks, with seal checks upon laboratory receipt. Drill core is stored in secure facilities in Newfoundland.
A formal QA/QC program has been in place for drilling completed from 2017 through database closure (June 16, 2025) for the Hammerdown deposit. The program includes systematic insertion of blanks, certified reference materials (CRMs), and duplicate samples at an overall rate of approximately one control sample per 10 routine samples. Blank results indicate minimal contamination, although recent elevated blank values warrant continued monitoring. CRM performance demonstrates generally acceptable accuracy, with minor negative bias observed in certain standards during specific periods; more recent data show improved performance. Duplicate sampling (field, coarse reject, and pulp) indicates acceptable precision, although most duplicates represent lower-grade material and the QP recommends targeting higher-grade mineralization in future programs.
The Qualified Person for the Hammerdown deposit considers the sample preparation, analytical procedures, security measures, and QA/QC results to be appropriate for use in Mineral Resource estimation. While minor issues such as recent blank elevated values and localized CRM bias have been identified, these are not considered material to the integrity of the database. Recommendations include continued QA/QC monitoring, incorporation of umpire laboratory analyses, and consideration of gravimetric finishes for high-grade gold samples to further strengthen analytical validation.
6.9.2 | Orion Deposit |
Since acquiring the Orion deposit, Maritime has completed the majority of drilling on the property and has applied sample preparation, analytical methods, and QA/QC procedures consistent with those used at the Hammerdown Deposit, utilizing the same laboratories and security protocols.
The QA/QC protocols implemented during the 2011 and 2020-2022 drilling programs at the Orion deposit were reviewed by the Qualified Persons. The procedures for sample preparation, analytical work, and security were consistent with those applied historically on the project and remain compliant with the requirements of National Instrument 43-101 and accepted industry standards. The QA/QC program incorporated the routine insertion of certified reference materials (CRMs), coarse blank material, and duplicate samples at a nominal rate of one control sample per 10 core samples. A total of 2,477 QA/QC samples were submitted, representing approximately 10.8% of all assays. CRM performance during the 2020–2022 programs showed a generally acceptable accuracy with minor negative analytical bias and some isolated results above the limit. CRM datasets from 2011 were not statistically significant and were
83
excluded from detailed interpretation. Overall, accuracy and precision were within acceptable limits for gold analysis. All blanks from the 2011 program returned values below detection limits, and only a single blank failure was recorded between 2020 and 2022. No evidence of sample contamination was identified. Duplicate sampling returns a high reproducibility with a small number of high-grade outliers were attributed to the nugget effect typical of gold mineralization. The QPs conclude that the QA/QC results demonstrate acceptable analytical accuracy and precision, with no significant issues affecting data quality. The database generated from the Orion drilling programs is considered reliable and suitable for use in mineral resource estimation.
6.9.3 | Stog’er Tight Deposit |
Since the publication of Signal Gold’s 2022 NI 43-101 Technical Report, no new exploration, drilling, or sampling has been conducted at the Stog’er Tight deposit. The Qualified Persons have reviewed previously documented sample preparation, analytical methods, and QA/QC procedures and consider them fully compliant with NI 43-101 and appropriate for the style of mineralization. Diamond drill core was transported daily to the Stog’er Tight logging facility for detailed geological and geotechnical documentation, cut into half-core, and sampled over approximately 1 m intervals, with samples securely bagged and submitted to Eastern Analytical Ltd., an ISO-17025 accredited laboratory. Fire assays were performed on 30 g pulp samples using AA finish, with gravimetric re-assay for samples above 100 g/t Au. The program includes systematic insertion of certified reference material and blank samples at a nominal frequency of 1 in 25 for both types. A total of 316 standards and 316 blanks were inserted at the Stog’er Tight deposit, returning a high overall pass rate (standards: 99.2% within ±2SD; blanks: one minor anomaly). No field duplicates were performed, but an inter-laboratory pulp checks of 85 pulp duplicates were submitted to ALS and confirmed strong reproducibility of Eastern’s results. The Qualified Persons conclude that sample handling, analytical procedures, and QA/QC performance demonstrate no significant issues and that the data are reliable and of sufficient quality for mineral resource estimation. The recommendation is to add field duplicates to the QA/QC routine at the same nominal frequency as the other QA/QC sample types.
6.10 |
6.10.1 | Hammerdown Deposit |
The Hammerdown deposit MRE QP completed two site visits in 2025 to inspect drilling activities, core logging, QA/QC procedures, and mineralization at Hammerdown. Selected drill collars were independently verified in the field and found to be within acceptable tolerance of database coordinates. Core inspections confirmed that geological logging, mineralization styles, and alteration are consistent with the geological model and support mineral continuity.
Approximately 10% of the assay database was verified against original certificates, and QA/QC data were reviewed in full. No material errors were identified in collar, assay, or survey data. Minor issues were non-material and largely outside the MRE footprint. Review of historical mined-out shapes identified localized stope misplacements; additional depletion adjustments and classification refinements were completed where warranted.
The QP considers the drilling, sampling, QA/QC, and database management procedures to be adequate to support the MRE, with recommendations for targeted infill drilling to further reduce uncertainty in selected areas.
6.10.2 | Orion Deposit |
The Orion deposit MRE, QP reviewed core logging, QA/QC procedures and mineralization. The geological description reported in the database are consistent with the geological model and mineralization type.
Around 5% of the holes used in the MRE were selected for assay validation against original certificates. The validation reveals no major issues in collar, assay, or survey data. Only minor inconsistencies were
84
detected in the database management due to recent transition of owner and software system but not impacting the MRE.
The QP considers the drilling, sampling, QA/QC and the database to be valid and of sufficient quality to support the MRE, with recommendations to conduct an infill sampling program on existing drill cores and to proceed to an independent surveyor to confirm collar coordinates.
6.10.3 | Stog’er Tight Deposit |
The Stog’er deposit MRE, QP completed an on-site visit in 2025 to inspect the Pine Cove site and Stog’er deposit area, core logging, QA/QC procedures, mineralization and a field review of geological and structural features observed on the outcrops. The geological description reported in the database correspond to the rocks observed during the site visit and are consistent with the geological model and mineralization type.
Around 8% of the holes used in the MRE were selected for assay validation against original certificates. The validation reveals no major issues in collar, assay, or survey data. Only minor inconsistencies were detected in the database management due to recent transition of owner and software system but not impacting the MRE. An independent resampling was performed on 6 mineralized intervals, and the results indicate acceptable reproducibility and confirm the gold content. The validation comprises also historical holes by comparing the values recorded in the log with those in the database and revealed no major incongruities. A statistical comparison of the historical assays to the recent reveal a lower precision for high grades values in the historical assays.
The QP considers the drilling, sampling, QA/QC and the database to be valid and of sufficient quality to support the MRE, with recommendations to conduct an infill sampling program on existing drill cores and to proceed to an independent surveyor to confirm collar coordinates.
6.11 |
Extensive metallurgical test work conducted from 1999 through 2025 has built a comprehensive understanding of the processing characteristics of the Hammerdown (HAM), Stog’er Tight (STO), Orion (ORN), and Wisteria (WIS) deposits and mineralised zones. Multiple reputable laboratories have carried out characterization, mineralogy, comminution, sorting, flotation, leaching, and detoxification studies, with more recent programs focused on evaluating performance through the Pine Cove Mill (PCM) flowsheet and optimising processing conditions for future operations. These programs incorporated both historical composite samples and recent variability composites selected to represent the grade, lithology, and spatial distribution within the deposits.
The results consistently demonstrate that the mineralization is amenable to conventional crushing, grinding, flotation, leaching, and Merrill–Crowe processing. Sorting tests achieved approximately 95% gold recovery in product streams while rejecting significant waste mass (15% to 47%), particularly for Hammerdown material.
Comminution characteristics indicate medium hard ore with moderate abrasion, and flotation response across all deposits is strong, with rougher recoveries above 95% under optimized grind conditions. Concentrate leach test work shows that finer regrinds (~15-20 µm) and optimized cyanide dosing significantly improve gold extraction, with rapid leach kinetics under oxygenated conditions.
Optimized laboratory test work achieved excellent overall gold recoveries: approximately 96% for Hammerdown and Stog’er Tight, and 90% for Orion and Wisteria. Incorporating gravity concentration provides incremental recovery benefits, particularly for Wisteria, Orion and Stog’er Tight zones, and decreases the mass pull in flotation for similar overall recovery. This may help alleviate drum filter throughput bottle necks in the future. Detoxification studies confirmed that all mineralization can be effectively treated using the SO₂/air process, and filtration and thickening assessments established suitable operating parameters for concentrate and residue handling with floc dosages at approximately
85
30g/t. Merrill–Crowe tests under laboratory conditions achieved metal precipitation efficiency, though additional work is recommended to validate performance at operational scale.
Under operating conditions at Pine Cove, recoveries are adjusted due to coarser grinding, shorter flotation residence times, lower mass pulls, and reduced leach residence time. Operationally corrected gold recoveries average approximately 87.2% for Hammerdown/Stog’er Tight and 74.5% for Orion/Wisteria. Continued reconciliation between laboratory data and plant performance is recommended to refine the flowsheet, optimize reagent consumption, and improve gold recovery.
6.12 |
Updated MREs are presented in this Technical Report for the Hammerdown, Orion, and Stog’er Tight deposits, which are planned to share the Pine Cove Mill. Estimates were prepared by two independent consulting firms.
The Hammerdown deposit MRE was completed by SLR Consulting (Canada) Ltd. (SLR) and reviewed by Minéralis Consulting Services Inc. (Minéralis). Following the review, minor adjustments were made to the classification of specific veins and major adjustments were applied to grade depletion and classification in areas of lower confidence in historical underground workings. Portions of the Hammerdown discussion are adapted from the 2022 Feasibility Study completed by SLR.
Updated MRE’s for Orion and Stog’er Tight deposits were prepared by Chafana Hamed Sako (P.Geo.) and Simon Boudreau (P.Eng.) of Norda Stelo.
The effective date for the Mineral Resource statements presented herein is January 22, 2026.
The reported mineral resources are not mineral reserves and do not have demonstrated economic viability.
Measured and Indicated Mineral Resources (“M&I”) for the projects combined total 3.328 Mt at an average gold grade of 2.43 g/t Au for 260,000 contained ounces of gold. Inferred Mineral Resources total 2.132 Mt at an average grade of 2.34 g/t Au for 161,000 ounces of gold (Table 17).
Table 17: Hammerdown Gold Project Consolidated MRE (effective date January 22, 2026)
Property | Deposit | Mining | Category | Tonnage | Grade | Contained Oz (koz)3 |
|---|---|---|---|---|---|---|
Hammerdown | Hammerdown | Open Pit | Measured | 271 | 8.24 | 72 |
Indicated | 1,823 | 1.96 | 115 | |||
Measured & Indicated | 2,094 | 2.77 | 187 | |||
Inferred | 973 | 2.59 | 81 | |||
Hammerdown | Orion | Open Pit | Indicated | 598 | 1.75 | 33.6 |
Inferred | 91 | 1.92 | 5.6 | |||
Underground | Indicated | 636 | 1.92 | 39.3 | ||
Inferred | 523 | 2.16 | 36.2 | |||
Pine Cove | Stog’er Tight | Open Pit | Inferred | 545 | 2.16 | 37.8 |
Total | | | | |||
Measured | 271 | 8.24 | 72 | |||
Indicated | 3,057 | 1.91 | 188 | |||
Measured & Indicated | 3,328 | 2.43 | 260 | |||
Inferred | 2,132 | 2.34 | 161 | |||
86
6.12.1 | Hammerdown Deposit |
The MRE for the Hammerdown deposit is based on a database closed on June 16, 2025 and includes 1,108 drill holes (surface and underground) totaling approximately 93,818 m, 310 m in 86 channels. The geological model comprises vein-hosted domains (Hammerdown, Rumbullion, Muddy Shag) and disseminated domains (Wisteria), constructed in Leapfrog Geo. Assays were composited to 1 m, capped by domain, and gold grades were interpolated into a sub-blocked model (2.5 m × 1 m × 4 m parent blocks) using inverse distance cubed (ID³) with high-grade restrictions and domain hard boundaries.
Mineral Resources are constrained within an optimized open pit shell and reported within mineable shapes to demonstrate reasonable prospects for eventual economic extraction. Cut-off grades of 0.35 g/t Au (Hammerdown) and 0.48 g/t Au (Wisteria) were applied, using a gold price of US$3,500/oz and supporting cost and recovery assumptions. Classification was based primarily on drill spacing and geological confidence: Measured (<15 m spacing), Indicated (<30 m), and Inferred (<60 m), with additional downgrading in areas adjacent to lower confidence historical stopes.
As of January 22, 2026, open pit Mineral Resources total 2.09 Mt at 2.77 g/t Au for 187 koz in the Measured and Indicated categories, and 0.97 Mt at 2.59 g/t Au for 81 koz in the Inferred category. Mineral Resources are not Mineral Reserves and do not have demonstrated economic viability. Mineral Resources are tabulated below by resource categories (Table 18).
Table 18: Summary of Hammerdown deposit mineral resources – January 22, 2026
Resource Category | Tonnage | Grade | Gold Content |
Measured | 271 | 8.24 | 72 |
Indicated | 1,823 | 1.96 | 115 |
Total M&I | 2,094 | 2.77 | 187 |
Inferred | 973 | 2.59 | 81 |
Hammerdown MRE Notes:
| (1) | The Mineral Resources described above have been prepared in accordance with the CIM Standards (Canadian Institute of Mining, Metallurgy and Petroleum, 2014). |
| (2) | The effective date of the MRE is January 22, 2026 with a database cut-off date of June 16, 2025 and using a depletion surface of December 31, 2025. |
| (3) | The lower cut-offs used to report open pit Mineral Resources are 0.48 g/t Au for the Wisteria area and 0.35 g/t Au for all other areas within the Hammerdown deposit pit optimization. |
| (4) | The Hammerdown deposit has been classified as Measured, Indicated and Inferred Mineral Resources according to drill spacing and confidence in the historical stope placement. |
| (5) | Bulk density was assigned based on historical and recent specific gravity measurements. A single value of 2.81 g/cm3 was used, and 1.9 g/cm3 for backfill material within historical stopes. |
| (6) | The MRE is based on a subblocked model with a main block size of 2.5 m x 1 m x 4 m, and subblocks of 0.16 m x 0.06 m x 2 m. Gold grades were composited to 1-m length and estimated with ID3 and high-grade spatial restrictions. |
| (7) | The open pit MRE is reported inside mineable shapes constrained by an open pit optimization to respect Reasonable Prospect of Eventual Economic Extraction (RPEEE). No mining dilution and losses are added to the MRE; however, must take material is accounted for in open pit mineable shapes. |
| (8) | Open pit optimization and cut-off grade assume long-term gold price of US$ 3,500/oz, and a US$/C$ exchange rate of 1.40, slope angles of 50°, bench height of 4 m, minimum mining width of 1.5 m, metallurgical recoveries of 92%, mining costs of C$10/t mined, processing costs of C$40/t processed, transport costs of C$25/t processed and general and administrative costs of C$10/t processed. |
| (9) | Tonnage has been expressed in the metric system, and gold metal content has been expressed in troy ounces. The tonnages have been rounded to the nearest 1,000 tons, and the metal content has been rounded to the nearest 1,000 ounces. Totals may not add up due to rounding errors. |
| (10) | These Mineral Resources are not mineral reserves as they have not demonstrated economic viability. The quantity and grade of reported Inferred Mineral Resources in this section are uncertain in nature and there has been insufficient exploration to define these resources as indicated or measured; however, it is reasonably expected that the majority of Inferred Mineral Resources could be upgraded to Indicated Mineral Resources with continued exploration. |
| (11) | The QP is not aware of any factors or issues that materially affect the mineral resource estimate other than normal risks faced by mining projects in the province in terms of environmental, permitting, taxation, socio-economic, marketing, and political factors, and additional risk factors regarding indicated and inferred resources. |
87
6.12.2 | Orion Deposit |
The updated mineral resource estimate for the Orion deposit (the “2026 MRE”) was prepared by Chafana Hamed Sako (P.Geo.) and Simon Boudreau (P.Eng.) of Norda Stelo. The effective date is January 15, 2025.
The mineral resources herein are not mineral reserves as they do not have demonstrated economic viability.
The QPs consider the 2026 MRE reliable and based on quality data, reasonable assumptions and parameters that follow CIM Definition Standards.
The QPs have classified the mineral resources in the 2026 MRE as Indicated and Inferred based on data density, search ellipse criteria, drill hole spacing and interpolation parameters. The QPs also believe the requirement of ‘reasonable prospects for eventual economic extraction’ has been met by having resources constrained by optimized pit-shell and DSO stope designs and by applying a cut-off grade based on reasonable inputs amenable to potential in-pit and underground extraction scenarios.
The following table displays the results of the 2026 MRE combining potential open pit and underground mining scenarios at cut-off grades of 0.48 g/t Au (in-pit) and 1.13 g/t Au (underground).
Table 19: Summary of Orion deposit mineral resources – January 22, 2026
Open pit Mineral Resource (at 0,47 g/t Au cut-off) | |||
Classification | Tonnes | Grade | Ounces |
Indicated | 598 000 | 1,75 | 33 600 |
Inferred | 91 000 | 1,92 | 5 600 |
Underground Mineral Resource (at 1,13 g/t Au cut-off) | |||
Classification | Tonnes | Grade | Ounces |
Indicated | 636 000 | 1,92 | 39 300 |
Inferred | 523 000 | 2,16 | 36 200 |
Orion Gold Deposit | |||
Classification | Tonnes | Grade | Ounces |
Total Indicated | 1 234 000 | 1,84 | 72 900 |
Total Inferred | 614 000 | 2,12 | 41 800 |
Orion MRE notes:
| (1) | These mineral resources are not mineral reserves as they do not have demonstrated economic viability. The mineral resource estimate follows current CIM Definition Standards (2014) and CIM MRMR Best Practice Guidelines (2019). |
| (2) | The independent and qualified persons (“QPs”) for the mineral resource estimate, as defined by NI 43-101, are Chafana Sako, P.Geo. of Norda Stelo and Stephen Coates, P.Eng. of Evomine. The effective date is January 22, 2026. |
| (3) | The estimation encompasses twelve (37) zones and a dilution envelope using Leapfrog Geo and interpolated using Leapfrog Edge. |
| (4) | 1.0-m composites were calculated within the mineralized zones using the grade of the adjacent material when assayed or a value of zero when not assayed. High-grade capping on composites (supported by statistical analysis) was set between 5.0 and 70.0 g/t Au for envelopes. |
| (5) | The estimate was completed using a sub-block model in Leapfrog Edge, with a parent block size of 5m x 5m x 5m (X,Y,Z) and a sub-block size of 0.625m x 0.625m x 0.625m (X,Y,Z). |
| (6) | Grade interpolation was obtained by the Ordinary Kriging (OK) method using hard boundaries. |
| (7) | Density values of 2.7 to 2.83 g/cm3 were assigned to all mineralized zones. |
| (8) | Mineral resources were classified as Indicated and Inferred Mineral Resources. inferred category is defined for blocks estimated if the 1 to 5 holes closest to the block have an average distance < 35 to 55 m and if the block was estimated with pass 1 or 2 and there is reasonable geological and grade continuity. |
| (9) | The mineral resource estimate is locally pit constrained. The pit-constrained results are presented undiluted and are considered to have reasonable prospects of economic viability. The pit-constrained mineral resource estimate is reported at a 0.42 g/t Au cut-off grade. The cut-off was calculated using the following parameters: gold price = US$ 3,500/oz; USD:CAD exchange rate = 1.40; mining cost = CA$10.00/t; processing + G&A costs = CA$48.50/t; bedrock slope angle of 50°; and mill recovery = 92%. |
| (10) | The cut-off grades should be re-evaluated in light of future prevailing market conditions (metal prices, exchange rates, mining costs etc.). |
88
| (11) | The number of metric tons (tonnes) was rounded to the nearest thousand, following the recommendations in NI 43-101. Any discrepancies in the totals are due to rounding effects. The metal contents are presented in troy ounces (tonnes x grade / 31.10348). |
| (12) | The QPs are not aware of any known environmental, permitting, legal, title-related, taxation, socio-political, or marketing issues or any other relevant issue not reported in the Technical Report that could materially affect the MRE. |
6.12.3 | Stog’er Tight Deposit |
The updated mineral resource estimate for the Stog’er Tight deposit (the “2026 MRE”) was prepared by Chafana Hamed Sako (P.Geo.) of Norda Stelo and Stephen Coates (P.Eng.) of Evomine. The effective date is January 22, 2026.
The mineral resources herein are not mineral reserves as they do not have demonstrated economic viability.
The QPs consider the 2026 MRE reliable and based on quality data, reasonable assumptions and parameters that follow CIM Definition Standards.
The QPs have classified the mineral resources in the 2026 MRE as Inferred based on data density, search ellipse criteria, drill hole spacing and interpolation parameters. The QPs also believe the requirement of ‘reasonable prospects for eventual economic extraction’ has been met by having resources constrained by optimized pit-shell and by applying a cut-off grade based on reasonable inputs amenable to potential in-pit extraction scenario.
The following table displays the results of the 2026 MRE potential open pit scenario at cut-off grades of 0.42 g/t Au (in-pit).
Table 20: Summary of Stog’er Tight deposit mineral resources – January 22, 2026
Stog’er Tight Gold Project | |||
Open Pit Mineral Resource (at 0,42 g/t Au cut-off) | |||
Classification | Tonnes | Grade | Ounces |
Inferred | 545 000 | 2,16 | 37 800 |
Stog’er Tight Gold Project | |||
Classification | Tonnes | Grade | Ounces |
Total Inferred | 545 000 | 2,16 | 37 800 |
Stog’er Tight MRE notes:
| (1) | These mineral resources are not mineral reserves as they do not have demonstrated economic viability. The mineral resource estimate follows current CIM Definition Standards (2014) and CIM MRMR Best Practice Guidelines (2019). |
| (2) | The independent and qualified persons (“QPs”) for the mineral resource estimate, as defined by NI 43-101, are Chafana Sako, P.Geo. of Norda Stelo and Stephen Coates, P.Eng. of Evomine. The effective date is January 22, 2026. |
| (3) | The estimation encompasses twelve (12) zones and a dilution envelope using Leapfrog Geo and interpolated using Leapfrog Edge. |
| (4) | 1.0-m composites were calculated within the mineralized zones using the grade of the adjacent material when assayed or a value of zero when not assayed. High-grade capping on composites (supported by statistical analysis) was set at 30.0 g/t Au for envelopes. |
| (5) | The estimate was completed using a sub-block model in Leapfrog Edge, with a parent block size of 3 m x 3 m x 3 m (X,Y,Z) and a sub-block size of 0.75 m x 0.75m x 0.75 m (X,Y,Z). |
| (6) | Grade interpolation was obtained by the Ordinary Kriging (OK) method using hard boundaries. |
| (7) | Density values of 2.8 to 2.9 g/cm3 were assigned to all mineralized zones. |
| (8) | Mineral resources were classified as Indicated and Inferred. Indicated resources are defined for blocks were estimated if the 2 holes closest to the block have an average distance < 30 m with pass 1 or 2, and there is reasonable geological and grade continuity. The inferred category is defined for blocks estimated if the 1 hole closest to the block have an average distance < 60 m and if the block was estimated with pass 3 and there is reasonable geological and grade continuity. |
| (9) | The mineral resource estimate is locally pit constrained. The pit-constrained results are presented undiluted and are considered to have reasonable prospects of economic viability. The pit-constrained mineral resource estimate is reported at a 0.48 g/t Au cut-off grade. The cut-off was calculated using the following parameters: gold price = US$ 3,500/oz; USD:CAD exchange rate = 1.40; mining cost = CA$10.00/t; processing + G&A costs = CA$82.02/t; bedrock slope angle of 50°; and mill recovery = 92%. |
89
| (10) | The cut-off grades should be re-evaluated in light of future prevailing market conditions (metal prices, exchange rates, mining costs etc.). |
| (11) | The number of metric tons (tonnes) was rounded to the nearest thousand, following the recommendations in NI 43-101. Any discrepancies in the totals are due to rounding effects. The metal contents are presented in troy ounces (tonnes x grade / 31.10348). |
| (12) | The QPs are not aware of any known environmental, permitting, legal, title-related, taxation, socio-political, or marketing issues or any other relevant issue not reported in the Technical Report that could materially affect the MRE. |
6.13 |
6.13.1 | Geotechnical Considerations |
Pit walls at Hammerdown and Orion will be comprised primarily of mafic volcanic and felsic to mafic schist units with dominant sub-vertical, northeast-southwest trending foliation. The Stog’er Tight pits will be developed in Gabbro and Mafic Volcanics with a well-developed, shallow to moderately north-northeast dipping foliation. Secondary, shallow to moderately dipping joint sets have also been identified and incorporated into the geotechnical design at Hammerdown and Stog’er Tight.
Rock mass quality at all three deposits generally classifies as “Good” geomechanical quality according to the Bieniawski (1989) rock mass rating (RMR) classification system. Intact rock strengths are typically “Strong” (50 to 100 MPa) to “Very Strong” (100 to 150 MPa) according to ISRM (1978) standards.
Based on rock mass, the quality and structural characteristics described above along with the relatively shallow pit depths, kinematic (structurally controlled) failures are anticipated to be the primary mechanism of instability. Interramp slope angles recommended for the final Hammerdown pit range from for 49 to 55°, depending on wall orientation. An interramp slope angle of 55° is recommended for the final Orion and Stog’er Tight pit designs. Good quality wall control blasting and scaling practices will be required to achieve 55° interramp slopes while maintaining adequate catch bench widths.
The Captain Nemo Fault parallels the south wall of the Hammerdown pit and is considered critical to overall stability of final pit south wall. Pit designs should mine out the fault to avoid potential for multi-bench or overall slope failures.
6.13.2 | Hydrogeological Considerations |
The Hammerdown/Orion area lies near a groundwater divide intersecting three surface watersheds. Analytical estimates indicate pit inflows of approximately 3,426 m³/d at Hammerdown and 1,124 m³/d at Orion at full development. Historical underground workings may currently act as a groundwater sump and could be integrated into future dewatering. Faults and fractures within the pit area may contribute to groundwater inflow and require further investigation. Existing hydrogeologic testing has been limited to shallow depths (≤30 m), and deeper drilling and hydraulic testing are required to characterize full-pit conditions. Water-management design must account for stockpile toe-seepage and seasonal groundwater elevations, including occasional artesian conditions.
Groundwater flows northwest toward Camp Pond, with water levels varying from artesian to ~6 m depth, driven by local topography and past pit development. Further testing is required to delineate potential faults/fractures that may influence inflows to the proposed Gabbro Pit and Pit 278. Development near Fox Pond and Camp Pond will require careful management of pond water levels to avoid unintended drawdown. If pond-level reductions cannot be avoided, a Fisheries Act authorization may be required. A 3-D groundwater model is recommended to integrate pit development, lithology, hydraulic conductivity, and pond interactions.
Groundwater levels surrounding the Pine Cove pit are higher than pit water levels, indicating continued groundwater inflow of ~500 m³/d. Groundwater contributions will remain an important factor in the evolution of the pit lake and long-term water quality. The in-pit tailings facility requires a minimum 10 m water cover, and ongoing monitoring indicates water levels near elevation 23.5 masl. Water-cover thickness will vary as
90
tailings deposition progresses, and groundwater inflow should be incorporated into closure planning and modeling.
6.13.3 | Mining |
The PEA is preliminary in nature. It includes inferred mineral resources that are considered too speculative geologically to have the economic considerations applied to them that would enable them to be categorized as mineral reserves, and there is no certainty that the PEA would be realized.
Open pit optimization was conducted to determine the optimal economic shape of the open pit and guide the open pit design process, with cut-off grades ranging from 0.41 to 0.56 depending on the deposit. Revenue factor of 1.00 pit shells were selected to guide the pit designs for the Hammerdown, Orion and Stog’er Tight deposits. Mined physical quantities represent 4.3 Mt of mineralized material at an average grade of 2.19 g/t for 306.6 koz, 48.0 Mt of waste and 1.7 Mt of overburden. The pits’ mining sequence is planned as follows: Hammerdown, Orion and Stog’er Tight. The Hammerdown pit will be mined in three phases: a Hammerdown phase 1 pit, a Rumbullion area pit and a Hammerdown phase 2 pushback joining the pits together. The 13-year life of mine incorporates 12 years of direct mill feed from open pit operations and 1 years of stockpile rehandling at a processing rate of 700 tpd. The mining rate is expected to peak at 18,300 t/d and average 12,300 t/d over the 12 years of mining. The project is planned as a conventional truck-and-shovel open pit mining operation with mining executed by a contractor. Waste loading and haulage will be handled by 3 m3 hydraulic excavators and 41-tonne payload articulated haul trucks. Mineralized material loading and hauling will be handled by a fleet of 2 m3 hydraulic excavators with a 7 m3 front end loader as backup and 38 tonne payload articulated haul trucks.
6.14 |
The Pine Cove process plant currently treats material via a conventional grind-flotation-leach-Merrill Crowe flowsheet to nominally process 700 tpd material. Run-of-mine (ROM) material is currently processed via a two-stage crushing plant at the Hammerdown mine and then hauled to the Pine Cove plant. It is proposed to install a three-stage crushing plant with an ore sorter at the Hammerdown mine and continue to haul crushed material to the Pine Cove plant.
Crushed material is processed via a ball mill followed by a flotation circuit. Flotation concentrate is thickened, reground, and then leached via cyanidation. Leach slurry is dewatered via drum filters and pregnant solution treated via a Merrill Crowe circuit to recover gold. Tailings are treated via a cyanide destruction circuit prior to in-pit tailings storage.
The process plant has operated since 2012 and was under care and maintenance from 2022 to 2025 when operations were resumed being commissioned on low grade stockpiles. The Pine Cove process plant commenced treating material from the Hammerdown deposit in Q4 2025.
Test work demonstrated that the crushed mineralization is highly amenable to sorting with an average of 50%-55% of the sorter feed mineralization being separated as waste material and rejected out of the sorting circuit. Results from these test programs were used to develop the corresponding process design criteria, mechanical equipment list, flowsheets, capital and operating costs.
The process plant at Hammerdown will include:
| ● | Owner-operated crushing and screening circuit |
| ● | Screen undersize (fines) to load-out facility |
| ● | Sorting |
91
Due to the varying levels of dilution accompanying the mineralization, the crushing and sorting plant will be designed to facilitate a throughput of 1,200 t/d with average life of mine (LOM) feed grade of approximately 2.19 g/t Au. Both the crushing and sorting circuits will operate at an availability of 73%, which results in a nominal plant throughput of 137 t/h, with a capacity up to 164 t/h to process lower grade material at a higher rate.
The recovery method will consist of the following unit operations:
| ● | Primary Crushing – A vibrating grizzly feeder and jaw crusher in open circuit, producing a final product P80 of approximately 70 mm. |
| ● | Screening – A triple deck vibrating screen with deck openings of 60mm, 35 mm and 10 mm. The oversize material will feed the secondary crusher and the middle and top decks will be sent to one of two sorters. The lower deck will screen out the fines. |
| ● | Secondary Crushing – Single stage cone crusher in closed circuit with the triple deck vibrating screen, producing a final product P80 of approximately 40 mm. |
| ● | Sorting – two sorting machines in parallel sorting the different size fractions. |
| ● | Tertiary Crushing – Single stage cone crusher in open circuit producing a final product P80 of approximately 7.1 mm. |
| ● | Stockpiles – three stockpiles will be produced from the sorting facility: one for crushed product being conveyed to a load-out facility and trucked for further processing, screen undersize fines being conveyed to its own load-out facility and the other re-handled to either the waste rock or low-grade stockpiles. |
A simplified process flowsheet of the Pine Cove process plant is provided in Figure 3.
Figure 3: Pine Cove overall flowsheet (Source: New Found Gold 2026)
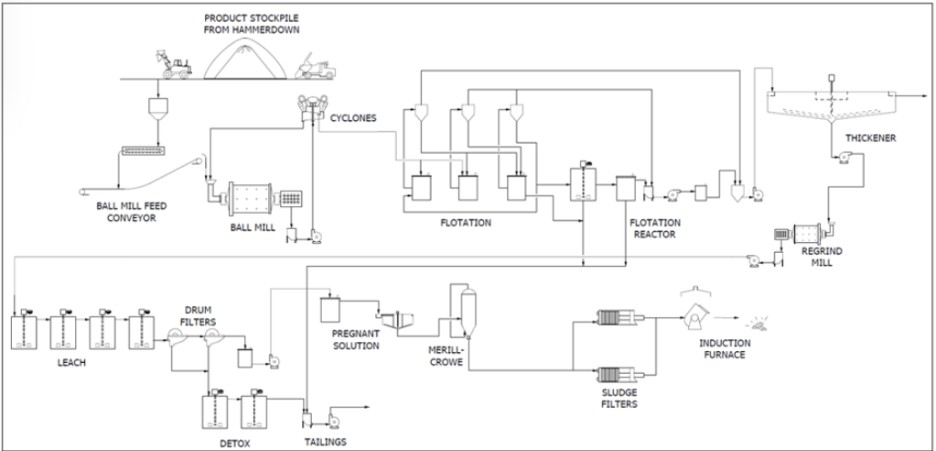
92
6.15 |
Hammerdown is an active pre-commercial production mine, and Pine Cove operates as an existing mill; therefore, site access will utilize the established roads, Route 391 to the Hammerdown property and Route 418 to the Pine Cove property. Most onsite roads already exist and require only minor upgrades or expansion as needed.
The Hammerdown property’s surface infrastructure will include a new ore crushing and sorting plant, with modular buildings for office, dry, warehouse, and maintenance needs. The Pine Cove property already has all major infrastructure, including a conventional mill and an in-pit tailings storage facility, which has been used since 2018 for secure, permanent tailings storage. Most infrastructure is either established or can be upgraded relatively easy due to ongoing operations.
Process water from the tailing slurry and meteoric water that accumulates in the pit above the settled tailings solids will be reclaimed for use as process water in the process plant.
The power required for the Hammerdown property will be provided by Newfoundland and Labrador Hydro. Diesel generators will be used for pit dewatering, as well as to provide power at the explosives storage area and the security trailer.
The project’s water management strategy integrates a combination of non-contact diversion, contact water containment, groundwater dewatering, and passive treatment systems to support effective control of runoff and mine influenced water throughout operations. Across all sites, the system is designed to minimize environmental impact, reduce sediment and contaminant loading, and adapt to operational changes through ongoing monitoring and treatment optimization.
6.16 |
The gold market is mature globally with numerous reputable refiners readily available. As such, a market study for the salability of gold products or for the expected price of gold was not undertaken.
The commercial terms for refining the doré to produce saleable gold and the doré shipping cost estimates (see Table 21) used in this analysis were provided by New Found Gold based upon current experiences with the doré product coming from the Pine Cove Mill.
Table 21: Commercial terms for the sale of gold doré
Description | Unit | Doré |
Refining Cost (Gold) | US$/oz | 5.0 |
Gold Payable | % | 99.975 |
Doré Shipping Charge | US$/oz | 15.0 |
The price projection for the PEA financial model base case is presented in Table 22. The pricing is representative of the 75th percentile of the consensus opinions of several financial institutions in December 2025 as documented by BMO Capital Markets and provided to New Found Gold.
Table 22: Commodity Pricing
Element | Unit of Measure | Financial Model | |||||
Year | 2026 | 2027 | 2028 | 2029 | 2030 | LT | |
Au | US$/oz | 4,132 | 4,000 | 3,775 | 3,600 | 3,600 | $3,475 |
The consensus price has a weighted average against recovered gold of US$3,656/oz Au over the LOM. The selected slate of gold prices is viewed as conservative compared to the February 18 EOB spot price of near US$5,000/oz. With the current gold market, three year trailing average pricing for establishing a fixed gold price for the economic analysis was considered not applicable to the Hammerdown project.
93
Contract terms and refining charges are in place with refining companies. It is expected that any future contract terms will be typical. Metal prices in the sales contracts are expected to reference prices similar to those published in the London Metal Exchange (LME).
Operational contracts are in place for:
| ● | Mining |
| ● | Mines Engineering |
| ● | Geological Services |
| ● | Crushing at Mine Site |
| ● | Haulage from Hammerdown to Pine Cove Mill |
6.17 | Environmental Studies, Permitting and Social or Community Impact |
Maritime has compiled environmental, permitting, and socio-community information for the Hammerdown/Orion, Stog’er Tight, and Pine Cove sites based on historical studies and recent baseline programs completed between 1992 and 2025. These programs address terrestrial and aquatic ecosystems, hydrology and water quality, hydrogeology, air quality, metal-leaching and acid-rock-drainage (ML/ARD) characteristics, and site-specific regulatory requirements. Environmental conditions across the sites are characteristic of the Central Newfoundland and North Shore Forest ecoregions. Recorded environmental considerations include occurrences of plant species of conservation concern (SOCC) at Hammerdown and Stog’er Tight, the presence of brook trout and American eel in regional watercourses, and established fish-habitat compensation works at Pine Cove. No federally designated critical habitat under the Species at Risk Act has been identified at any of the sites. Geochemical testing indicates that tailings and most waste rock are non-acid generating (NAG), with tailings placed in the Pine Cove in-pit storage facility under a permanent water cover of approximately 10 m.
Hammerdown, Stog’er Tight, and Pine Cove have been released from the provincial EA process for their current development phases, and related Certificates of Approval (CofA) govern construction, operation, discharge, and monitoring requirements. Development at Orion is expected to require provincial EA registration and subsequent permitting. Stog’er Tight is presently under care and maintenance, and updated permits and plans, including an updated Development Plan and Rehabilitation and Closure Plan (RCP), will be required before mining activities resume. Future modifications to the Pine Cove site that may be required could be subject to additional assessment and/or permitting requirements depending on the nature of the modifications required. Federal EAs were not required, as these projects did not meet the threshold under the current or previous federal EA legislation; the proposed milling rate at Pine Cove will remain below the 5,000 t/day federal threshold.
Federal oversight applies where applicable under the Fisheries Act and the Metal and Diamond Mining Effluent Regulations (MDMER), with Pine Cove being the only site currently subject to Environmental Effects Monitoring (EEM) due to its active final discharge point. All three sites have approved RCPs, each supported by financial assurance; closure cost estimates have been updated as part of the Technical Report.
Engagement with Indigenous groups, nearby municipalities, and community stakeholders has occurred through project-specific permitting processes and ongoing communication activities. This environmental and regulatory information has been incorporated into the Technical Report to support ongoing and future planning, permitting, and closure considerations.
6.18 |
The project capital cost estimate (CAPEX), sustaining capital estimate (SUSEX), and operating cost estimate (OPEX) were compiled by WSP; and are based on the Project and ongoing scope of work presented in this Report’s Items.
94
WSP used the current contractor crushing agreement for that component of the OPEX and developed the SUSEX for the Water Management and Electrical portions of the scope. All contributors to the CAPEX, SUSEX, and OPEX are identified in Table 23.
Table 23: List of cost estimation by contributor firm
Description | Contributors |
|---|---|
Mining | Evomine |
Contractor Crushing | WSP |
Sorting and Crushing Plant | Canenco |
Haulage | Lincoln Metallurgical |
Mineral Processing | Lincoln Metallurgical |
General and Administrative (G&A) | Lincoln Metallurgical |
Water Management | WSP |
TSF Water Recirculation | Knight Piésold |
Power and Electrical | WSP |
Unless indicated otherwise, all CAPEX, SUSEX, and OPEX costs are expressed in Canadian Dollars (CAN$ or $) and are based on Q1 2026 pricing.
6.18.1 | Capital Costs |
The sole project capital (CAPEX) item identified as part of the Project scope and described in this Report is the Sorting and Crushing Plant that had its CAPEX and OPEX developed by Canenco.
The Sorting and Crushing Plant CAPEX was developed to deliver an overall accuracy range of -30% to +50%. Ranges could exceed those shown, if there are unusual risks.
For this PEA, the CAPEX reflects an EPCM-type execution model. Although some individual elements of the CAPEX may not achieve the target level of accuracy, the overall CAPEX should fall within the parameters of the intended accuracy.
The Sorter and Crushing Plant CAPEX consists of direct and indirect capital costs as well as contingency.
Provisions for sustaining capital (SUSEX) are also included mainly for mining, water management, and electrics related to the mining. Amounts for the mine closure and rehabilitation of the site have been estimated as well. The $89.3 million of mining SUSEX is composed of $87.7 million for capitalized waste removal and $1.6 million for haul roads and laydown areas. Consistent with the mine operating costs, the capitalized waste removal has no indirects or contingency applied.
Table 24 presents a summary of the CAPEX and SUSEX distributed over the LOM indicated separately. Owner’s costs, contingencies and risk amounts are included in these capital amounts.
The project capital cost totals $24.3 million and the sustaining capital cost totals $97.6 million. Closure and reclamation related costs are estimated at $18.0 million. The capital cost applies to the Hammerdown deposit, Wisteria, Orion, and Stog’er Tight. The capital expenditure by area forecast for the entire mine life is provided in Table 24.
95
Table 24: Capital cost estimate by area
Area | Description | CAPEX | SUSEX | Totals by Area |
1000 | Open Pit Mining | — | 89.3 | 89.3 |
2000 | Sorter and Crushing Plant | 14.9 | — | 14.9 |
3000 | Processing | — | — | 0 |
4000 | Water Management | — | 4.1 | 4.1 |
4140 | Tailing Management Facilities | — | — | 0 |
5000 | Power, electrical & instrumentation | — | 1.3 | 1.3 |
6000 | Off-site Infrastructure | — | — | 0 |
7000 & 8000 | Indirects | 4.6 | 1.4 | 6.0 |
9000 | Contingency | 4.9 | 1.7 | 6.6 |
10000 | Reclamation and Closure | — | 18.0 | 18.0 |
| Total Major Area CAPEX* | 24.3 | 115.7 | 140.0 |
*Numbers may not sum precisely due to rounding.
The exchange rate used for items quoted in US$ was 1.39 CAN$ : 1.00 US$.
The Pine Cove Mill commenced production of doré using Hammerdown mined material in November 2025 so most of the year 2026 capital expenditures are SUSEX and these capital expenditures continue throughout the mine life as SUSEX. The Sustaining costs are included in the overall Project CAPEX as shown in Table 24.
These sustaining capital costs cover several areas, including mining, water management, and electrics as itemised in Table 24.
At the end of the mine life, it is required that all disturbed areas are rehabilitated, and equipment and buildings are disposed of. Closure costs are kept separate in the Cashflow analysis as Other Costs in that they provide no asset values and are treated different from equipment acquisitions in the tax assessment. They have been included in Table 24 as sustaining capital.
6.18.2 | Operating Costs |
The estimated life-of-mine operating costs per tonne of material processed and per ounce of gold sold are summarized in Table 25.
Table 25: Operating cost by area
Description | $/t milled | US$/oz |
Open Pit Mining | 142.30 | 1,287 |
Processing | 46.29 | 419 |
On-Site Crushing | 1.09 | 10 |
Sorter and Crushing Plant | 8.27 | 75 |
General & Administrative | 9.58 | 87 |
Haulage | 21.84 | 198 |
TFS and Water Management | 0.41 | 4 |
Total | 229.78 | 2,078 |
Mine operating costs have been estimated based on the 2026 Hammerdown operating budget, which is supported by firm contractor quotes for most material items.
The processing operating costs are estimated from operational historical information and budget costs. The processing costs include workforce, electrical power, wear parts, maintenance parts, grinding media, reagents, laboratory, and mill general.
96
The current contractor rate for on-site crushing provided the rate at the Hammerdown site for 2026 of $13.45 per tonne processed and a total cost for that year of CAN$3.4 million. The application of the LOM total tonnes processed against the 2026 cost leads to the $1.09/t milled in Table 25.
The same sorter and crushing plant will be used for both the Hammerdown and Orion sites. It has an operating cost of $7.29 per tonne sorted, which then provides an average cost of US$75/oz Au sold or $8.27 per tonne processed and a total cost over the LOM of CAN$26 million.
The crushing and sorting plant operating costs were compiled to loadout of the crushed product for trucking to the process facility. The crushing and sorting plant facility is designed to process 1,200 t/d at availabilities of 73%. Labour rates and benefit packages were based on industry information compiled by New Found Gold. Power costs were calculated from the total installed power assuming $0.116/kWh. Vendor recommended spare parts and pricing for one year of operation were used to estimate crusher wear costs. Equipment maintenance was calculated by applying a factor of 4% to major process equipment cost. Fuel pricing for mobile equipment was based on an internal source at a diesel cost of $1.71/litre.
The annual G&A cost is estimated from historical information and budget costs. General and Administration (G&A) is a yearly CAN$2.3 million cost that then averages US$87/oz Au sold or $9.58 per tonne processed.
Haulage from the Hammerdown and Orion sites to the Pine Cove Mill is estimated from a current contractual price of $25.60 per tonne processed. Haulage from the Stog’er Tight site to the Pine Cove Mill is a lesser distance with the estimated cost factored at $2.50 per tonne processed. The weighted average between the sites using tonnes processed by site then provides the $21.84/t milled in Table 25.
TSF and water management cost is a $100K per year allowance that then averages US$4/oz Au sold or $0.41 per tonne processed.
6.19 |
The economic analysis presented in this Section contains forward-looking information under Canadian securities law. The results of the analysis rely on inputs that are subject to known and unknown risks, uncertainties, and other factors, which may cause actual results to differ materially from those presented here.
The economic analysis of the Hammerdown Gold Project is preliminary in nature and per allowances for PEA level of study, includes Inferred Mineral Resources, which are considered too speculative geologically to have the economic considerations applied to them that would enable them to be categorized as Mineral Reserves. As a result, there is no certainty that this 2026 PEA will be realized. Mineral Resources that are not Mineral Reserves do not have demonstrated economic viability.
The PEA production plan used for the economic analysis includes Inferred Mineral Resources. To advance the study beyond the PEA level, a Mineral Reserve estimate would have to be made, and Inferred Resources would need to be upgraded or removed from the production plan.
The economic analysis is based on the discounted cash flow (DCF) method on a pre-tax and after-tax basis. Current Newfoundland tax regulations were used to assess corporate tax liabilities. The key metrics determined in the analysis are the Net Present Value (NPV) at a discount rate of 5%. With the initial years showing positive cashflows, the Internal Rate of Return (IRR) and the Payback Period do not apply. A sensitivity analysis was carried out to assess the impact of variations in Recoveries, Gold Price, CAPEX, and OPEX on the financial metrics. For the purposes of the evaluation, it is assumed that the operations are established within a single corporate entity. The Project has been evaluated on an unlevered, all-equity basis.
The cash flow model uses inputs from all elements of the Project to provide a comprehensive financial projection for the entire Project, on an annual basis, supporting a 14-year life of the Project with 13-year of
97
processing period. All prices and costs are in Canadian dollars and accurate as of Q1 2026. No provisions have been made for the effects of inflation.
Table 26 provides a summary of the key technical assumptions and inputs.
Table 26: Hammerdown Gold Project PEA summary: key technical assumptions and cost inputs
Description | | Unit | | Value |
| |
Gold Price (Average LOM Base Case) | | | US$/oz Au | | 3,656 | |
Exchange Rate | | | CAN$/US$1.39 | | | |
Discount Rate | | | | % | 5 | |
Project Parameters | | | | | | |
LOM | | | years | | 13 | |
Total Potential Mill Feed Tonnage | | | kt | | 3,159 | |
Average Mined Grade | | | g/t Au | | 2.19 | |
Mill Feed Head Grade (Post-Sorting) | | | g/t Au | | 2.89 | |
Cut-off Grade (Range Depending on Deposit) | | | g/t Au | | 0.41-0.56 | |
Process Plant Average Gold Recovery | | | | % | 85.5 | |
Contained Gold | | | koz | | 306.6 | |
Recovered Gold | | | koz | | 251.3 | |
Average Annual Gold Production | | | koz/yr | | 19.3 | |
Average Mineralized Material Mining Rate (Post Sorting) | | | tpd | | 700 | |
Strip Ratio | | | Waste : ore | | 11.4:1 | |
Capital Cost Estimate | | | | | | |
Project Capital (with Contingency) | | $ | M | | 24.3 | |
Sustaining Capital (LOM with contingency) | | $ | M | | 97.7 | |
Reclamation and Closure Capital | | $ | M | | 18.0 | |
LOM Operating Costs | | | | | | |
Open Pit Mining | | $ | M | | 449.5 | |
Processing | | $ | M | | 146.2 | |
Contractor Crushing 2026 | | $ | M | | 3.4 | |
Sorting and Crushing Plant Operation | | $ | M | | 26.1 | |
Haulage to Pine Cove Mill | | $ | M | | 69.0 | |
TSF and Water Management | | $ | M | | 1.3 | |
General and Administrative (G&A) | | $ | M | | 30.3 | |
Total Operating Costs1 | | $ | M | | 725.9 | |
Revenue Related Costs | | | | | | |
Selling Costs | | $ | M | | 7.0 | |
Royalty NSR | | $ | M | | 17.4 | |
LOM Operating Unit Costs | | | | | | |
Open Pit Mining | | $ | /t milled | | 142.30 | |
Processing | | $ | /t milled | | 46.29 | |
Contractor Crushing 2026 | | $ | /t milled | | 1.09 | |
Sorting and Crushing Plant Operation | | $ | /t milled | | 8.27 | |
Haulage to Pine Cove Mill | | $ | /t milled | | 21.84 | |
TSF and Water Management | | $ | /t milled | | 0.41 | |
General and Administrative (G&A) | | $ | /t milled | | 9.58 | |
Total Operating Costs1 | | $ | /t milled | | 299.78 | |
Total Cash Cost2 | | | US$/oz Au | | 2,149 | |
AISC3 (LOM) | | | US$/oz Au | | 2,429 | |
| (1) | Total operating costs refer to onsite charges that cover open pit mining, processing and material handling, and onsite general and administrative costs. |
| (2) | Total cash costs are calculated as the sum of doré transportation, treatment and refining charges, royalties, and total operating costs, divided by the quantity of ounces sold. |
| (3) | AISC is calculated as the sum of doré transportation, treatment and refining charges, royalties, total operating costs, and sustaining capital costs, divided by the quantity of ounces sold. |
Numbers may not add up due to rounding
Table 27 depicts the financial results. At an assumed weighted average gold price of US$3,656 per ounce based on LOM gold ounces recovered, the financial results indicate a positive pre-tax NPV of $318.5 M
98
and after-tax NPV of $199.2 M, both at a discount rate of 5%. With positive cashflows for the initial four years neither an IRR nor a Payback in years is applicable.
Table 27: Economic results summary
Description | Unit | Pre-Tax | After-Tax |
NPV @ 5% | CAN$ M | 318.5 | 199.2 |
IRR | % | n/a | n/a |
Payback Period | Years | n/a | n/a |
Numbers may not add due to rounding
Figure 4 graphically depicts the pre-tax cashflows along with the cumulative pre-tax and after-tax cashflows.
Figure 4: Annual and Cumulative Cash Flows
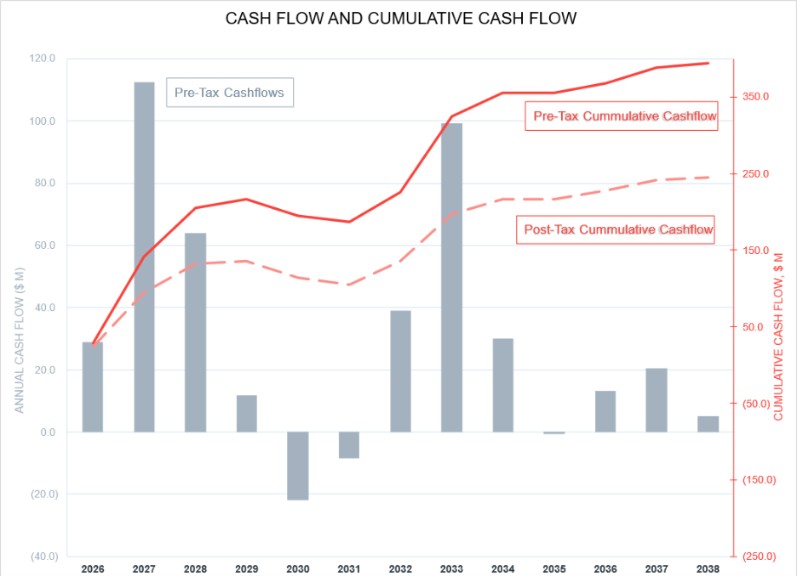
All years maintain a positive cashflow apart from 2030 and 2031.
A sensitivity analysis was conducted using the foregoing economic analysis as the base case to assess the impact of changes in process recovery, in the price of gold, in total Capex and Opex on the Project’s NPV at a 5% discount rate and IRR. The after-tax results of the sensitivity analysis are shown in Table 28 to Table 31, and Figure 5 and Figure 6. The NPV of the Project is most sensitive to variations in the gold price and gold recovery projections, followed by OPEX and CAPEX. The Project NPV goes negative at the lower limit of the price interval tested. Although the intervals and increments assessed are different, the spider graphs show the NPV appears to be equally sensitive to variations in Recovery and Price. Overall, within the limits of accuracy of the cost estimates in this study, the Project’s potential after-tax viability does not seem significantly vulnerable to the under-estimation of capital costs up to 20%, when taken individually. The sensitivity to OPEX indicates reductions in operating costs up to 20% would be of benefit.
99
Table 28: Economic metrics sensitivity to variations in the recovery
Description | Units | After Tax Net Present Value @ 5% | ||||
Percent Variation | % | -7.6% | -3.8% | Base | +3.8% | +7.6% |
Au Recovery | % | 79.0 | 82.2 | 85.5 | 88.7 | 92.0 |
NPV @5.0% | CAN$M | 121.4 | 160.3 | 199.2 | 238.0 | 276.9 |
IRR | % | n/a | n/a | n/a | n/a | n/a |
Payback | Years | n/a | n/a | n/a | n/a | n/a |
Percent Variation in NPV | % | -39 | -20 | 0 | +20 | +39 |
Table 29: Economic metrics sensitivity to variations in the gold price
Description | Units | After Tax Net Present Value @ 5% | |||||
Percent Variation | % | -20% | -10% | Base | +10% | +20% | +36.7% |
Au Price | US$/oz | 2,925 | 3,291 | 3,656 | 4,022 | 4,388 | 5,000 |
NPV @5.0% | CAN$M | -6.5 | 96.3 | 199.2 | 302.0 | 404.9 | 415.1 |
IRR | % | n/a | n/a | n/a | n/a | n/a | |
Payback | Years | n/a | n/a | n/a | n/a | n/a | |
Percent Variation in NPV | % | -103 | -52 | 0 | +52 | +103 | +108 |
Table 30: Economic metrics sensitivity to variations in the total OPEX
Description | Units | After Tax Net Present Value @ 5% | ||||
Percent Variation | % | -20% | -10% | Base | +10% | +20% |
Operating Cost | CAN$M | 580.8 | 653.3 | 725.9 | 798.5 | 871.1 |
NPV @5.0% | CAN$M | 313.7 | 256.4 | 199.2 | 141.9 | 84.7 |
IRR | % | n/a | n/a | n/a | n/a | n/a |
Payback | Years | n/a | n/a | n/a | n/a | n/a |
Percent Variation in NPV | % | +57 | +29 | 0 | -29 | -57 |
Table 31: Economic metrics sensitivity to variations in the total capex (includes Sustaining Capital and Closure Costs)
Description | Units | After Tax Net Present Value @ 5% | ||||
Percent Variation | % | -20% | -10% | Base | +10% | +20% |
Capital Cost | CAN$M | 112.0 | 126.0 | 140.0 | 154.0 | 168.0 |
NPV @5.0% | CAN$M | 220.4 | 209.8 | 199.2 | 188.6 | 177.9 |
IRR | % | n/a | n/a | n/a | n/a | n/a |
Payback | Years | n/a | n/a | n/a | n/a | n/a |
Percent Variation in NPV | % | +11 | +5 | 0 | -5 | -11 |
100
The following Figure 5 and Figure 6 graphically show the tabulated NPV @ 5% values as well as the percent variations in these NPV values from the base case NPV @ 5% value.
Figure 5: After-tax NPV 5%: sensitivity to recovery, price, CAPEX, and OPEX
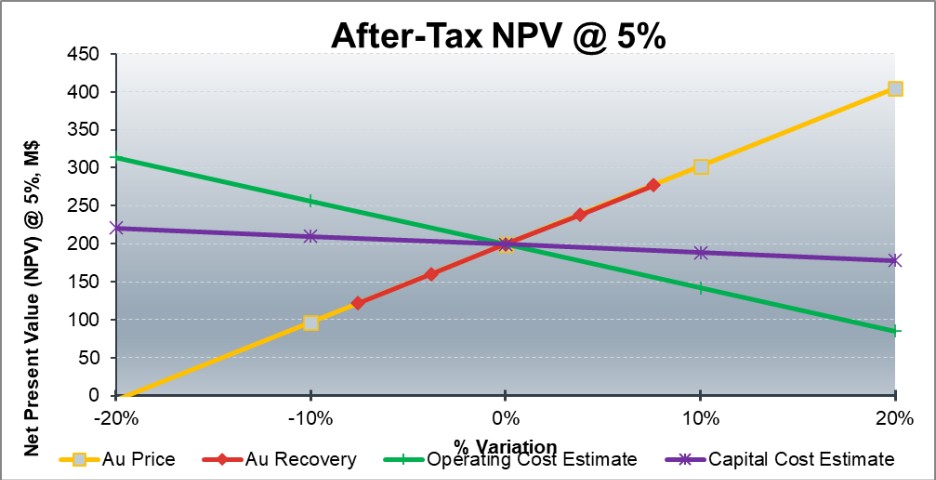
Figure 6: After-tax percent variation in NPV 5%: sensitivity to recovery, price, CAPEX, and OPEX
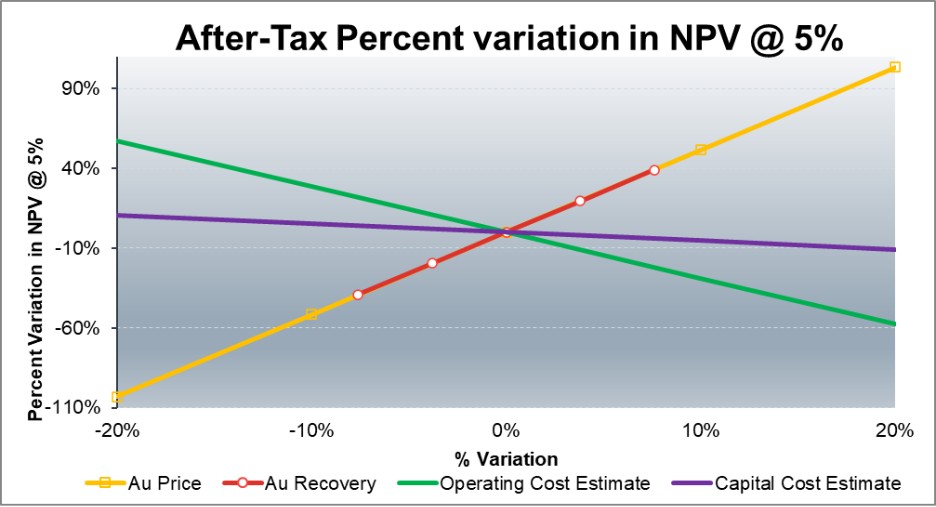
6.20 |
The Hammerdown Property is situated within the Green Bay area and is surrounded by mineral licences held by third parties, although New Found Gold controls a contiguous land package that includes the Whisker Valley and Gull Ridge blocks, providing a substantial exploration buffer around the deposit.
101
Approximately 14 km from the Hammerdown deposit lies the Little Deer Deposit, owned by FireFly Metals Ltd., a high-grade copper-rich volcanogenic massive sulphide (VMS) system with reported Measured, Indicated, and Inferred Mineral Resources prepared under JORC (2012) and NI 43-101 standards.
The Pine Cove Gold Property is largely bordered by water, with its southern boundary adjoining third-party mineral licences, including the Ming Mine, also held by FireFly Metals Ltd (“Firefly”). FireFly has reported a current MRE for Ming, a VMS deposit hosted in rocks of the Pacquet Harbour Group, which is geologically distinct from the gold mineralization at Pine Cove.
The Qualified Person has not independently verified the information related to adjacent properties, and such information is not necessarily indicative of mineralization on the Hammerdown or Pine Cove Gold Properties.
6.21 |
For complete details on interpretations and conclusions, please refer to Section 25 of the technical report.
6.21.1 | Geology and Mineral Resources |
Hammerdown Deposit
The Hammerdown deposit hosts structurally controlled quartz-vein gold mineralization typical of orogenic lode gold systems. Drilling data and QA/QC results from recent exploration programs are considered adequate for Mineral Resource estimation.
Open pit–constrained Mineral Resources include Measured resources of 271 kt at 8.24 g/t Au (72 koz), Indicated resources of 1,823 kt at 1.96 g/t Au (115 koz), and Inferred resources of 973 kt at 2.59 g/t Au (81 koz). No underground Mineral Resources are reported. Mineral Resources are not Mineral Reserves and have not demonstrated economic viability.
Orion Deposit
The Orion gold deposit consist of a structurally controlled system, typical of orogenic, volcanic hosted lode gold deposits. The database and related QA/QC generated from the Orion drilling programs is considered reliable and suitable for use in mineral resource estimation.
The total open pit constrained indicated mineral resource for the Orion deposit is estimated at 598 kt grading 1.75 g/t Au, (33.6 koz Au). The total open pit constrained inferred mineral resource is estimated at 91 kt grading 1.92 g/t Au, (5.6 koz Au). The total underground indicated mineral resource is estimated at 636 kt grading 1.92 g/t Au, (39.3 koz Au), while the underground inferred mineral resource is estimated at 523 kt grading 2.16 g/t Au, (36.2 koz Au). Combined, the Orion deposit hosts a total indicated mineral resource of 1,234 kt grading 1.84 g/t Au, (72.9 koz Au), and a total inferred mineral resource of 614 kt grading 2.12 g/t Au, (41.8 koz Au). Mineral resources are not mineral reserves and do not have demonstrated economic viability.
Stog’er Tight Deposit
The Stog’er Tight deposit, the gold mineralization consists of a dense and a complex vein system structurally controlled with pyrite replacement typical of orogenic gold deposit. Drilling data and QA/QC data are reliable and of sufficient quality for mineral resource estimation.
The Stog’er Tight deposit hosts a total inferred open pit constrained mineral resource of 545 kt grading 2.16 g/t Au, (37.8 koz Au). Mineral resources are not mineral reserves and do not have demonstrated economic viability.
102
6.21.2 | Mining Methods |
The PEA is preliminary in nature, it includes Inferred Mineral Resources that are considered too speculative geologically to have economic considerations applied to them that would enable them to be categorized as Mineral Reserves, and there is no certainty that the PEA will be realized. No Mineral Reserves are defined for the Project.
The PEA has demonstrated the potential to extract the mineralized material at Hammerdown, Orion and Stog’er Tight using open pit mining methods. The project is projected over a 13-year life of mine with a processing rate of 700 tpd. The average strip ratio over the LOM is 11.4 with an average mining rate of 12,300 tpd. Total extracted material equals 54.1 Mt including 4.4 Mt of mineralized material at an average grade of 2.19 g/t Au for 306.6 koz, 48.0 Mt of waste and 1.7 Mt of overburden.
6.21.3 | Recovery Methods |
The Pine Cove process plant currently treats material via a conventional flotation-leach-Merrill Crowe flowsheet to nominally process 700 tpd material. Run-of-mine (ROM) material is currently processed via a two-stage crushing plant at the Hammerdown mine and then hauled to the Pine Cove plant. It is proposed to install a three-stage crushing plant with an ore sorter at the Hammerdown mine and continue to haul crushed material to the Pine Cove plant.
6.21.4 | Project Infrastructure |
The Hammerdown Project plans to use open-pit mining and processing ore at the existing Pine Cove Mill, with tailings stored nearby in an existing permitted in-pit facility. Most needed infrastructure is either already available or scheduled for upgrades that can meet the industry standards required for a PEA-level study.
6.21.5 | Environmental Studies, Permitting and Social and Community Engagement |
| ● | Pine Cove, Hammerdown/Orion, and Stog’er Tight include legacy disturbances and localized water quality issues that guide monitoring and permitting needs. |
| ● | Pine Cove requires updates to dam safety instrumentation and water management infrastructure. |
| ● | Hammerdown, Stog’er Tight, and Pine Cove operate under existing provincial approvals, while Orion will require a new EA registration. |
| ● | All sites (Hammerdown/Orion, Stog’er Tight, and Pine Cove) are influenced by hydrogeological conditions that affect inflows, pit/pond interactions, and water handling needs. |
| ● | Hammerdown/Orion require deeper testing and groundwater modelling, while Stog’er Tight requires fracture zone delineation and 3D modelling. |
| ● | Pine Cove groundwater inflow influences pit lake evolution and closure planning. |
| ● | Hammerdown/Orion stockpile toe seepage should be incorporated into updated site wide water management plans. |
| ● | All sites require integrated water management plans that reflect inflows, groundwater behaviour, pond interactions, and seasonal variability. |
| ● | Hammerdown/Orion and Stog’er Tight require deeper testing and numerical modelling to refine inflow estimates, understand pit/pond interactions, and support updated water management and permitting needs. |
103
| ● | Stog’er Tight requires water level control strategies to support development, including Fisheries Act engagement and associated fish habitat considerations. |
6.21.6 | Capital and Operating Cost Estimates |
The estimated capital and operating costs are reasonable for a PEA level analysis.
6.21.7 | Economic Analysis |
Based on the available information, the project has an after-tax NPV of $199.2M at a discount rate of 5% and with positive cashflows for the initial four years neither an IRR nor a Payback in years is applicable. The sensitivity analysis indicates that the Project economics are most sensitive to the gold price and the gold recoveries. As an example, Table 29 shows that with a US$2,925/oz gold price that is 20% below the base case of $3,656/oz, the Project NPV goes negative, while with a February 18th near spot US$5,000/oz gold price the Project NPV more than doubles.
6.22 |
6.22.1 | Mineral Resource |
The main mineral resource opportunities at the Hammerdown deposit are the upside potential to add mineral resources within the current MRE pit optimization or on its fringe, and the potential to add mineral resources contained within backfilled historical stopes.
The Orion deposit offers opportunities to increase mineral resources by converting the inferred mineralized zones to the indicated category within the pit shell, as well as the potential to define mineralization at depth, which remains open down-plunge to the northeast.
The main opportunities at the Stog’er Tight deposit are the remaining gold in the stockpiles, the potential underestimation of mineralization due to under-sampled drill holes that created gaps in the MRE, and possible extensions, both laterally and particularly at depth.
6.22.2 | Mining |
The opportunities related to mining include:
| ● | The processing of sorter rejects at the end of the mine life if economic conditions are favourable, which amount to 1,195 kt at 0.33 g/t for 12.6 koz. |
| ● | The inclusion in the mine plan of resources not currently considered; particularly the underground resources at the Orion deposit which include 636 kt at 1.92 g/t for 39.3 koz. in the indicated category and 523 kt at 2.16 for 36.2 koz. in the inferred category. |
6.23 |
6.23.1 | Mineral Resource |
The main mineral resource risks at the Hammerdown deposit are the uncertainty of the historically mined stopes and associated precision of the geological model, and the narrow vein style of mineralization that may lead to difficult dilution management. A derisking drilling program is recommended to alleviate the risk related to the stope placement, and a geological modeling using minimum thicknesses and monitoring of grade control model are recommended to mitigate the risk related to the width of mineralization.
The principal risk at the Orion deposit is the limited number of drill holes used in the MRE. Orion remains at an exploratory stage and requires infill drilling to increase confidence in the resource model.
104
The main mineral resource risks at the Stog’er Tight deposit are the uncertainty associated with mineralized zones defined by downdip diamond drilling, and the complex geometry and discontinuity of the vein system, which complicate mineralization delineation. An infill drilling program at appropriate orientations, including televiewer surveys, is recommended to improve delineation of mineralized zones, reduce uncertainty in the current geological model, and enhance understanding of the structural controls on mineralization.
6.23.2 | Mining |
The risks related to mining include:
| ● | Differences in geological model versus what is mined. |
| ● | Mine dilution at Hammerdown considering the narrow nature of the veins being mined in an open pit environment. |
| ● | Geotechnical risks, particularly the possible impact related to the Captain Nemo Fault which is in the vicinity of the Hammerdown deposit. |
6.24 |
6.24.1 | Mineral Resource |
Hammerdown Deposit
Based on the risks and opportunities identified, and general observations made on the mineral resource estimate, the Hammerdown deposit QP recommends a diamond drilling work program to target at-risk areas and inferred mineral resource conversion, grade control block model reconciliation with the MRE model, as well as QA/QC monitoring for its diamond drilling programs.
Orion Deposit
Diamond drilling recommendations at the Orion deposit can be summarized as follows:
| ● | Carry out conversion drilling in inferred mineral zones to upgrade those blocks to indicated mineral resources. |
| ● | Consider using screen-metallic analysis with gravimetric finish, or AA with gravimetric finish, for samples containing coarse gold or for samples falling above the established coarse-gold threshold. |
Stog’er Tight Deposit
The authors recommend additional work be carried out to continue exploring the Pine Cove Property and enhance the economic potential of the Hammerdown Gold Project.
Diamond drilling recommendations at the Stog’er Tight deposit can be summarized as follows:
| ● | To proceed to an independent surveyor to confirm collar coordinates for the majority of holes with remaining collar. |
| ● | To correct minor inconsistencies in the current merged database using raw data or corrected source files (e.g. final depth, lithological gap, project header...) |
| ● | To record some geological features such as vein intervals, alteration and deformation in a specific table. |
105
| ● | To conduct an infill sampling program on existing drill cores. |
| ● | To add field duplicates to the QA/QC routine at the same nominal frequency as the other QA/QC sample types in further DDH programs |
| ● | To proceed with televiewer survey on a selection of drill holes to better understand mineralized vein system and structural framework on the deposit. |
| ● | Conduct an infill drilling program to better delineate mineralized zones such as the apparent ore shoots. |
| ● | To pursuit exploration work in the Stog’er Tight deposit and test depth extensions of the mineralization as well as possible three subsidiary zones, in the north-western port of the 278 Zone, at depth below the Gabbro Zone and to the north of the Gabbro Zone. |
6.24.2 | Mineral Processing and Metallurgical Testing |
Additional metallurgical and mineralogical characterisation studies are recommended as the mineralisation is processed in order to further refine the process flowsheet variables through operations. The following is recommended:
| ● | Further study should be undertaken at site on the Merrill Crowe circuit with assay of the solutions prior and post precipitation. |
| ● | As operations continue to process the mineralisation, comparison and corrections should be made to the data set to further build on the level of metallurgical understanding this project already owns. |
The process plant resumed operations in 2025 and was commissioned on low grade stockpiles and then commenced treating material from the Hammerdown deposit in Q4 2025. It is recommended to continue to optimize plant operations.
6.24.3 | Mining Methods |
Several studies should be performed to further optimize and define the mine design and schedule as well as supporting mine infrastructure. The following work is recommended:
| ● | Hammerdown Phase 2 pit design optimization considering the geotechnical constraints pertaining to the Captain Nemo Fault. |
| ● | Detailed planning of mine extraction schedule as well as infrastructure requirements. |
| ● | Condemnation drilling for supporting mine infrastructure; particularly the Hammerdown and Orion waste rock storage facility. |
6.24.4 | Recovery Methods |
It is recommended that the sorting plant be constructed to allow for two sorters to maintain sorting efficiencies into operations.
6.24.5 | Project Infrastructure |
Water Management
| ● | Advance design for future phases |
106
| ● | Enhance Hydrologic and Groundwater Monitoring |
| ● | Expand Water Quality Characterization |
| ● | Conduct Settling Pond Optimization Studies |
| ● | Evaluate Future Treatment Requirements |
| ● | Review and Integrate Legacy Infrastructure Performance |
6.24.6 | Environment, Permitting and Social Community Engagement |
Water Management
| ● | Integrate stockpile toe-seepage estimates |
| ● | Advance development of comprehensive water management plans |
| ● | Develop water-level management plans for Fox Pond and Camp Pond at Stog’er Tight |
Fisheries Act and Pond Interaction Considerations
| ● | Initiate engagement with Fisheries and Oceans Canada (DFO) regarding Stog’er Tight |
| ● | Maintain existing habitat offset measures at Pine Cove |
Environment Baseline and Geochemical Programs
| ● | Continue environmental baseline updates |
| ● | Expand geochemical testing |
| ● | Continue long-term monitoring at Pine Cove under the MDMER |
| ● | Monitor discharge volumes and effluent quality parameters for Hammerdown, Orion and Stog’er Tight to identify when sites approach/meet MDMER applicability criteria |
Permitting and Regulatory Planning
| ● | Confirm and implement provincial EA and permitting requirements for Orion |
| ● | Update and resubmit the development plan, operational plan, and RCP (including Pit 278) for Stog’er Tight |
| ● | Maintain compliance with applicable legislation |
Stakeholder, Indigenous, and Regulator Engagement
| ● | Continue to engage with regulators, Indigenous groups, and local communities |
| ● | Provide regular opportunities for stakeholder input |
7 |
7.1 |
The Company has not, since the date of its incorporation, declared or paid any dividends or other distributions on its Common Shares, and does not currently have a policy with respect to the payment of dividends or other distributions. The Company does not currently pay dividends and does not intend to pay dividends in the foreseeable future. The declaration and payment of any dividends in the future is at the discretion of the Board and will depend on numerous factors, including compliance with applicable laws, financial performance, working capital requirements of the Company and its subsidiaries, and such other factors as its directors consider appropriate. There can be no assurance that the Company will pay dividends under any circumstances. See “Risk Factors – Risks Related to the Company – Dividends”.
107
8 |
8.1 |
The Company’s authorized share capital consists of an unlimited number of common shares without par value (the “Common Shares”). As at December 31, 2025, there were 342,329,665 Common Shares issued and outstanding. As of the date of this AIF, there are 345,212,549 Common Shares issued and outstanding and 22,111,833 Common Shares issuable upon exercise of outstanding stock options (“Options”), restricted share units (“RSUs”) and warrants (“Warrants”).
All of the Common Shares rank equally as to voting rights, participation in a distribution of the assets of the Company on a liquidation, dissolution or winding-up of the Company and entitlement to any dividends declared by the Company. The holders of the Common Shares are entitled to receive notice of, and to attend and vote at, all meetings of shareholders (other than meetings at which only holders of another class or series of shares are entitled to vote). Each Common Share carries the right to one vote. In the event of the liquidation, dissolution or winding-up of the Company, or any other distribution of the assets of the Company among its shareholders for the purpose of winding-up its affairs, the holders of the Common Shares will be entitled to receive, on a pro rata basis, all of the assets remaining after the payment by the Company of all of its liabilities. The holders of Common Shares are entitled to receive dividends as and when declared by the Board in respect of the Common Shares on a pro rata basis. The Common Shares do not have pre-emptive rights, conversion rights or exchange rights and are not subject to redemption, retraction purchase for cancellation or surrender provisions. There are no sinking or purchase fund provisions, no provisions permitting or restricting the issuance of additional securities or any other material restrictions, and there are no provisions which are capable of requiring a security holder to contribute additional capital.
Any alteration of the rights, privileges, restrictions and conditions attaching to the Common Shares under the Company’s Articles must be approved by at least two-thirds of the Common Shares voted at a meeting of the Company’s shareholders.
9 |
9.1 |
The Common Shares are currently listed for trading through the facilities of the TSXV under the symbol “NFG” and on the NYSE American under the symbol “NFGC”. No other securities of New Found Gold are traded or quoted on any marketplace.
During the most recently completed financial year, the Common Shares traded on the TSXV as follows, based on information obtained from Bloomberg:
TSXV | |||
Month | Volume | High ($) | Low ($) |
January 2025 | 5,882,503 | 2.85 | 2.33 |
February 2025 | 10,329,254 | 2.85 | 2.37 |
March 2025 | 22,104,480 | 2.79 | 1.38 |
April 2025 | 10,475,226 | 1.83 | 1.34 |
May 2025 | 10,715,114 | 2.20 | 1.47 |
June 2025 | 10,348,178 | 2.37 | 1.91 |
July 2025 | 7,433,663 | 2.55 | 1.84 |
August 2025 | 4,965,166 | 2.68 | 2.06 |
September 2025 | 20,729,537 | 3.57 | 2.46 |
October 2025 | 20,639,722 | 3.95 | 2.55 |
November 2025 | 13,727,236 | 3.38 | 2.62 |
December 2025 | 20,748,965 | 4.54 | 3.41 |
108
During the most recently completed financial year, the Common Shares traded on the NYSE American as follows, based on information obtained from Bloomberg:
NYSE AMERICAN | |||
Month | Volume | High (US$) | Low (US$) |
January 2025 | 564,730 | 1.97 | 1.62 |
February 2025 | 956,520 | 1.99 | 1.62 |
March 2025 | 2,103,529 | 1.93 | 0.97 |
April 2025 | 1,441,760 | 1.32 | 0.93 |
May 2025 | 1,849,681 | 1.60 | 1.07 |
June 2025 | 1,376,401 | 1.73 | 1.40 |
July 2025 | 947,974 | 1.86 | 1.34 |
August 2025 | 777,289 | 1.95 | 1.50 |
September 2025 | 2,218,886 | 2.57 | 1.78 |
October 2025 | 2,105,975 | 2.81 | 1.82 |
November 2025 | 1,608,181 | 2.42 | 1.86 |
December 2025 | 3,243,576 | 3.32 | 2.46 |
9.2 |
The following tables summarize the securities issued by the Company during the most recently completed financial year, involving securities that are not listed on the TSXV or the NYSE American.
9.2.1 | Stock Option Plan and Share Unit Plan – Options and RSUs |
Issue Date | Type of | Number | Issue | Exercise | Description of Issuance |
May 13, 2025 | Options | 3,770,000 | N/A | 1.67 | Options issued to certain employees and directors of the Company pursuant to the Stock Option Plan |
September 26, 2025 | Options | 809,167 | N/A | 2.97 | Options issued to certain employees and consultants of the Company pursuant to the Stock Option Plan |
November 6, 2025 | Options | 66,944 | N/A | 2.70 | Options issued to certain employees of the Company pursuant to the Stock Option Plan |
January 20, 2025 | RSUs | 200,000 | N/A | 0.00 | RSUs issued to a director of the Company pursuant to the Share Unit Plan |
March 3, 2025 | RSUs | 300,000 | N/A | 0.00 | RSUs issued to a director of the Company pursuant to the Share Unit Plan |
August 20, 2025 | RSUs | 300,000 | N/A | 0.00 | RSUs issued to a director of the Company pursuant to the Share Unit Plan |
September 15, 2025 | RSUs | 753,000 | N/A | 0.00 | RSUs issued to certain directors and employee of the Company pursuant to the Share Unit Plan |
November 6, 2025 | RSUs | 41,348 | N/A | 0.00 | RSUs issued to an employee of the Company pursuant to the Share Unit Plan |
December 4, 2025 | RSUs | 300,000 | N/A | 0.00 | RSUs issued to a director of the Company pursuant to the Share Unit Plan |
109
9.2.2 | The Arrangement – Replacement Options and Maritime Warrants |
Issue Date | Type of | Number | Issue | Exercise | Description of Issuance |
November 13, 2025 | Options | 450,000 | N/A | 2.40 | Replacement Options issued to certain directors, employees and consultants of Maritime |
November 13, 2025 | Options | 382,500 | N/A | 0.67 | Replacement Options issued to certain directors, employees and consultants of Maritime |
November 13, 2025 | Options | 363,750 | N/A | 0.80 | Replacement Options issued to certain directors, employees and consultants of Maritime |
November 13, 2025 | Options | 1,279,709 | N/A | 1.47 | Replacement Options issued to certain directors, employees and consultants of Maritime |
November 13, 2025 | Registered Warrants | 30,088,430 | N/A | 1.03 | Maritime warrants exercisable for Common Shares |
November 13, 2025 | Registered Warrants | 125,791,570(3) | N/A | 1.60 | Maritime warrants exercisable for Common Shares |
November 13, 2025 | Broker Warrants | 33,173,740 | N/A | 0.67 | Maritime warrants exercisable for Common Shares |
November 13, 2025 | Broker Warrants | 2,663,250 | N/A | 1.03 | Maritime warrants exercisable for Common Shares |
November 13, 2025 | Broker Warrants | 10,622,930 | N/A | 1.00 | Maritime warrants exercisable for Common Shares |
November 13, 2025 | Broker Warrants | 605,389 | N/A | 1.51 | Maritime warrants exercisable for Common Shares |
Notes:
| (1) | In accordance with the Arrangement, each Maritime Option was cancelled and exchanged for a Replacement Option to acquire from the Company such number of Common Shares equal to the product of: (A) that number of Maritime shares that were issuable upon exercise of such Maritime Option immediately prior to the Effective Time and (B) the Exchange Ratio, at an exercise price per Common Share equal to the quotient determined by dividing: (X) exercise price per Maritime share at which such Maritime Option was exercisable immediately prior to the Effective Time, by (Y) the Exchange Ratio. |
| (2) | Pursuant to the Arrangement, each outstanding Maritime share purchase warrant became exercisable for Common Shares issuable on exercise and adjusted in accordance with the Exchange Ratio. |
| (3) | Approximate due to CDS holdings. |
10 |
The following table summarizes the securities issued by the Company during the most recently completed financial year, involving securities that are subject to a contractual restriction on transfer; and the percentage that number represents of the outstanding securities of that class for the Company’s most recently completed financial year:
Type of Security | Number of securities subject to a | Percentage of issued and |
Common Shares | () | % |
Note:
(1) | Subject to a property option agreement pursuant to which the holder of the securities must not trade the securities before. |
110
11 |
11.1 |
The name, province or state of residence, positions held with the Company, and principal occupation within the five preceding years of each director and executive officer of New Found Gold as at the date of this AIF are as follows:
Name, Province and | Position(s) and | Principal Occupation(s) During Past Five | Director |
|---|---|---|---|
Paul Huet 2, 4 | Director, Non-Executive Chair of the Board | Director, Non-Executive Chair of the Board, New Found Gold, December 2024 – present; Director, Chairman, and Chief Executive Officer, Culico Metals Inc., April 2024 – present; Chief Executive Officer, Americas Gold and Silver Corporation, November 2024 – present; Director, Chairman, and Chief Executive Officer, Karora Resources Inc., November 2018 – August 2024. All of the foregoing companies are mineral exploration and development companies. | December 2024 |
Keith Boyle | Chief Executive Officer and Director | Chief Executive Officer, Director, New Found Gold, January 2025 – present; Chief Operating Officer, Reunion Gold Corp., August 2023 – July 2024; Chief Operating Officer, Superior Gold Corp., April 2019 – August 2021. All of the foregoing companies are mineral exploration and development companies. | January 2025 |
Melissa Render | President | President, New Found Gold, December 2024 – present; Director, New Found Gold, December 2024 – November 2025; VP Exploration, New Found Gold, January 11, 2022 – December 2024; former Senior Project Geologist, Elko Mining Group; former Senior Project Geologist, TMAC Resources Inc.; former Gold Exploration Consultant, Kinross Gold Corp.; former Gold Exploration Consultant, Chalice Gold Mines Ltd.; former Gold Exploration Consultant, McEwen Mining Inc.; former Gold Exploration Consultant Warrior Gold Inc.; former Gold Exploration Consultant, New Found Gold Corp. All of the foregoing companies are mineral exploration and development companies. | December 2024 |
William Hayden 3, 4, 5 | Director | Director, Ivanhoe Mines Ltd., March 2007 – June 2025; Director, Trilogy Metals Inc., June 2015 – present; Director, Nevada King Gold Corp., June 2022 – present; Director, Palisades Gold Corp., June 2022 – October 2024. All of the foregoing companies are mineral exploration and development companies. | December 2024 |
111
Name, Province and Country of Residence | Position(s) and Office(s) with New Found Gold | Principal Occupation(s) During Past Five | Director /Executive Officer Since |
Chad Williams 1, 3 Ontario, Canada | Director | Director, New Found Gold, March 2025 – present; Chairman and Founder, Red Cloud Mining Capital Inc., September 2011 –present; Chairman, Mines D’Or Orbec Inc., February 2020 – December 2025; Chairman and Director, Honey Badger Silver Inc., August 2020 – present; Director, Karora Resources Inc., January 2020 – August 2024; Chairman, Blue Thunder Mining Corporation (renamed Orbec), June 2017 – December 2025; Director, Silver Storm Mining Ltd., September 2019 – September 2022; Director, Koryx Copper Inc., October 2020 – February 2022. All of the foregoing companies, except Red Cloud Mining Capital Inc., which is a brokerage firm, are mineral exploration and development companies. | March 2025 |
Jared Saunders | Vice President, Sustainability | Vice President, of Sustainability, New Found Gold, February 18, 2025 – present; Director of Environment and Regulatory Affairs, New Found Gold, September 2023 – February 2025; Environmental Superintendent, Vale Newfoundland & Labrador Ltd., January 2022 – September 2023; Environmental Supervisor, Vale Newfoundland & Labrador Ltd., March 2014 - January 2022. All of the foregoing companies are mineral exploration and development companies. | February 2025 |
Fiona Christina Childe | Vice President, Communications and Corporate Development | Vice President Communications and Corporate Development, New Found Gold, February 2025 – present; Mining Industry Consultant, January 2016 – February 2025; Vice President Corporate Development and Communications, Sanu Gold Corporation, August 2022 – February 2024. All of the foregoing companies are mineral exploration and development companies. | February 2025 |
Allen Palmiere 1, 4 | Director | Director, New Found Gold, November 2025 – present; Director, Maritime Resources Corp., November 2023 – November 2025; Director, Dundee Corp., June 2019 – present; Director and CEO, Gold Resource Corp., January 2021 – present. All of the foregoing companies are mineral exploration and development companies, except Dundee Corp. which is a mining investments company. | November 2025 |
Tamara Brown 1, 2 | Director | Director, New Found Gold, September 2025 – present; Partner, Oberon Capital Corporation, 2022 – present; Director, Orla Mining Ltd. (TSX:OLA), June 2022 – present; Director, Lithium Royalty Corp. (TSV: LIRC), February 2023 – March 2026 (sold to Altius Minerals Inc.); 29Metals Limited (ASX:29M), April 2023 – October 2025. All of the foregoing companies are mineral exploration and development companies. | August 2025 |
112
Name, Province and Country of Residence | Position(s) and Office(s) with New Found Gold | Principal Occupation(s) During Past Five | Director /Executive Officer Since |
Andrew Furey, MD, FRCSC, MSc., MSM 2, 3 | Director | Director, New Found Gold, September 2025 – present; Vice Chair, National Bank of Canada, March 2026 – present (bank); Orthopedic Surgeon, NL Health Services, May 2025 – present (health); Premier of Newfoundland and Labrador, Government of Newfoundland and Labrador, August 2020 – May 2025 (government); Director, Alderon Iron Ore Corp., May 2017 – March 2020. Except as noted above, all of the foregoing companies are mineral exploration and development companies. | September 2025 |
Hashim Ahmed | Chief Financial Officer | Chief Financial Officer, New Found Gold, September 2025 – present; Chief Financial Officer, Mandalay Resources, February 2024 – August 2025; Chief Financial Officer, Nova Royalty (precious metals royalty company), March 2023 – December 2023; Chief Financial Officer, Jaguar Mining, August 2016 – March 2023. Except as noted above, all of the foregoing companies are mineral exploration and development companies. . | September 2025 |
Robert Assabgui | Chief Operating Officer | Chief Operating Officer, New Found Gold, September 2025 – present; various roles through ERA Mining Consulting Inc. (Study Manager, New Found Gold, February 2025 – September 2025; Study Manager, Reunion Gold, December 2024 – July 2025; SME, Torrex Gold, August 2025; Consultant, Capstone Copper, September 2023 – present); SME, Capstone Copper, September 2022 – July 2023; Vice President Manitoba Operations, Hudbay Minerals, October 2017 – June 2022. All of the foregoing companies are mineral exploration and development companies. | September 2025 |
Jelena Novikov Fried | General Counsel and Corporate Secretary | General Counsel and Corporate Secretary, New Found Gold, November 2025 – present; Legal Director, Li-Cycle Corp. (lithium-ion battery resource recovery), March 2023 – August 2025; Senior Counsel, Caravel Law LLP (law firm), February 2016 – March 2023. | November 2025 |
Notes:
(1) | Member of the Audit Committee. Mr. Palmiere is the Chair of the Audit Committee. |
(2) | Member of the Nominating and Compensation Committee. Ms. Brown is the Chair of the Nominating and Compensation Committee. |
(3) | Member of the Governance and Sustainability Committee. Mr. Furey is the Chair of the Governance and Sustainability Committee. |
(4) | Member of the Technical Committee. Mr. Hayden is the Chair of the Technical Committee. |
(5) | Lead Director. |
As at March 25, 2026, based on the disclosure available on the System for Electronic Disclosure by Insiders (“SEDI”), the directors and executive officers of the Company, as a group, beneficially owned, directly or indirectly, or exercised control or direction over 509,616 Common Shares, representing approximately 0.15 % of the total number of Common Shares outstanding before giving effect to the exercise of Options or Awards held by such directors and executive officers.
113
11.2 |
The term of office for each director of New Found Gold expires at the next annual general meeting of shareholders of the Company.
The members of Board committees are appointed by the Board as soon as possible following each annual general meeting of shareholders of the Company.
The officers of New Found Gold are appointed by the Board and hold office for such period and on such terms as the Board may determine.
11.3 |
The committees of the Board and the directors serving on each of the committees are described below:
11.4 |
11.4.1 | Overview |
The audit committee (the “Audit Committee”) is comprised of Allen Palmiere (Chair), Chad Williams, and Tamara Brown, all of whom are “financially literate” and “independent” as such terms are defined in National Instrument 52-110 – Audit Committees (“NI 52-110”).
The Audit Committee provides assistance to the Board in fulfilling its obligations relating to the integrity of the internal financial controls and financial reporting of the Company. The external auditors of the Company report directly to the Audit Committee. The Audit Committee’s primary duties and responsibilities include: (i) reviewing and reporting to the Board on the annual audited financial statements (including the auditor’s report thereon) and unaudited interim financial statements and any related management’s discussion and analysis, if any, and other financial disclosure related thereto that may be required to be reviewed by the Audit Committee pursuant to applicable legal and regulatory requirements; (ii) reviewing material changes in accounting policies and significant changes in accounting practices and their impact on the financial statements; (iii) overseeing the audit function, including engaging in required discussions with the Company’s external auditor and reviewing a summary of the annual audit plan at least annually, overseeing the independence of the Company’s external auditor, overseeing the Company’s internal auditor, and pre-approving any non-audit services to the Company; (iv) reviewing and discussing with management the appointment of key financial executives and recommending qualified candidates to the Board; (v) reviewing with management and the Company’s external auditors, at least annually, the integrity of the internal controls over financial reporting and disclosure; (vi) reviewing management reports related to legal or compliance matters that may have a material impact on the Company and the effectiveness of the Company’s compliance policies; and (vii) establishing whistleblowing procedures and investigating any complaints or concerns it deems necessary.
The full text of the Audit Committee Charter is attached to this AIF as Schedule “A”.
11.4.2 | Relevant Education and Experience |
Each member of the Audit Committee has adequate education and experience that is relevant to their performance as an Audit Committee member and, in particular, the requisite education and experience that have provided the member with:
(a) | an understanding of the accounting principles used by the Company to prepare its financial statements and the ability to assess the general application of those principles in connection with estimates, accruals and reserves; |
114
(b) | experience preparing, auditing, analyzing or evaluating financial statements that present a breadth and level of complexity of accounting issues that are generally comparable to the breadth and complexity of issues that can reasonably be expected to be raised by the Company’s financial statements or experience actively supervising individuals engaged in such activities; and |
(c) | an understanding of internal controls and procedures for financial reporting. |
Allen Palmiere
Allen Palmiere is a Chartered Accountant-Chartered Public Accountant by training, with over 40 years of experience in the mining industry, from a financial and operational perspective. Mr. Palmiere’s expertise includes operations, executive management and financing, both debt and equity. Additionally, Mr. Palmiere has extensive experience in mergers and acquisitions. Mr. Palmiere’s former executive positions include CEO and Chairman of the board, HudBay Minerals Inc., Executive Chairman, Barplats Investments Ltd., Vice President, CFO, Zemex Corporation, and President and CEO, Breakwater Resources Ltd. Mr. Palmiere has also served as a director of numerous public companies. Mr. Palmiere is currently the CEO, President and a Director of Gold Resource Corporation.
Chad Williams
Chad Williams is the Chairman and Founder of Red Cloud Mining Capital Inc. Mr. Williams has extensive experience in mining finance and management, having previously held the positions of CEO of Victoria Gold Corp. and Head of Mining Investment Banking at Blackmont Capital Inc., and was a highly ranked mining analyst at TD Bank and other Canadian brokerage firms.
Tamara Brown
Tamara Brown is a mining industry professional with over 30 years of experience in the mining, capital markets and M&A sectors. She is currently a partner of Oberon Capital Corp., a leading charity flow-through provider, and was most recently the Interim Chief Executive Officer of Superior Gold Inc., a gold producer. Tamara is currently an independent director of Orla Mining Ltd. (TSX), a gold producer. Her previous executive roles include Vice President, Investor Relations and Corporate Development (Americas) for Newcrest Mining Ltd., a global gold producer; Vice President, Corporate Development and Investor Relations for Primero Mining Corp., a gold and silver producer; and Director of Investor Relations for IAMGOLD Corp. Tamara began her career as a professional engineer in the mining industry and was formerly a partner of a boutique investment banking firm. Tamara holds a Bachelor of Engineering from Curtin University in Australia and has completed the Chartered Business Valuator Course at York University.
11.4.3 | Pre-Approval Policies and Procedures |
The Audit Committee mandate requires that the Audit Committee pre-approve any retainer of the auditor of the Company to perform any non-audit services to the Company that it deems advisable in accordance with applicable legal and regulatory requirements and policies and procedures of the Board. The Audit Committee is permitted to delegate pre-approval authority to one of its members; however, the decision of any member of the Audit Committee to whom such authority has been delegated must be presented to the full Audit Committee at its next scheduled meeting.
11.4.4 | Reliance on Certain Exemptions |
At no time since the commencement of the Company’s most recently completed financial year has the Company relied on the exemption in section 2.4 of NI 52-110 (De Minimis Non-audit Services), the exemption in section 3.2 of NI 52-110 (Initial Public Offerings), the exemption in subsection 3.3(2) of NI 52-110 (Controlled Companies), the exemption in section 3.4 of NI 52-110 (Events Outside Control of
115
Member), the exemption in section 3.5 of NI 52-110 (Death, Disability or Resignation of Audit Committee Member), the exemption in section 3.6 of NI 52-110 (Temporary Exemption for Limited and Exceptional Circumstances), the exemption in section 3.8 of NI 52-110 (Acquisition of Financial Literacy) or an exemption from NI 52-110, in whole or in part, granted under Part 8 of NI 52-110 (Exemptions).
11.4.5 | External Auditor Service Fees by Category |
The fees billed by the Company’s external auditors in each of the last two fiscal years for audit and non-audit related services provided to the Company or its subsidiaries (if any) were as follows:
Financial Year Ending | Audit Fees | Audit Related Fees (1) | Tax Fees (2) | All Other Fees (3) |
|---|---|---|---|---|
December 31, 2025 | $780,359 | $Nil | $Nil | $Nil |
December 31, 2024 | $332,660 | $Nil | $Nil | $Nil |
Notes:
(1) | Fees charged for assurance and related services that are reasonably related to the performance of an audit, and not included under Audit Fees. |
(2) | Fees charged for tax compliance, tax advice and tax planning services. |
(3) | Fees for services other than disclosed in any other column. |
11.5 |
On May 12, 2025, upon the recommendation of the nominating and corporate governance committee, the Board approved a realignment of committee responsibilities. The nominating aspect was transferred to the compensation committee, which was subsequently renamed the “Nominating and Compensation Committee”. Concurrently, the former nominating and corporate governance committee was renamed the “Governance and Sustainability Committee” to reflect its updated focus.
The Nominating and Compensation Committee is comprised of Tamara Brown (Chair), Paul Huet and Andrew Furey. Tamara Brown and Andrew Furey are considered “independent” pursuant to NI 52-110. Paul Huet is not considered “independent” pursuant to NI 52-110.
In consultation with the Board, the Nominating and Compensation Committee identifies and recommends to the Board potential nominees for election or re-election to the Board as well as individual directors to serve as members and chairs of each committee. The Nominating and Compensation Committee establishes and reviews with the Board the appropriate skills and characteristics required of members of the Board, taking into consideration the Board’s short-term needs and long-term succession plans. In addition, the Nominating and Compensation Committee develops, and annually updates, a long-term plan for the Board’s composition, taking into consideration the characteristics of independence, age, skills, experience and availability of service to the Company of its members, as well as opportunities, risks, and strategic direction of the Company.
Each member of the Nominating and Compensation Committee has business and other experience which is relevant to their position as a member of the Nominating and Compensation Committee. By virtue of their differing professional backgrounds, business experience, knowledge of the Company’s industry, knowledge of corporate governance practices and, where appropriate, service on compensation committees of other reporting issuers and experience interacting with external consultants and advisors, the members of the Nominating and Compensation Committee are able to make decisions on the suitability of the Company’s compensation policies and practices.
The charter of the Nominating and Compensation Committee provides that it is responsible for, among other things, (i) reviewing and approving corporate goals and objectives relevant to the compensation of the CEO and other senior executive officers, evaluating the performance of the CEO and the other senior executive officers in light of those goals and objectives and recommending to the Board for approval their
116
annual compensation levels based on this evaluation; and (ii) recommending to the Board compensation and expense reimbursement policies for directors, including annual Board and committee retainers, meeting fees, share-based grants and benefits conferred upon the Board.
While the Board is ultimately responsible for determining all forms of compensation to be awarded to the CEO, other executive officers, directors and the Nominating and Compensation Committee will, when appropriate, review the Company’s compensation philosophy, policies, plans and guidelines and recommend any changes to the Board.
11.6 |
The governance and sustainability committee (the “Governance and Sustainability Committee”) is comprised of Andrew Furey (Chair), William Hayden and Chad Williams, all of whom are considered “independent” pursuant to NI 52-110.
The Governance and Sustainability Committee is responsible for assisting the Board in fulfilling its oversight responsibilities related to corporate governance, environmental stewardship, and social responsibility. Among other things, the Governance and Sustainability Committee: (i) advises the Board on the Company’s sustainability and community engagement strategies, environmental performance, and ESG-related risks; (ii) conducts periodic reviews of the Company’s corporate governance policies and annual disclosures to ensure alignment with current regulatory guidelines, stock exchange rules, and evolving best practices; (iii) establishes guidelines for external corporate disclosures (other than those reviewed by the Audit Committee) to ensure their accuracy, credibility, and strategic impact; (iv) manages the periodic review of written charters and terms of reference for the Board and each of its committees, recommending revisions as necessary; and (v) oversees and recommends updates to the orientation and education programs for new and sitting directors.
11.7 |
The technical committee (the “Technical Committee”) is comprised of William Hayden (Chair), Allen Palmiere, and Paul Huet. William Hayden and Allen Palmiere are considered “independent” pursuant to NI 52-110. Paul Huet is not considered “independent”, pursuant to NI 52-110.
The purpose of the Technical Committee is to provide assurance to the Board regarding the Company’s operational performance and operating risks. The Technical Committee oversees core areas requiring specialized technical expertise, including: (i) exploration, permitting, development, execution, and construction, operation of mining activities, security, and supply chain management; (ii) resources and reserves on the Company’s mineral resource properties; (iii) operating and production plans for proposed and existing operating mines; (iv) project and operations readiness; (v) major commercial commitments; and (vi) ensuring the Company implements best-in-class standards for property development and operating practices.
Pursuant to its Charter, the Technical Committee’s primary responsibilities include: (i) reviewing and assessing the reporting of all operating activities, including exploration, mining, development, execution, construction, security, and supply chain management; (ii) reviewing risk management procedures and monitoring risks in all operating activities; (iii) reviewing the effectiveness of the reporting of technical and operating matters; (iv) assessing the adequacy of strategic planning, forecasting, and budgeting; (v) assessing legal and regulatory compliance for technical and operating matters; (vi) assessing the performance of key operating personnel and operating teams, and engaging third-party technical consultants when necessary; (vii) advising the CEO when required on specific M&A opportunities as requested by the Board or management; and (viii) reporting to the Board on all material technical and operating matters, including major commercial arrangements, material proposals, and contracts with key service providers and contractors.
117
11.8 |
In May 2025, the Board appointed William Hayden as Lead Director. The Board is committed to strong independent leadership and believes that the appointment of an independent Lead Director is particularly important given that the Chair of the Board is not considered “independent” within the meaning of NI 52-110.
The Lead Director is responsible for providing leadership to the independent directors and ensuring that the Board functions independently of management. Key responsibilities of the Lead Director include: (i) presiding over all executive sessions of the independent directors held in conjunction with Board meetings; (ii) serving as the principal liaison between the independent directors and the Chair of the Board and/or the CEO; (iii) collaborating with the Chair of the Board and Corporate Secretary to ensure that the Board has sufficient resources and time to discuss matters of importance to the independent directors; and (iv) addressing any potential conflicts of interest that may arise involving the Chair of the Board or management.
11.9 |
None of the Company’s directors or executive officers is, as of the date of this AIF, or was within 10 years before the date of this AIF, a director, chief executive officer or chief financial officer of any company (including the Company) that (a) was subject to a cease trade order, an order similar to a cease trade order or an order that denied the relevant issuer access to any exemption under securities legislation, that was in effect for a period or more than 30 consecutive days (an “Order”) that was issued while the director or executive officer was acting in the capacity as director, chief executive officer or chief financial officer of such issuer, or (b) was subject to an Order that was issued after the director or executive officer ceased to be a director, chief executive officer or chief financial officer and which resulted from an event that occurred while that person was acting in the capacity as director, chief executive officer or chief financial officer.
Except as disclosed below, none of the Company’s directors or executive officers, nor, to its knowledge, any shareholder holding a sufficient number of its securities to affect materially the control of the Company (a) is, as at the date of this AIF, or has been within the 10 years before the date of this AIF, a director or executive officer of any company (including the Company) that, while that person was acting in that capacity, or within a year of that person ceasing to act in that capacity, became bankrupt, made a proposal under any legislation relating to bankruptcy or insolvency or was subject to or instituted any proceedings, arrangement or compromise with creditors or had a receiver, receiver manager or trustee appointed to hold its assets, or (b) has, within the 10 years before the date of this AIF, become bankrupt, made a proposal under any legislation relating to bankruptcy or insolvency, or become subject to or instituted any proceedings, arrangement or compromise with creditors, or had a receiver, receiver manager or trustee appointed to hold the assets of such director, executive officer or shareholder.
Mr. Boyle was an officer of Chieftain Metals Inc. (“CMI”) and Chieftain Metals Corp. (“CMC” and together with CMI, “Chieftain”) from February 7, 2011 to September 8, 2016. An application was made by West Face Capital Inc., as agent (“WFCI”), for an order under subsection 243(1) of the Bankruptcy and Insolvency Act (Canada) and section 101 of the Courts of Justice Act (Ontario) appointing Grant Thornton Limited as receiver, without security, of all the assets, undertakings and properties of Chieftain. WFCI acts as the investment adviser to West Face Long Term Opportunities Global Master L.P. (“West Face”). West Face is the largest secured creditor of Chieftain. The order was granted on September 6, 2016 and trading was suspended thereafter.
Mr. Furey was a director Alderon Iron Ore Corp. (“Alderon”) from May 2017 to March 2020. Alderon entered into receivership in June 2020 after failing to repay a loan to Sprott Private Resource Lending. On April 1, 2021, Champion Iron Limited (“Champion”) completed the acquisition of the mining properties of the Kamistiatusset iron ore project located in the Labrador Trough geological belt in southwestern Newfoundland, and certain related contracts, previously owned by Alderon and its certain of its affiliates, in the context of the receivership proceedings of Alderon. In connection therewith, Champion acquired
118
approximately $19.4 million in secured debt of Alderon owed to Sprott Private Resource Lending (Collector), LP for a consideration of 4.2 million ordinary shares of Champion.
None of the Company’s directors or executive officers, nor, to its knowledge, any shareholder holding a sufficient number of its securities to affect materially the control of the Company, has been subject to (a) any penalties or sanctions imposed by a court relating to securities legislation or by a securities regulatory authority or has entered into a settlement agreement with a securities regulatory authority, or (b) any other penalties or sanctions imposed by a court or regulatory body that would likely be considered important to a reasonable investor in making an investment decision.
The information contained in this AIF as to ownership of securities of the Company, corporate cease trade orders, bankruptcies, penalties or sanctions, and existing or potential conflicts of interest, not being within the knowledge of the Company, has been provided by each director and executive officer of the Company individually.
11.10 |
To the best of the Company’s knowledge, there are no existing or potential material conflicts of interest between the Company and any of its directors or officers as of the date hereof. However, certain of the Company’s directors and officers are, or may become, directors or officers of other companies with businesses which may conflict with its business. Accordingly, conflicts of interest may arise which could influence these individuals in evaluating possible acquisitions or in generally acting on the Company’s behalf. See also “Risk Factors – Conflicts of Interest”.
Pursuant to the BCBCA, directors and officers of the Company are required to act honestly and in good faith with a view to the best interests of the Company.
Generally, as a matter of practice, directors who have disclosed a material interest in any contract or transaction that the Board is considering will not take part in any Board discussion respecting that contract or transaction. If on occasion such directors do participate in the discussions, they will refrain from voting on any matters relating to matters in which they have disclosed a material interest. In appropriate cases, the Company will establish a special committee of independent directors to review a matter in which directors or officers may have a conflict.
12 |
Other than described below, to the Company’s knowledge, there are no legal proceedings or regulatory actions material to the Company to which it is a party, or has been a party to, or of which any of its property is the subject matter of, or was the subject matter of, since the beginning of the financial year ended December 31, 2025, and no such proceedings or actions are known by the Company to be contemplated.
13 |
Except as disclosed in this AIF, to the knowledge of the Company, no director or executive officer, or person or company that beneficially owns, or controls and directs, directly or indirectly, more than 10 percent of the any class or series of the voting securities of the Company, or any associate or affiliate of the foregoing, have had any material interest, direct or indirect, in any transaction within the three most recently completed financial years or during the current financial year prior to the date of this AIF that has materially affected or is reasonably expected to materially affect the Company.
Certain directors and/or executive officers have been granted Options and or Awards (as defined below) and have received consulting fees for services provided to New Found Gold.
119
14 |
New Found Gold’s transfer agent and registrar is Computershare Investor Services Inc. at its principal office in Vancouver, British Columbia.
15 |
Except for material contracts entered into in the ordinary course of business, the Company’s stock option plan and share unit plan are the only material contracts to which New Found Gold is a party to or entered into in the financial year ended December 31, 2025, or subsequently prior to the date of this AIF, or material contracts entered into prior to the beginning of the financial year ended December 31, 2025, which remain in effect as at the date of this AIF.
Stock Option Plan
The Company has established a stock option plan (the “Stock Option Plan”) under which directors, officers, employees and consultants of the Company (including any subsidiary of the Company) may be granted Options to acquire Common Shares. The Stock Option Plan is a “rolling” plan, whereby the aggregate number of Common Shares reserved for issuance thereunder, combined with the Common Shares issuable pursuant to Awards granted under the Share Unit Plan (as defined below), shall not exceed ten (10%) percent of the total number of issued Common Shares (calculated on a non-diluted basis) at the time an Option is granted. Every Option granted under the Stock Option Plan has a term not exceeding 10 years after the date of grant. There are currently 6,223,286 Options issued and outstanding as at the date of this AIF.
Share Unit Plan
The Company has established a share unit plan (the “Share Unit Plan”) under which eligible Participants (as such term is defined under the Share Unit Plan) may be granted other stock-based compensation consisting of restricted share units (“RSUs”), deferred share units (“DSUs”), and performance share units (“PSUs”, and together with RSUs and DSUs, the “Awards”). The Share Unit Plan is supplementary to the Stock Option Plan, and was established to provide the Company with another equity-based mechanism to attract, retain and motivate directors, officers, employees, and consultants by the grant of Awards under the Share Unit Plan from time to time for their contributions toward the long-term goals of the Company and to enable and encourage them to acquire Common Shares as long-term investments. The Share Unit Plan is a “rolling” plan, whereby the aggregate number of Common Shares reserved for issuance shall not exceed five percent (5%) of the total number of issued Common Shares (calculated on a non-diluted basis) at the time an Award is granted, provided that Common Shares issued thereunder, combined with Common Shares issuable pursuant to grants under the Stock Option Plan, shall not exceed ten percent (10%) of the total number of issued Common Shares (calculated on a non-diluted basis) at the time an Award is granted.
Other than as disclosed herein, New Found Gold is not aware of any material contracts of the Company that were entered into (a) within the last financial year and up to the date of this AIF, or (b) before the last financial year but still in effect, and that is required to be filed under Part 12 of NI 51-102 or that would be required to be filed under 51-102 but for the fact that it was previously filed.
16 |
Information of a scientific or technical nature in respect of the Queensway Gold Project is included in this AIF based upon the Queensway Technical Report with an effective date of June 30, 2025 prepared by Pierre Landry, P.Geo. of SLR Consulting, Lance Engelbrecht, P.Eng. of SLR Consulting, David M. Robson, P.Eng. of SLR Consulting, and Sheldon H. Smith, P.Geo. of Stantec, each a “Qualified Person” as defined under NI 43-101.
120
Information of a scientific or technical nature in respect of the Hammerdown Project is included in this AIF based upon the Hammerdown Technical Report with an effective date of February 18, 2026, prepared by Stephen Coates, P.Eng. of Evomine Consulting Inc., Christian Beaulieu, P.Geo. of Minéralis Consulting Services Inc., Michael Levy, P.Eng. of JDS Energy & Mining Inc., Chafana Hamed Sako, P.Geo. of Norda Stelo Inc., James Guiraud, P.Geo. of Norda Stelo Inc., Stacy J. Freudigmann, P.Eng. of Canenco Consulting Corp., Sheldon H. Smith, P.Geo. of Stantec Consulting Ltd., J. Alex Mcintyre, P.Eng. of Knight Piésold Ltd., Neil J. Lincoln, P.Eng. of Lincoln Metallurgical, Inc., Dachun (David) Jin, P.Eng. of WSP Canada Inc., and William Richard McBride, P.Eng. of WSP Canada Inc., each a “Qualified Person” as defined under NI 43-101.
To the best of the Company’s knowledge, after reasonable inquiry, as of the date hereof, the aforementioned individuals and their respective firms do not beneficially own, directly or indirectly, any Common Shares.
The technical content disclosed in this AIF, other than the technical content disclosed in Sections 5 and 6 hereof, was reviewed and approved by Keity Boyle, P.Eng., Chief Executive Officer of the Company and a Qualified Person as defined in NI 43-101. To the knowledge of the Company, Keith Boyle is the registered or beneficial owner, directly or indirectly, of less than one percent of the outstanding Common Shares.
KPMG LLP, the auditor of the Company’s annual financial statements as of and for the years ended December 31, 2025 and 2024, has confirmed that that they are independent of the Company within the meaning of the relevant rules and related interpretations prescribed by the relevant professional bodies in Canada and any applicable legislation or regulations and also that they are independent accountants with respect to the Company under all relevant U.S. professional and regulatory standards.
17 |
Additional information relating to New Found Gold may be found under New Found Gold’s profile on SEDAR+ at www.sedarplus.ca and on EDGAR at www.sec.gov.
Additional information, including directors’ and officers’ remuneration and indebtedness, principal holders of New Found Gold’s securities and securities authorized for issuance under equity compensation plans, is contained in New Found Gold’s information circular for its most recent annual meeting of securityholders that involved the election of directors. Additional financial information in relation to New Found Gold is provided in the Company’s audited financial statements and management’s discussion and analysis for the years ended December 31, 2025 and 2024.
A
121
SCHEDULE “A”
CHARTER OF THE AUDIT COMMITTEE OF NEW FOUND GOLD CORP.
1.ROLE AND OBJECTIVE
The Audit Committee (the “Committee”) is appointed by and reports to the Board of Directors (the “Board”) of New Found Gold Corp. (the “Corporation”). The Committee assists the Board in fulfilling its oversight responsibilities relating to financial accounting and reporting process and internal controls for the Corporation.
The Committee and its membership shall to the best of its ability, knowledge and acting reasonably, meet all applicable legal, regulatory and listing requirements, including, without limitation, those of any stock exchange on which the Corporation’s shares are listed, the Business Corporations Act (British Columbia) (the “Act”), and all applicable securities regulatory authorities.
2.COMPOSITION
| ● | The Committee shall be composed of three or more directors as shall be designated by the Board from time to time. |
| ● | At least two members of the Committee shall be “independent” and each Committee member shall be financially literate (as such terms are defined under applicable securities laws and exchange requirements for audit committee purposes). Each member of the Committee shall be able to read and understand the Corporation’s financial statements, including the Corporation’s statement of financial position, income statement and cash flow statement and any other applicable statements or notes to the financial statements. |
| ● | Members of the Committee shall be appointed at a meeting of the Board, typically held following the annual shareholders’ meeting. Each member shall serve until his/her successor is appointed unless he/she shall resign or be removed by the Board or he/she shall otherwise cease to be a director of the Corporation. Any member may be removed or replaced at any time by the Board. |
| ● | Where a vacancy occurs at any time in the membership of the Committee, it may be filled by a vote of a majority of the Board. |
| ● | The Chair of the Committee may be designated by the Board or, if it does not do so, the members of the Committee may elect a chair by vote of a majority of the full Committee membership. The Chair of the Committee shall be an independent director (as described above). |
| ● | If the Chair of the Committee is not present at any meeting of the Committee, one of the other members of the Committee present at the meeting shall be chosen by the Committee to preside. |
| ● | The Chair of the Committee presiding at any meeting shall not have a casting vote. |
| ● | The Committee shall appoint a secretary (the “Secretary”) who need not be a member of the Committee or a director of the Corporation. The Secretary shall keep minutes of the meetings of the Committee. This role is normally filled by the Secretary of the Corporation. |
3.MEETINGS
| ● | The Committee shall meet at least quarterly, at the discretion of the Chair or a majority of its members, as circumstances dictate or as may be required by applicable legal or listing requirements, provided that meetings of the Committee shall be convened whenever requested by |
1
the auditor that is appointed by the shareholders (the “Independent Auditor”) or any member of the Committee in accordance with the Act.
| ● | Notice of the time and place of every meeting may be given orally, in writing, by facsimile or by e-mail to each member of the Committee, when possible at least 48 hours prior to the time fixed for such meeting. |
| ● | A member may in any manner waive notice of the meeting. Attendance of a member at the meeting shall constitute waiver of notice of the meeting, except where a member attends a meeting for the express purpose of objecting to the transaction of any business on the grounds that the meeting was not lawfully called. |
| ● | Any member of the Committee may participate in the meeting of the Committee by means of conference telephone or other communication equipment, and the member participating in a meeting pursuant to this paragraph shall be deemed, for purposes hereof, to be present in person at the meeting. |
| ● | A majority of Committee members, present in person, by video-conference, by telephone or by a combination thereof, shall constitute a quorum. |
| ● | If within one hour of the time appointed for a meeting of the Committee, a quorum is not present, the meeting shall stand adjourned to the same hour on the next business day following the date of such meeting at the same place. If at the adjourned meeting a quorum as hereinbefore specified is not present within one hour of the time appointed for such adjourned meeting, such meeting shall stand adjourned to the same hour on the next business day following the date of such meeting at the same place. If at the second adjourned meeting a quorum as hereinbefore specified is not present, the quorum for the adjourned meeting shall consist of the members then present. |
| ● | If and whenever a vacancy shall exist, the remaining members of the Committee may exercise all of its powers and responsibilities so long as a quorum remains on the Committee. |
| ● | At all meetings of the Committee, every question shall be decided by a majority of the votes cast. In case of an equality of votes, the matter will be referred to the Board for decision. Any decision or determination of the Committee reduced to writing and signed by all of the members of the Committee shall be fully effective as if it had been made at a meeting duly called and held. |
| ● | The CEO and CFO are expected to be available to attend meetings when requested, but a portion of every meeting will be reserved for in camera discussion without the CEO or CFO, or any other member of management, being present. |
| ● | The Committee may by specific invitation have other resource persons in attendance such officers, directors and employees of the Corporation and its subsidiaries, and other persons, including the Independent Auditor, as it may see fit, from time to time, to attend at meetings of the Committee. |
| ● | The Board may at any time amend or rescind any of the provisions hereof, or cancel them entirely, with or without substitution. |
| ● | The Committee shall have the right to determine who shall and who shall not be present at any time during a meeting of the Committee. |
| ● | Minutes of Committee meetings shall be sent to all Committee members. |
| ● | The Chair of the Committee shall report periodically the Committee’s findings and recommendations to the Board. |
2
4.RESOURCES AND AUTHORITY
| ● | The Committee shall have access to such officers and employees of the Corporation and its subsidiaries and to such information with respect to the Corporation and its subsidiaries as it considers being necessary or advisable in order to perform its duties and responsibilities. |
| ● | The Committee shall have the authority to engage and obtain advice and assistance from internal or external legal, accounting or other advisors and resources, as it deems advisable, at the expense of the Corporation. |
| ● | The Committee shall have the authority to communicate directly with the Independent Auditor. |
5.RESPONSIBILITIES
A.Chair
To carry out its oversight responsibilities, the Chair of the Committee shall undertake the following:
| ● | provide leadership to the Committee with respect to its functions as described in this Charter and as otherwise may be appropriate, including overseeing the logistics of the operations of the Committee; |
| ● | chair meetings of the Committee, unless not present (including in camera sessions), and report to the Board following each meeting of the Committee on the findings, activities and any recommendations of the Committee; |
| ● | ensure that the Committee meets on a regular basis and at least four times per year; |
| ● | in consultation with the Committee members, establish a calendar for holding meetings of the Committee; |
| ● | ensure that Committee materials are available to any director on request; |
| ● | report annually to the Board on the role of the Committee and the effectiveness of the Committee in contributing to the objectives and responsibilities of the Board as a whole; |
| ● | foster ethical and responsible decision making by the Committee and its individual members; |
| ● | encourage Committee members to ask questions and express viewpoints during meetings; |
| ● | together with the Corporate Governance and Nominating Committee, oversee the structure, composition, membership and activities delegated to the Committee from time to time; |
| ● | ensure that resources and expertise are available to the Committee so that it may conduct its work effectively and efficiently; |
| ● | attend each meeting of shareholders to respond to any questions from shareholders as may be put to the Chair; and |
| ● | perform such other duties and responsibilities as may be delegated to the Chair by the Board from time to time. |
3
B.The Committee
The Committee has the authority to conduct any investigation appropriate to its responsibilities, and it may request the Independent Auditor as well as any officer of the Corporation, or outside counsel for the Corporation, to attend a meeting of the Committee or to meet with any members of, or advisors to, the Committee. The Committee shall have unrestricted access to the books and records of the Corporation and has the authority to retain, at the expense of the Corporation, special legal, accounting, or other consultants or experts to assist in the performance of the Committee’s duties.
The Committee is hereby delegated the duties and powers specified in Section 225 of the Act and, without limiting these duties and powers, the Committee will carry out the following responsibilities:
Financial Accounting and Reporting Process and Internal Controls
| ● | review the annual audited financial statements and report thereon to the Board and recommend to the Board whether or not same should be approved prior to their being filed with the appropriate regulatory authorities. The Committee shall also review and approve the interim financial statements prior to their being filed with the appropriate regulatory authorities. The Committee shall discuss significant issues regarding accounting principles, practices, and judgments of management with management and the Independent Auditor as and when the Committee deems it appropriate to do so. The Committee shall satisfy itself that the information contained in the annual audited financial statements is not significantly erroneous, misleading or incomplete and that the audit function has been effectively carried out. |
| ● | assess the integrity of internal controls and financial reporting procedures and ensure implementation of appropriate controls and procedures. |
| ● | review the financial statements, management’s discussion and analysis relating to annual and interim financial statements, and press releases and any other public disclosure documents containing financial disclosure before the Corporation publicly discloses this information. |
| ● | be satisfied that adequate procedures are in place for the review of the Corporation’s public disclosure of financial information extracted or derived from the Corporation’s financial statements, and periodically assess the adequacy of these procedures. |
| ● | meet no less frequently than annually with the Independent Auditor and the Chief Financial Officer or, in the absence of a Chief Financial Officer, with the officer of the Corporation in charge of financial matters, to review accounting practices, internal controls and such other matters as the Committee deems appropriate. |
| ● | inquire of management and the Independent Auditor about significant risks or exposures, both internal and external, to which the Corporation may be subject, and assess the steps management has taken to minimize such risks. |
| ● | review the post-audit or management letter containing the recommendations of the Independent Auditor and management’s response and subsequent follow-up to any identified weaknesses. |
| ● | oversee the Corporation’s plans to adopt changes to accounting standards and related disclosure obligations. |
| ● | in consultation with the Corporate Governance and Nominating Committee, ensure that there is an appropriate standard of corporate conduct including, if necessary, adopting and overseeing a corporate code of ethics for senior financial personnel. |
4
| ● | establish procedures for: |
| ● | the receipt, retention and treatment of complaints received by the Corporation regarding accounting, internal accounting controls or auditing matters; and |
| ● | the confidential, anonymous submission by employees of the Corporation of concerns regarding questionable accounting or auditing matters. |
| ● | provide oversight to related party transactions entered into by the Corporation. |
Independent Auditor
| ● | recommend to the Board for approval by shareholders, the selection, appointment and compensation of the Independent Auditor; |
| ● | be directly responsible for oversight of the Independent Auditor and the Independent Auditor shall report directly to the Committee; |
| ● | with reference to the procedures outlined separately in “Procedures for Approval of Non-Audit Services” (attached hereto as Appendix ‘A’), pre-approve all audit and non-audit services not prohibited by law to be provided by the Independent Auditor; |
| ● | review the Independent Auditor’s audit plan, including scope, procedures, timing and staffing of the audit; |
| ● | review the results of the annual audit with the Independent Auditor, including matters related to the conduct of the audit, and receive and review the auditor’s interim review reports; and |
| ● | review fees paid by the Corporation to the Independent Auditor and other professionals in respect of audit and non-audit services on an annual basis. |
Other Responsibilities
| ● | perform any other activities consistent with this Charter and governing law, as the Committee or the Board deems necessary or appropriate; |
| ● | institute and oversee special investigations, as needed; and |
| ● | review and assess the adequacy of this Charter annually and submit any proposed revisions to the Board for approval. |
5
Appendix A
Policy for Approval of Non-Audit Services
1. | In the event that New Found Gold Corp. (the “Corporation”) or a subsidiary of the Corporation wishes to retain the services of the Corporation’s Independent Auditor for services other than the annual audit (e.g. tax compliance, tax advice or tax planning, to meet the requirements of a regulatory filing or due diligence, to receive advice on various matters, etc.), the Chief Financial Officer of the Corporation shall consult with the Audit Committee of the Board of Directors (the “Committee”), who shall have the authority to approve or disapprove such non-audit services. The Chair of the Committee has the authority to approve or disapprove such non-audit services on behalf of the Committee, and shall advise Committee of such pre-approvals no later than the time of the next meeting of the Committee following such pre-approval having been given. |
2. | The Committee, or the Chair of the Committee, as appropriate, shall confer with the Independent Auditor regarding the nature of the services to be provided and shall not approve any services that would be considered to impair the independence of the Independent Auditor. For greater clarity, the following is a non-exhaustive list of the categories of non-audit services that would be considered to impair the independence of the Independent Auditor: |
(a) | bookkeeping or other services related to or requiring management decisions in connection with the Corporation’s accounting records or financial statements; |
(b) | financial information systems design and implementation; |
(c) | appraisal or valuation services, fairness opinion or contributions-in-kind reports; |
(d) | actuarial services; |
(e) | internal audit outsourcing services; |
(f) | management functions; |
(g) | human resources; |
(h) | broker or dealer, investment adviser or investment banking services; |
(i) | legal services; |
(j) | expert services unrelated to the audit; and |
(k) | any other service that the Canadian Public Accountability Board or any other applicable regulatory authority determines is impermissible. |
3. | The Chief Financial Officer of the Corporation shall maintain a record of non-audit services approved by the Chair of the Committee or the Committee for each fiscal year and provide a report to the Committee any services pre-approved since the last report, at each meeting and no less frequently than on a quarterly basis. |
4. | In accordance with the requirements set forth under the “Exemption for minimal non-audit services” provided by Section 2.3(4) of National Instrument 52-110 — Audit Committees, whereby the Independent Auditor has commenced a service and: |
6
(a) | the Corporation or the subsidiary entity of the Corporation, as the case may be, and the Independent Auditor did not recognize the services as non-audit services at the time of the engagement; |
(b) | once recognized as non-audit services, the services are promptly brought to the attention of the Committee and approved by the Committee prior to the completion of the audit; and |
(c) | the aggregate fees for the non-audit services not previously approved are immaterial in comparison to the aggregate fees paid by the Corporation to the Corporation’s Independent Auditor during the financial year in which the services are provided, such services shall be exempted from the requirements for pre-approval of non-audit services set out in this Policy. |
7
