Pay vs Performance Disclosure - USD ($)
Dec. 31, 2025
Dec. 31, 2024
Dec. 31, 2023
Pay vs Performance Table
Year |
Summary Compensation Table Total for PEO (1) |
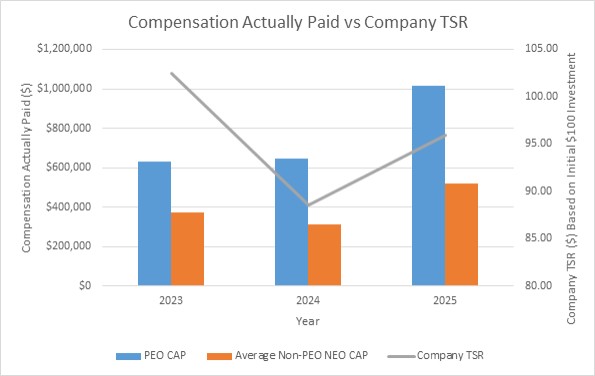
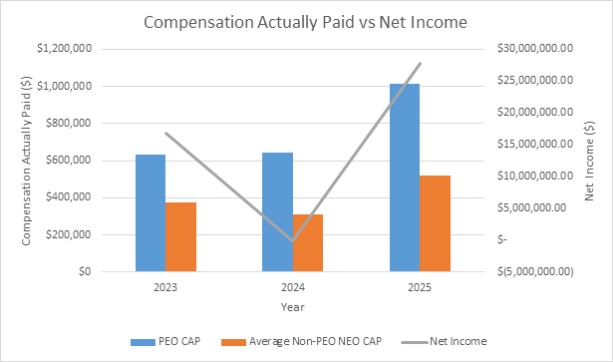
Compensation Actually Paid to PEO (3) |
Average Summary Compensation Table Total for Non-PEO NEOs (2) |
Average Compensation Actually Paid to Non-PEO NEOs (4) |
Value of Initial Fixed $100 Investment Based on Total Stockholder Return (5) |
Net Income | ||||||||||||||||||
2025 |
$ | 1,009,784 | $ | 1,014,487 | $ | 520,592 | $ | 521,743 | $ | 95.92 | $ | 27,755,000 | ||||||||||||
2024 |
$ | 874,697 | $ | 645,166 | $ | 369,474 | $ | 309,820 | $ | 88.52 | $ | (160,000 | ) | |||||||||||
2023 |
$ | 816,435 | $ | 633,359 | $ | 414,108 | $ | 374,382 | $ | 102.42 | $ | 16,759,106 | ||||||||||||
| (1) | Mr. Donnelly was the PEO for each year presented in the table. For Mr. Donnelly, Compensation Actually Paid to the PEO in 2025 is less than the Summary Compensation Table (“SCT”) Total as reported for the corresponding year in the “Total” column of the SCT resulting from adjustments in equity award values. See Footnote 3. |
| (2) | For the Non-PEO NEOs, Average Compensation Actually Paid in 2025 is less than the Average SCT Total as reported for the corresponding year in the “Total” column of the SCT resulting from adjustments in equity award values. See Footnote 4. The Non-PEO NEOs for 2025 were: John M. McCaffery and John F. Carmody; the Non-PEO NEOs for 2024 and 2023 were: Vincent G. O’Bell and William Lance. |
| (3) | Equity Award Adjustments for the PEO (Mr. Donnelly): The following table sets forth the adjustments made during the 2025 year to the SCT “Total” column in the Pay vs Performance Table to arrive at Compensation Actually Paid to our PEO during the 2025 year presented: |
Adjustments to Determine Compensation Actually Paid for the PEO (Mr. Donnelly) |
2025 |
|||
Deduction for Amounts Reported under the ‘Stock Awards’ Column in the SCT |
$ | (198,200 | ) | |
Deduction for Amounts Reported under the ‘Option Awards’ Columns in the SCT |
— | |||
Increase for Fair Value of Awards Granted during year that Remain Unvested as of Year end |
$ | 186,561 | ||
Increase for Fair Value of Awards Granted during year that Vest during year |
— | |||
Increase/deduction for Change in Fair Value from Prior Year-end to current Year-end of Awards Granted Prior to year that were Outstanding and Unvested as of Year-end |
8,321 | |||
Increase/deduction for Change in Fair Value from Prior Year-end to Vesting Date of Awards Granted Prior to year that Vested during year |
8,022 | |||
Deduction of Fair Value of Awards Granted Prior to year that were forfeited during year |
— | |||
Increase based upon Incremental Fair Value of Awards Modified during year |
— | |||
Increase based on Dividends or Other Earnings Paid during the year prior to Vesting Date of Award |
— | |||
Total Adjustments |
$ | 4,703 | ||
| (4) | Equity Award Adjustments for the Average Non-PEO NEO Compensation Actually Paid: our Non-PEO NEOs during the 2025 year presented: |
Adjustments to Determine Average Compensation Actually Paid for the Non-PEO NEOs |
2025 |
|||
Deduction for Amounts Reported under the ‘Stock Awards’ Column in the SCT |
$ | (52,150 | ) | |
Deduction for Amounts Reported under the ‘Option Awards’ Columns in the SCT |
— | |||
Increase for Fair Value of Awards Granted during year that Remain Unvested as of Year end |
$ | 49,088 | ||
Increase for Fair Value of Awards Granted during year that Vest during year |
— | |||
Increase/deduction for Change in Fair Value from Prior Year-end to current Year-end of Awards Granted Prior to year that were Outstanding and Unvested as of Year-end |
$ | 2,102 | ||
Increase/deduction for Change in Fair Value from Prior Year-end to Vesting Date of Awards Granted Prior to year that Vested during year |
$ | 2,112 | ||
Deduction of Fair Value of Awards Granted Prior to year that were forfeited during year |
— | |||
Increase based upon Incremental Fair Value of Awards Modified during year |
— | |||
Increase based on Dividends or Other Earnings Paid during the year prior to Vesting Date of Award |
$ | — | ||
Total Adjustments |
$ | 1,151 | ||
| (5) | Cumulative total stockholder return (TSR) is calculated by dividing the sum of the cumulative amount of dividends for the measurement period, assuming dividend reinvestment, and the difference between the Company’s share price at the end and the beginning of the measurement period by the Company’s share price as of December 31, 2022, the beginning of the measurement period. |
| (2) | For the Non-PEO NEOs, Average Compensation Actually Paid in 2025 is less than the Average SCT Total as reported for the corresponding year in the “Total” column of the SCT resulting from adjustments in equity award values. See Footnote 4. The Non-PEO NEOs for 2025 were: John M. McCaffery and John F. Carmody; the Non-PEO NEOs for 2024 and 2023 were: Vincent G. O’Bell and William Lance. |
| (3) | Equity Award Adjustments for the PEO (Mr. Donnelly): The following table sets forth the adjustments made during the 2025 year to the SCT “Total” column in the Pay vs Performance Table to arrive at Compensation Actually Paid to our PEO during the 2025 year presented: |
Adjustments to Determine Compensation Actually Paid for the PEO (Mr. Donnelly) |
2025 |
|||
Deduction for Amounts Reported under the ‘Stock Awards’ Column in the SCT |
$ | (198,200 | ) | |
Deduction for Amounts Reported under the ‘Option Awards’ Columns in the SCT |
— | |||
Increase for Fair Value of Awards Granted during year that Remain Unvested as of Year end |
$ | 186,561 | ||
Increase for Fair Value of Awards Granted during year that Vest during year |
— | |||
Increase/deduction for Change in Fair Value from Prior Year-end to current Year-end of Awards Granted Prior to year that were Outstanding and Unvested as of Year-end |
8,321 | |||
Increase/deduction for Change in Fair Value from Prior Year-end to Vesting Date of Awards Granted Prior to year that Vested during year |
8,022 | |||
Deduction of Fair Value of Awards Granted Prior to year that were forfeited during year |
— | |||
Increase based upon Incremental Fair Value of Awards Modified during year |
— | |||
Increase based on Dividends or Other Earnings Paid during the year prior to Vesting Date of Award |
— | |||
Total Adjustments |
$ | 4,703 | ||
| (4) | Equity Award Adjustments for the Average Non-PEO NEO Compensation Actually Paid: our Non-PEO NEOs during the 2025 year presented: |
Adjustments to Determine Average Compensation Actually Paid for the Non-PEO NEOs |
2025 |
|||
Deduction for Amounts Reported under the ‘Stock Awards’ Column in the SCT |
$ | (52,150 | ) | |
Deduction for Amounts Reported under the ‘Option Awards’ Columns in the SCT |
— | |||
Increase for Fair Value of Awards Granted during year that Remain Unvested as of Year end |
$ | 49,088 | ||
Increase for Fair Value of Awards Granted during year that Vest during year |
— | |||
Increase/deduction for Change in Fair Value from Prior Year-end to current Year-end of Awards Granted Prior to year that were Outstanding and Unvested as of Year-end |
$ | 2,102 | ||
Increase/deduction for Change in Fair Value from Prior Year-end to Vesting Date of Awards Granted Prior to year that Vested during year |
$ | 2,112 | ||
Deduction of Fair Value of Awards Granted Prior to year that were forfeited during year |
— | |||
Increase based upon Incremental Fair Value of Awards Modified during year |
— | |||
Increase based on Dividends or Other Earnings Paid during the year prior to Vesting Date of Award |
$ | — | ||
Total Adjustments |
$ | 1,151 | ||