Pay vs Performance Disclosure - USD ($)
Dec. 31, 2025
Dec. 31, 2024
Dec. 31, 2023
| Value of Initial Fixed $100 Investment Based On: | ||||||||||||||||||||||||||||||||
| Year | Summary Compensation Table Total for Principal Executive Officer (“PEO”) ($) | Compensation Actually Paid to PEO ($)(1) | Average Summary Compensation Table for non-PEO Named Executive Officers ($)(2) | Average Compensation Actually Paid to non-PEO Named Executive Officers($)(2) | Total Shareholder Return ($) | Peer Group Total Shareholder Return ($)(3) | Net Income ($) (in 000,000s) | Adjusted EBITDA ($) (in 000,000s)(4) | ||||||||||||||||||||||||
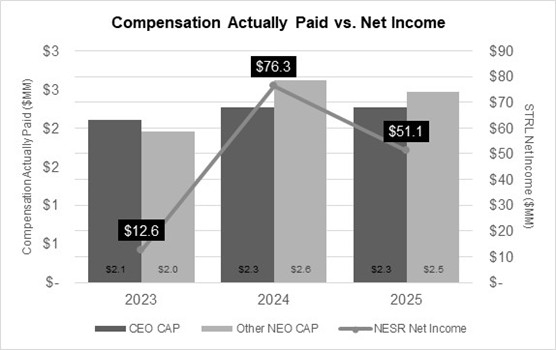
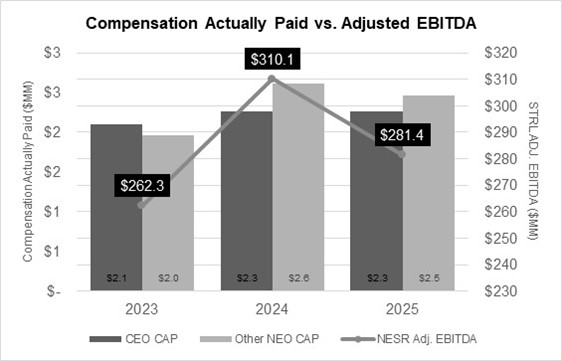
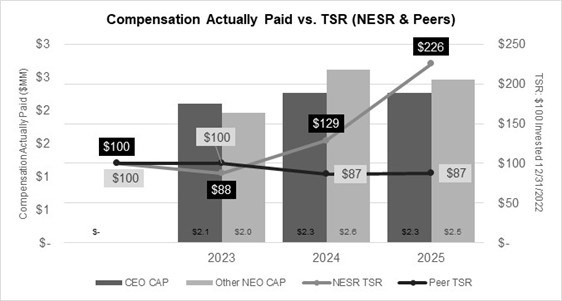
| 2025 | $ | 2,268,000 | $ | 2,268,000 | $ | 1,083,474 | $ | 2,465,947 | $ | 226 | $ | 87 | $ | 51.1 | $ | 281.4 | ||||||||||||||||
| 2024 | 2,268,000 | 2,268,000 | 1,648,765 | 2,616,772 | 129 | 87 | 76.3 | 310.1 | ||||||||||||||||||||||||
| 2023 | 2,100,000 | 2,100,000 | 1,236,355 | 1,960,780 | 88 | 100 | 12.6 | 262.3 | ||||||||||||||||||||||||
(2) The dollar amounts reported in this column represent the average of the amounts reported for the Company’s NEOs as a group, excluding our CEO. The NEOs for each applicable year as follows:
| ● | 2025: Stefan Angeli, Jennifer Howard, Chokri Ben Amor, Naif Al-Hadrami; | |
| ● | 2024: Stefan Angeli, Jennifer Howard, Chokri Ben Amor, Naif Al-Hadrami; | |
| ● | 2023: Stevan Angeli, Dhiraj Dudeja, Chokri Ben Amor, Naif Al-Hadrami. |
(3) The peer group used for purpose is the Philadelphia Oil Service Index (“OSX”).
| Compensation Actually Paid: Adjustments | ||||||||||||||||||||||||||||||
| Year | Executive(s) | Summary compensation table total ($) | Deduct stock awards ($) | Include year-end equity value for awards granted during the year that remain unvested as of year-end ($) | Include Change in value of prior equity awards vesting during year ($) | Deduct value of prior year awards forfeited during year ($) | Include Change in value of prior equity awards not vested during year ($) | Compensation Actually Paid ($) | ||||||||||||||||||||||
| 2025 | CEO | 2,268,000 | 2,268,000 | |||||||||||||||||||||||||||
| Other NEOs | 1,083,474 | (413,400 | ) | 939,600 | 182,847 | (103,125 | ) | 776,552 | 2,465,948 | |||||||||||||||||||||
| 2024 | CEO | 2,268,000 | 2,268,000 | |||||||||||||||||||||||||||
| Other NEOs | 1,648,765 | (1,098,125 | ) | 1,097,600 | 977,698 | (9,167 | ) | 2,616,771 | ||||||||||||||||||||||
| 2023 | CEO | 2,100,000 | 2,100,000 | |||||||||||||||||||||||||||
| Other NEOs | 1,236,355 | (403,750 | ) | 610,000 | 114,609 | 403,565 | 1,960,779 | |||||||||||||||||||||||
Net income
Adjusted EBITDA
Total Shareholder Return
Financial Performance Measures
As described in greater detail in the CD&A, the Company’s executive compensation program reflects a commitment to pay-for-performance. Listed below are the financial performance measures which in our assessment represent the most important performance measures we used to link compensation actually paid to our NEOs, for the 2025 year, to Company performance.
| ● | Net income | |
| ● | Adjusted EBITDA | |
| ● | Total Shareholder Return (“TSR”) |
| [1] | “Compensation Actually Paid” to the CEO and the average “Compensation Actually Paid” to our other NEOs (excluding the CEO) reflect adjustments from Total Compensation reported in the Summary Compensation Table. Adjustments are detailed in the “Compensation Actually Paid: Adjustments” table below. |
| [2] | The dollar amounts reported in this column represent the average of the amounts reported for the Company’s NEOs as a group, excluding our CEO. The NEOs for each applicable year as follows: |
| [3] | The peer group used for purpose is the Philadelphia Oil Service Index (“OSX”). |
| [4] | We have selected Adjusted EBITDA as the most important financial performance measure (that is not otherwise required to be disclosed in the table). |