Pay vs Performance Disclosure
Dec. 31, 2024
Oct. 15, 2024
Dec. 31, 2025
USD ($)
Dec. 31, 2024
USD ($)
Dec. 31, 2023
USD ($)
Dec. 31, 2022
USD ($)
Dec. 31, 2021
USD ($)
Street Reform and Consumer Protection Act, and Item
402(v) of Regulation S-K, we are providing the following
information about the relationship between
compensation actually paid (“CAP”) to the Company’s
principal executive officer (“PEO”) (also referred to as
CEO) and non-principal executive officer NEOs (“Non-PEO
NEOs”) and certain financial performance of the Company.
CAP, as determined under SEC requirements, does not
reflect the actual amount of compensation earned by or
paid to our executive officers during a covered year. For
further information on the Company’s variable pay-for-
performance philosophy and how the Company aligns
executive compensation with the Company’s
Pay Versus Performance
Year | SCT Total for Mr. Papadopoulo (1) | CAP to Mr. Papadopoulo (2) | SCT Total for Mr. Grandisson (3) | CAP to Mr. Grandisson (2) | Average SCT Total for Non- PEO NEOs (4) | Average CAP to Non-PEO NEOs (5) | Value of Initial Fixed $100 Investment Based On: | |||
Total Shareholder Return (6) | Peer Group Total Shareholder Return (7) | Net Income (in millions) (8) | Operating ROE (9) | |||||||
2025 | 14,626,320 | 27,474,443 | N/A | N/A | 6,839,789 | 13,645,220 | 279.66 | 234.32 | 4,359 | 17.1% |
2024 | 31,758,573 | 34,439,042 | 9,421,187 | 17,652,865 | 17,757,846 | 19,320,166 | 269.25 | 212.86 | 4,272 | 18.9% |
2023 | N/A | N/A | 13,102,252 | 21,589,156 | 5,595,327 | 8,510,086 | 205.91 | 157.12 | 4,403 | 21.6% |
2022 | N/A | N/A | 12,101,639 | 20,596,816 | 4,658,436 | 7,460,450 | 174.05 | 141.79 | 1,436 | 14.8% |
2021 | N/A | N/A | 9,336,013 | 16,348,981 | 5,557,283 | 7,443,067 | 123.23 | 119.28 | 2,093 | 11.5% |
(1)Represents compensation reported in the Summary Compensation
Table (“SCT”) for our CEO, Mr. Papadopoulo, who was appointed
(2)The dollar amounts reported represent the amount of CAP,
computed as required by Item 402(v) of Regulation S-K. The
computations do not reflect the actual amount of compensation
earned by or paid to Mr. Papadopoulo and Mr. Grandisson during
due to a calculation correction incorporating the 2024 Special
Dividend.
(3)Represents compensation reported in the SCT for our former CEO,
Mr. Grandisson, who retired from the Company effective October
15, 2024.
(4)The dollar amounts reported represent the average compensation
of Non-PEO NEOs as a group as reported in the “Total” column of
the SCT. For 2021 to 2023, this includes Messrs. Morin,
Papadopoulo, Rajeh and Gansberg. For 2024 to 2025, this includes
Messrs. Morin, Rajeh and Gansberg and Ms. Todd. Refer to
(5)The dollar amounts reported represent the average amount of CAP
to the Company’s Non-PEO NEOs as a group, computed as required
by Item 402(v) of Regulation S-K. The computations do not reflect
the actual average amount of compensation earned by or paid to
the Non-PEO NEOs as a group during the applicable year. Refer to
table below. The 2024 CAP was restated downward due to a
calculation correction incorporating the 2024 Special Dividend.
(6)Represents the Company’s cumulative TSR assuming reinvestment
of dividends for the measurement period beginning at market close
on December 31, 2020, through the end of the applicable year.
(7)Represents the cumulative TSR assuming reinvestment of dividends
of the S&P 500 P&C Index for the measurement period beginning at
the market close on December 31, 2020, through the end of the
applicable year.
(8)The dollar amounts reported represent the amount of Net Income
reflected in the Company’s audited financial statements for the
applicable year.
GAAP Financial Measures” for the applicable year.
Papadopoulo, Rajeh and Gansberg. For 2024 to 2025, this includes
Messrs. Morin, Rajeh and Gansberg and Ms. Todd.
of the S&P 500 P&C Index for the measurement period beginning at
the market close on December 31, 2020, through the end of the
applicable year.
Year | Reported SCT for PEO | Reported Value of Equity Awards (a) | Equity Award Adjustments (b) | Reported Change in the Actuarial Present Value of Pension Benefits (c) | Pension Benefit Adjustments (c) | CAP to PEO | |
Mr. Papadopoulo | 2025 | 14,626,320 | (7,340,692) | 20,188,815 | — | — | 27,474,443 |
(a)The reported value of equity awards represents the total of the
amounts reported in the “Stock Awards” and “Option Awards”
columns in the Summary Compensation Table for the applicable
year.
(b)Refer to the “PEO Equity Award Adjustments” table below.
(c)Arch does not provide Pension Benefits to its PEO.
Year | Average Reported SCT for Non-PEO NEOs | Average Reported Value of Equity Awards (a) | Average Equity Award Adjustments (b) | Average Reported Change in the Actuarial Present Value of Pension Benefits (c) | Average Pension Benefit Adjustments (c) | Average CAP to Non-PEO NEOs |
2025 | 6,839,789 | (2,721,478) | 9,526,909 | — | — | 13,645,220 |
(a)The average reported value of equity awards represents the
average of total of the amounts reported in the “Stock Awards” and
“Option Awards” columns in the Summary Compensation Table for
the applicable year.
(b)Refer to the “Average of Non-PEO NEO Equity Award Adjustments”
table below.
(c)Arch does not provide Pension Benefits to its Non-PEO NEOs.
Year | Year-End Fair Value of Outstanding and Unvested Equity Awards Granted in the Year (a) | Year over Year Change in Fair Value of Outstanding and Unvested Equity Awards Granted in Prior Years (a) | Fair Value as of Vesting Date of Equity Awards Granted and Vested in the Year | Year over Year Change in Fair Value of Equity Awards Granted in Prior Years and Vested in the Year (a) | Fair Value at the End of the Prior Year of Equity Awards that Failed to Meet Vesting Conditions in the Year | Value of Dividends or other Earnings Paid on Stock or Option Awards not Otherwise Reflected in Fair Value or Total Compensation | Total Equity Award Adjustments | |
Mr. Papadopoulo | 2025 | 7,323,239 | 12,996,905 | — | (131,329) | — | — | 20,188,815 |
(a)The valuation assumptions differ from those disclosed as of the
grant date of equity awards due to the fluctuation in the stock price
and the corresponding Black-Scholes and Monte Carlo value
simulations valued as of the corresponding dates in accordance
with Item 402(v) of Regulation S-K. In calculating the Black-Scholes
value of the option awards, the expected life input, based on the
original expected life established at grant date, as used for financial
reporting purposes, was adjusted downward in proportion to the
degree to which the options were in-the-money relative to their
exercise price and upward in proportion to the degree to which the
options were out-of-the-money relative to their exercise price, as
applicable. The reported year-end fair value of outstanding and
unvested equity awards reflects the adjustments and amounts
attributable to the Special Dividend, as applicable.
Average of Non-PEO NEO Equity Award Adjustments:Year | Average Year-End Fair Value of Outstanding and Unvested Equity Awards Granted in the Year (a) | Year over Year Average Change in Fair Value of Outstanding and Unvested Equity Awards Granted in Prior Years (a) | Average Fair Value as of Vesting Date of Equity Awards Granted and Vested in the Year | Year over Year Average Change in Fair Value of Equity Awards Granted in Prior Years and Vested in the Year (a) | Average Fair Value at the End of the Prior Year of Equity Awards that Failed to Meet Vesting Conditions in the Year | Average Value of Dividends or other Earnings Paid on Stock or Option Awards not Otherwise Reflected in Fair Value or Total Compensation | Total Average Equity Award Adjustments |
2025 | 2,715,005 | 6,878,410 | — | (66,507) | — | — | 9,526,909 |
(a)The average valuation assumptions differ from those disclosed as of
the grant date of equity awards due to the fluctuation in the stock
price and the corresponding Black-Scholes and Monte Carlo value
simulations valued as of the corresponding dates in accordance
with Item 402(v) of Regulation S-K. In calculating the Black-Scholes
value of the option awards, the expected life input, based on the
original expected life established at grant date, as used for financial
reporting purposes, was adjusted downward in proportion to the
degree to which the options were in-the-money relative to their
exercise price and upward in proportion to the degree to which the
options were out-of-the-money relative to their exercise price, as
applicable. The reported average year-end fair value of outstanding
and unvested equity awards reflects the adjustments and amounts
attributable to the Special Dividend, as applicable.
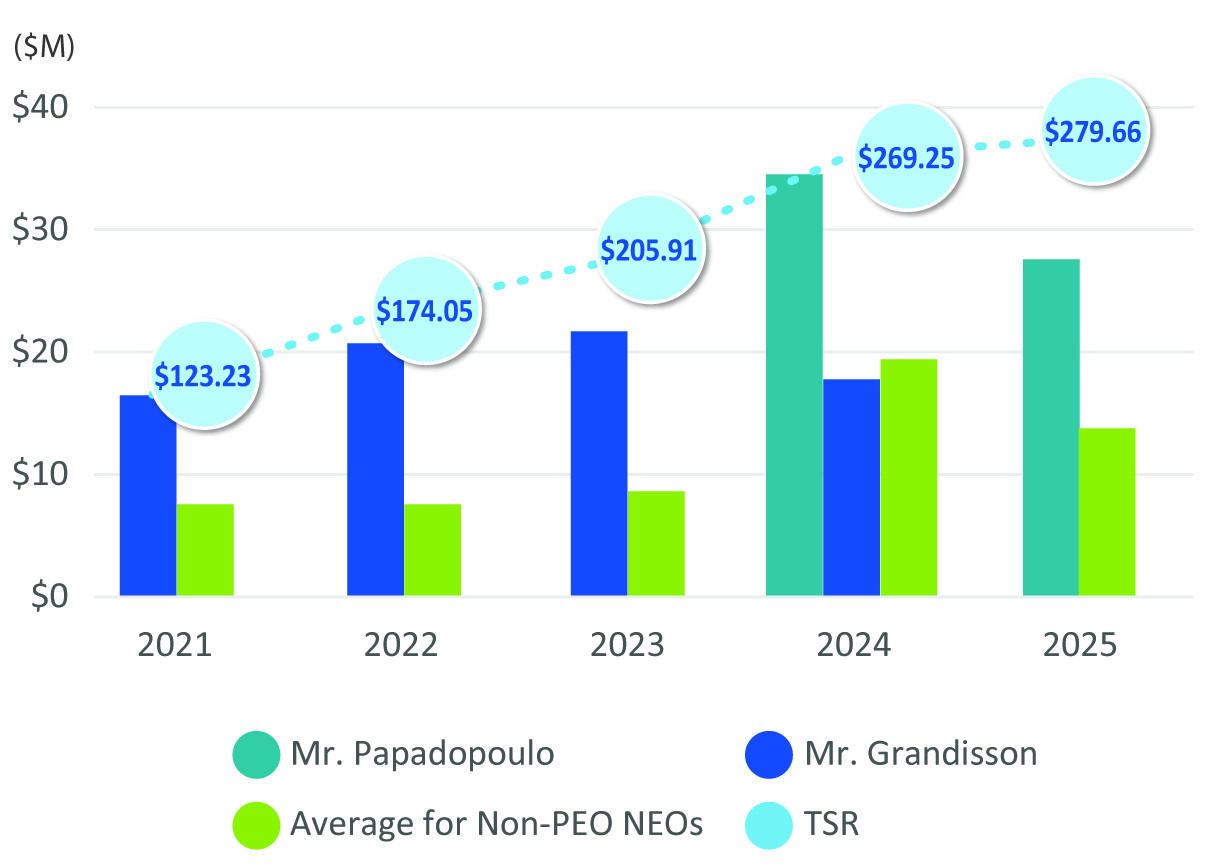
As demonstrated by the following graph, the amount of
CAP to Mr. Papadopoulo in 2025, Messrs. Papadopoulo
and Grandisson in 2024 and Mr. Grandisson in prior years
and the average amount of CAP to the Company’s NEOs as
a group (excluding the CEO(s)) for the applicable years,
strongly aligns with the Company’s cumulative TSR over
the five years presented in the table. The alignment is
because a significant portion of the CAP to Mr.
Papadopoulo in 2025, Messrs. Papadopoulo and
Grandisson in 2024 and Mr. Grandisson in prior years and
to the other NEOs is comprised of equity awards. As
described in more detail in the section “Compensation—
targets that approximately 68% of the value of total
compensation awarded for Mr. Papadopoulo and 54% of
the value awarded for the other NEOs be comprised of
equity awards, including restricted shares, performance-
based restricted shares and stock options.
CAP vs. Cumulative TSR |
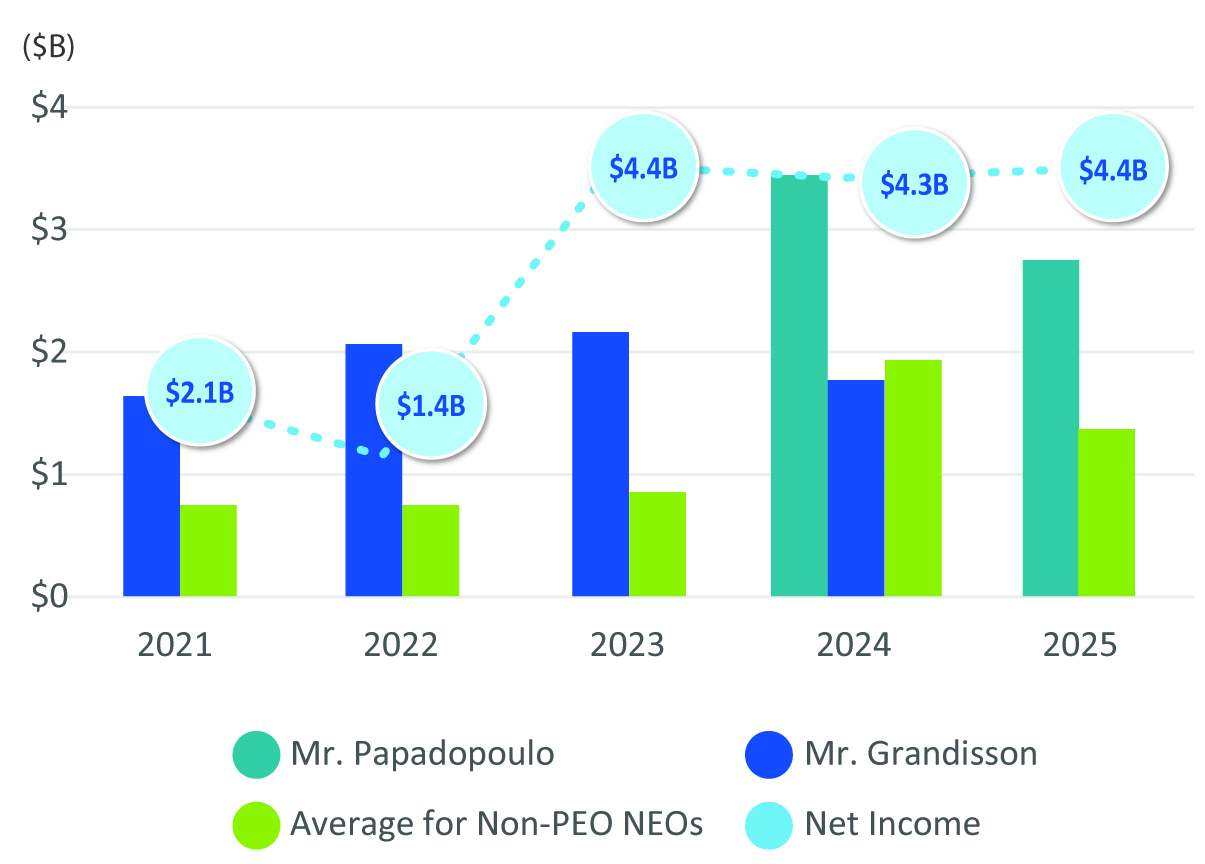
As demonstrated by the following graph, the amount of
CAP to Mr. Papadopoulo in 2025, Messrs. Papadopoulo
and Grandisson in 2024 and Mr. Grandisson in prior years
and the average amount of CAP to the Company’s other
NEOs as a group is generally aligned with the Company’s
Net Income for 2021 through 2025. Although Net Income
can vary from year to year due to the inherent volatility in
our business, CAP increased largely due to the fact that a
significant portion of compensation paid to Messrs.
Papadopoulo and Grandisson and to the Company’s NEOs
as a group (excluding the CEO(s) for the applicable year) is
comprised of equity awards, with TSR increasing by
179.7% over the five-year period. In 2025, CAP decreased
for Mr. Papadopoulo and the Average for Non-PEO NEOs
due to a decrease in equity awarded from 2024 associated
with the one-time outperformance award granted for the
CEO leadership transition. In 2022, the decrease in Net
Income was driven by significant volatility in the capital
markets and elevated catastrophic activity while Net
Income in 2023 benefited from a lower level of
catastrophe loss activity and the one-time impact of the
implementation of a Corporate Income Tax regime in
Bermuda. The Company does not utilize Net Income as a
performance measure in the overall executive
compensation program.
CAP vs. Net Income |
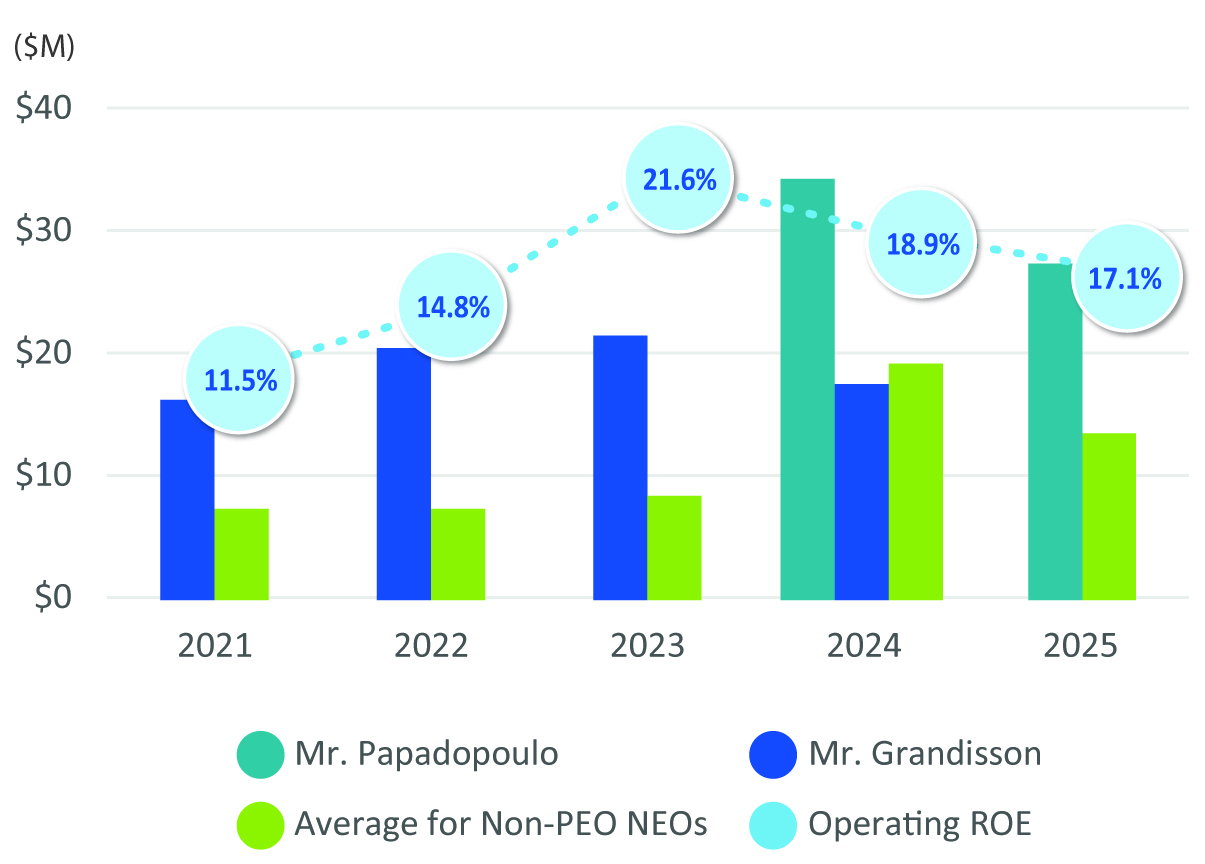
As demonstrated by the following graph, the amount of
CAP to Mr. Papadopoulo in 2025, Messrs. Papadopoulo
and Grandisson in 2024, and Mr. Grandisson in prior
years, and the average amount of CAP to the Company’s
other NEOs as a group is generally aligned with the
Company’s growth in Operating ROE for the five years
presented in the table. CAP increased largely due to the
fact that a significant portion of compensation paid to Mr.
Papadopoulo in 2025, Messrs. Papadopoulo and
Grandisson in 2024 and Mr. Grandisson in prior years and
to the other NEOs as a group is comprised of equity
awards, with TSR increasing by 3.87% for the year. Returns
for 2025 reflected strong underwriting and investment
performance. The slightly lower 2025 Operating ROE was
primarily due to growth in shareholders’ equity from 2024
to 2025, while 2024 Operating ROE benefited from the
Special Dividend issued in December 2024.
While the Company uses numerous financial and non-
financial performance measures for the purpose of
evaluating performance for the Company’s compensation
programs, the Company has determined that Operating
ROE is the financial performance measure that, in the
Company’s assessment, represents the most important
performance measure (that is not otherwise required to
be disclosed in the table) used by the Company to link CAP
to the Company’s NEOs, for the most recently completed
year, to Company performance. The Company utilizes
Operating ROE when setting goals in the Company’s short-
term incentive compensation programs. Additionally,
growth in Operating ROE is reflected in TBVPS, which is
utilized in setting goals for the performance-based
restricted shares that are awarded to the Company’s
NEOs.
CAP vs. Operating ROE |
Group
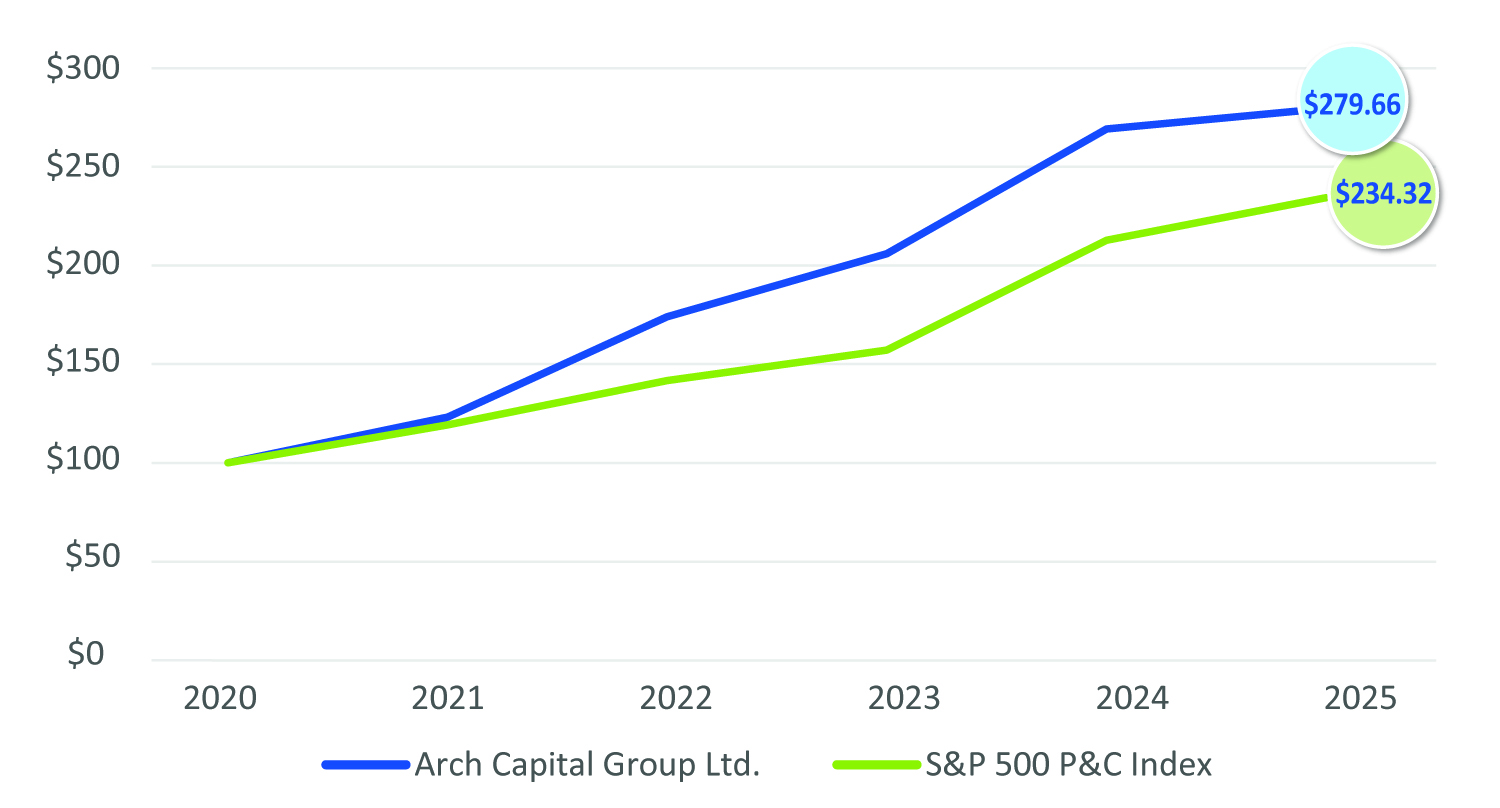
As demonstrated by the following graph, the Company’s
cumulative TSR over the five-year period presented in the
table was approximately 179.7%, while the cumulative
TSR of the peer group presented for this purpose, the S&P
500 P&C Index, was approximately 134.3% over the five
years presented in the table. For more information
regarding the Company’s performance and the companies
that the Compensation and Human Capital Committee
considers when determining compensation, refer to
Total Shareholder Return |
CAP
The three items listed below represent the most
important metrics used to link CAP for our NEOs for 2025
to the Company’s performance, as further described in
■Operating ROE.
■Growth in TBVPS.
■Relative TSR (the Company’s TSR as compared to a
performance peer group established by the
Compensation and Human Capital Committee).
GAAP Financial Measures” for the applicable year.