Exhibit 99.1
1 G.Willi-Food International Ltd. Innovation, Quality and Growth Capital Market
Presentation Year 2025
| Capital Market Presentation | Year 2025 P. 2 Disclaimer and
Forward-Looking Information This presentation is for informational purposes only and does not constitute an offer or an invitation to allot or to purchase the Company's securities or to accept such offers, nor does it constitute advice,
recommendations or express an opinion on the feasibility of investing in the Company's securities. The information provided herein does not supersede any independent review of an investor in accordance with her/his circumstances and
discretion. The data and information presented in this presentation are for summary purposes only and do not replace the need to review the company’s full public reports, including its periodic and quarterly financial statements. This
presentation may contain data or information presented differently from the way it appears in the reports published by the company to the public. In the event of any inconsistency between the summarized and general information in this
presentation and the detailed information in the company’s reports, the information in the company’s reports shall prevail. This presentation includes forward looking information (as defined in the Securities Law, 1968 and within the meaning
of the U.S. Private Securities Litigation Reform Act of 1995) that involve substantial risks and uncertainties and which includes, among other things, forecasts, assessments, estimates and other information relating to future events and or
matters, the realization of which is uncertain (as well as how they materialize) and is not under the control of the Company. All statements contained in this presentation other than statements of historical facts are forward looking
information and includes, inter alia, forecasts, targets, estimates, estimates and other information, based (inter alia and as appropriate) on the Company's management estimates (as of the date of publication of this presentation) and
statistical and public data and publications by external bodies and whose contents have not been checked by the Company and for which the Company is not responsible for their correctness. Further, certain forward-looking statements are based
on assumptions as to future events that may not prove to be accurate. The future events and trends may not occur and actual results, in whole or in part, may be realized differently than expected (and even substantially different) as a result
of, among other things, the realization of the risk factors that characterize the company and its activities and as a result of other external developments beyond the Company's control, including delays in the construction of the Company’s new
logistics center and the risk that its expected benefits will not materialize and inability to sustain improvements and growth in the future. The Company has no certainty that its expectations and assessments will indeed be realized, and the
results of the Company's operations may differ materially from the results estimated or implied by the foregoing, among others due to a change in any of the above-mentioned factors. More information about the risks and uncertainties affecting
the Company is contained under the heading "Risk Factors" in the Annual Report on Form 20-F filed with the Securities and Exchange Commission on March 17, 2025. The Company does not undertake to update the information set forth in this
presentation to reflect events and/or developments that will occur after its publication.
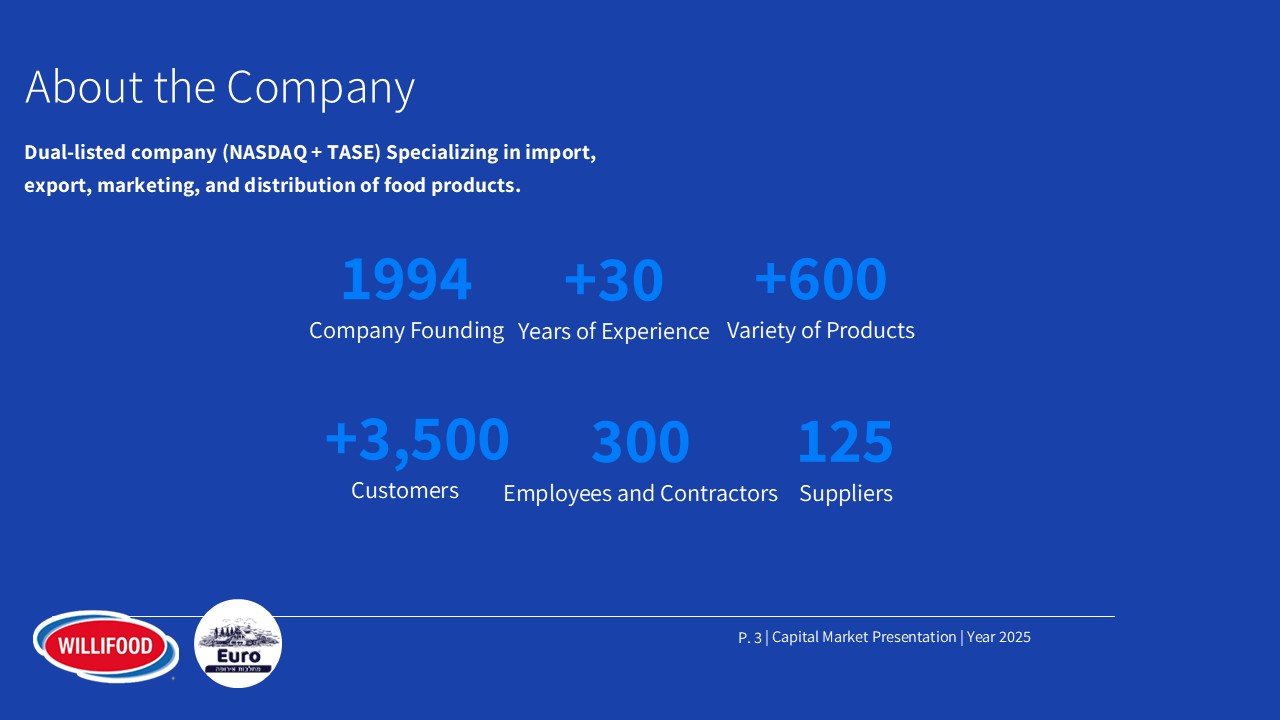
About the Company Dual-listed company (NASDAQ + TASE) Specializing in import,
export, marketing, and distribution of food products. 1994 Company Founding 30+ Years of Experience 600+ Variety of Products 3,500+ Customers 300 Employees and Contractors 125 Suppliers | Capital Market Presentation | Year 2025
P. 3
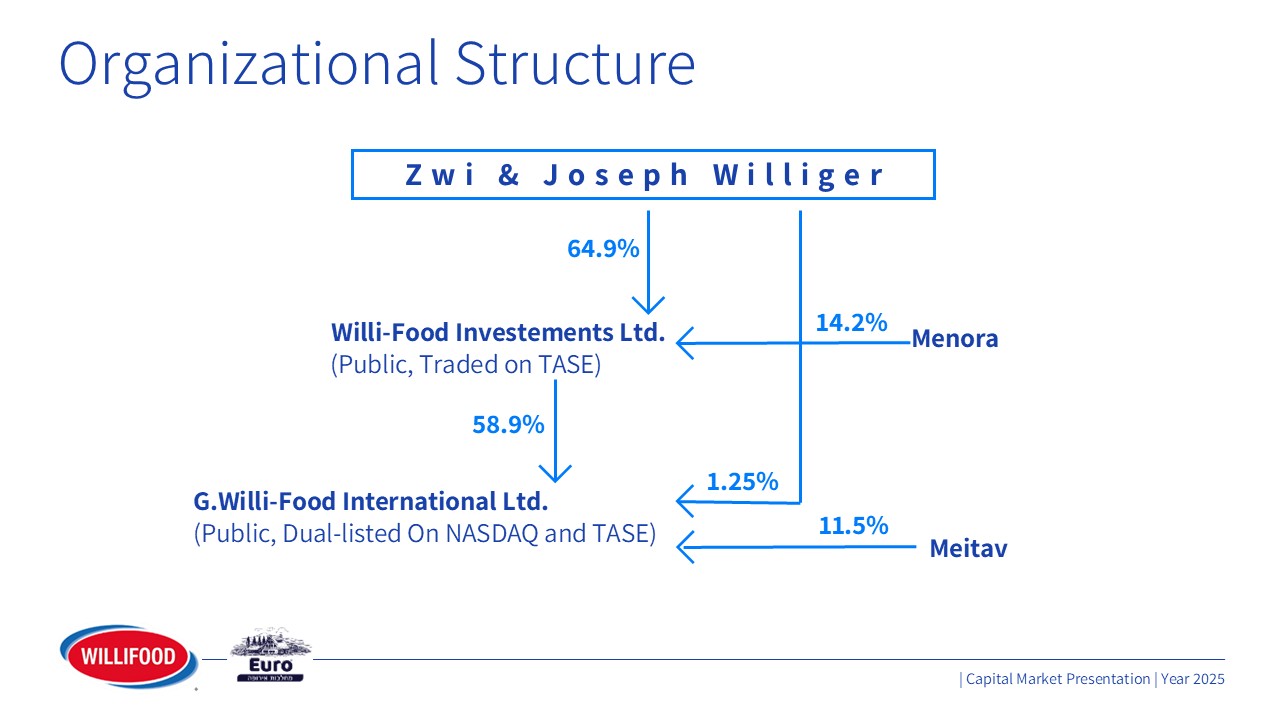
Organizational Structure 64.9% Willi-Food Investements Ltd. (Public, Traded on
TASE) 58.9% G.Willi-Food International Ltd. (Public, Dual-listed On NASDAQ and TASE) 1.25% Menora 14.2% Zwi & Joseph Williger Meitav 11.5% Year 2025| Capital Market Presentation |
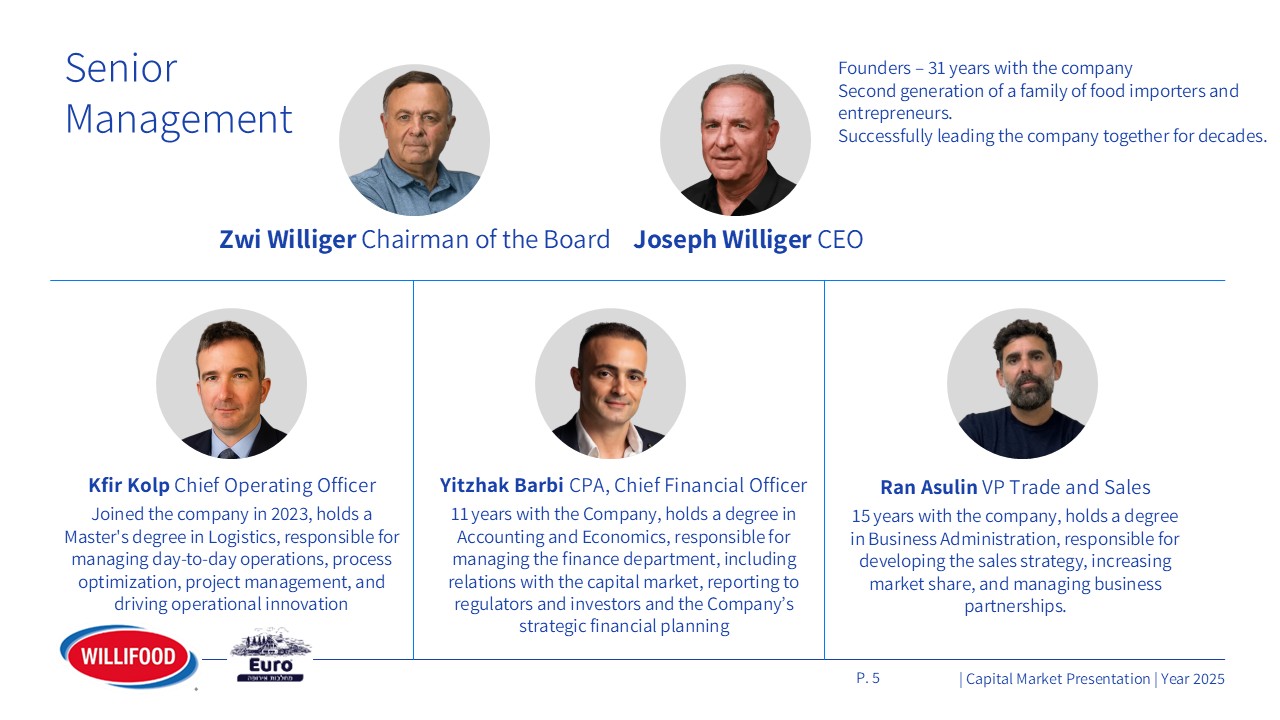
Year 2025| Capital Market Presentation | P. 5 Senior Management Zwi Williger
Chairman of the Board Joseph Williger CEO Founders – 31 years with the company Second generation of a family of food importers and entrepreneurs.Successfully leading the company together for decades. Kfir Kolp Chief Operating Officer Joined
the company in 2023, holds a Master's degree in Logistics, responsible for managing day-to-day operations, process optimization, project management, and driving operational innovation Yitzhak Barbi CPA, Chief Financial Officer 11 years with
the Company, holds a degree in Accounting and Economics, responsible for managing the finance department, including relations with the capital market, reporting to regulators and investors and the Company’s strategic financial planning Ran
Asulin VP Trade and Sales 15 years with the company, holds a degree in Business Administration, responsible for developing the sales strategy, increasing market share, and managing business partnerships.
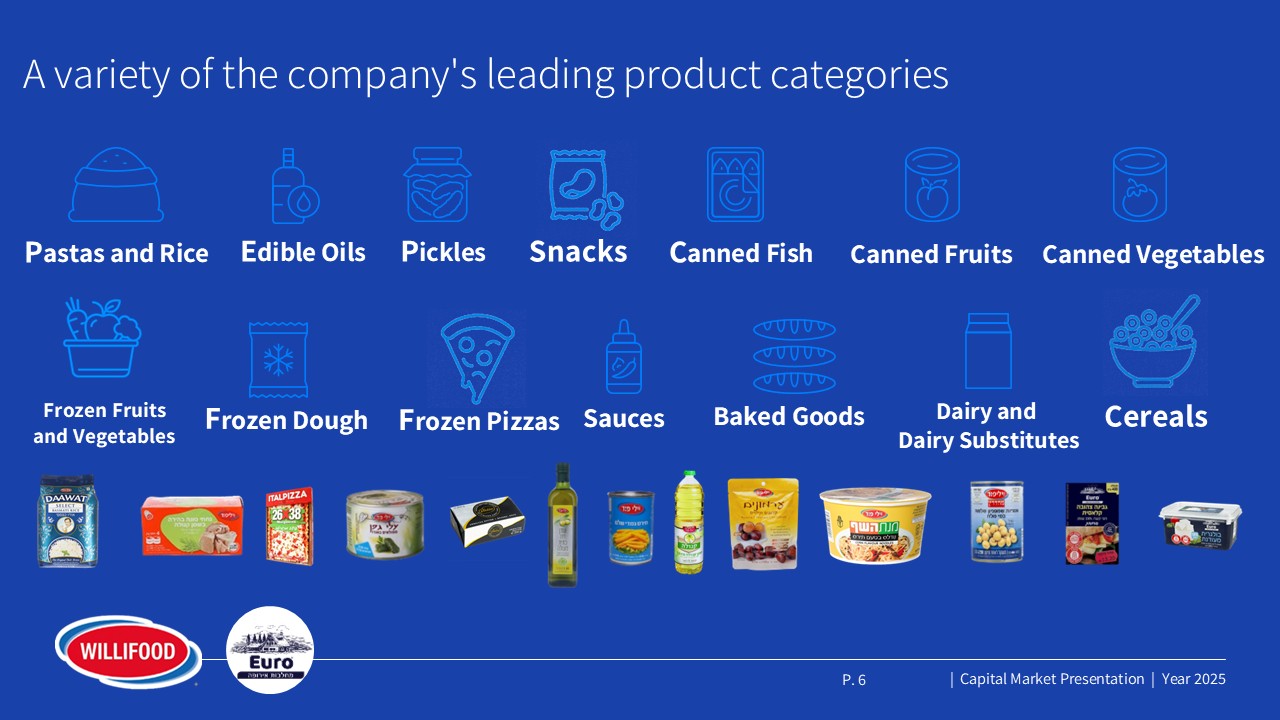
A variety of the company's leading product categories Canned Vegetables Canned
Fruits Canned Fish Snacks Pickles Edible Oils Pastas and Rice Cereals Dairy and Dairy Substitutes Baked Goods Sauces Frozen Pizzas Frozen Dough Frozen Fruits and Vegetables Year 2025 | Capital Market Presentation | P. 6
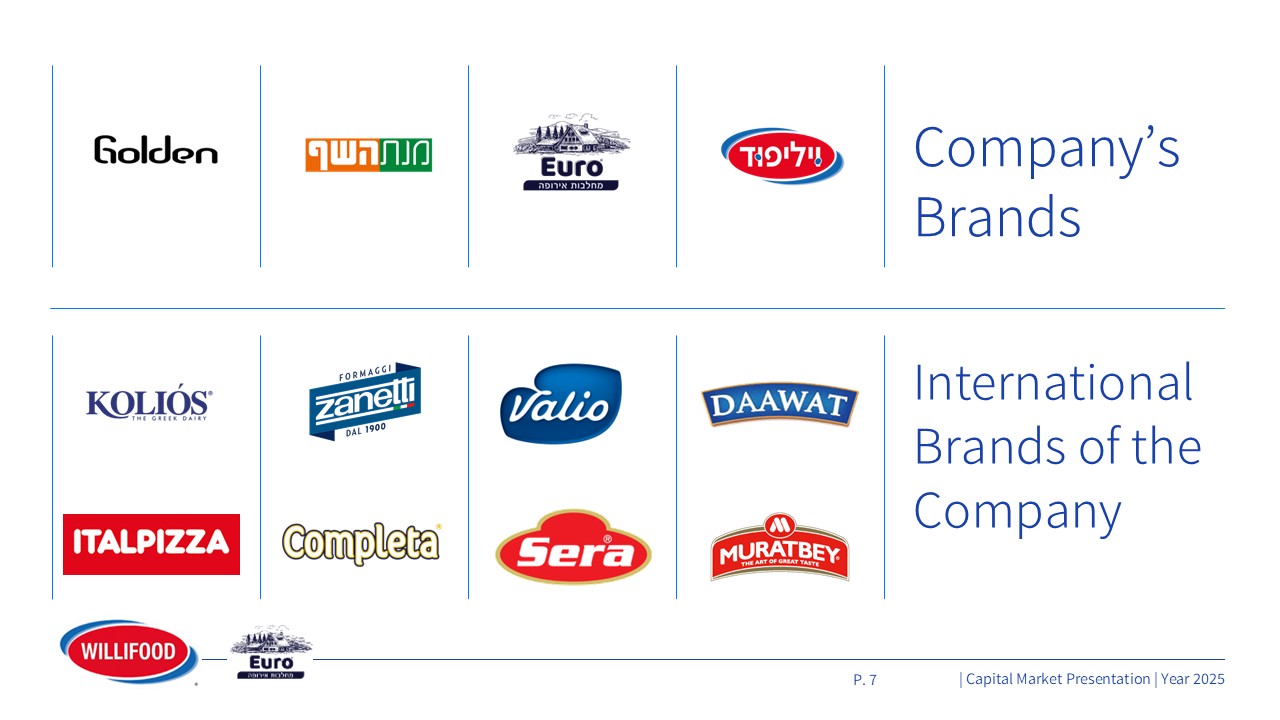
Year 2025| Capital Market Presentation | P. 7 Company’s Brands International
Brands of the Company
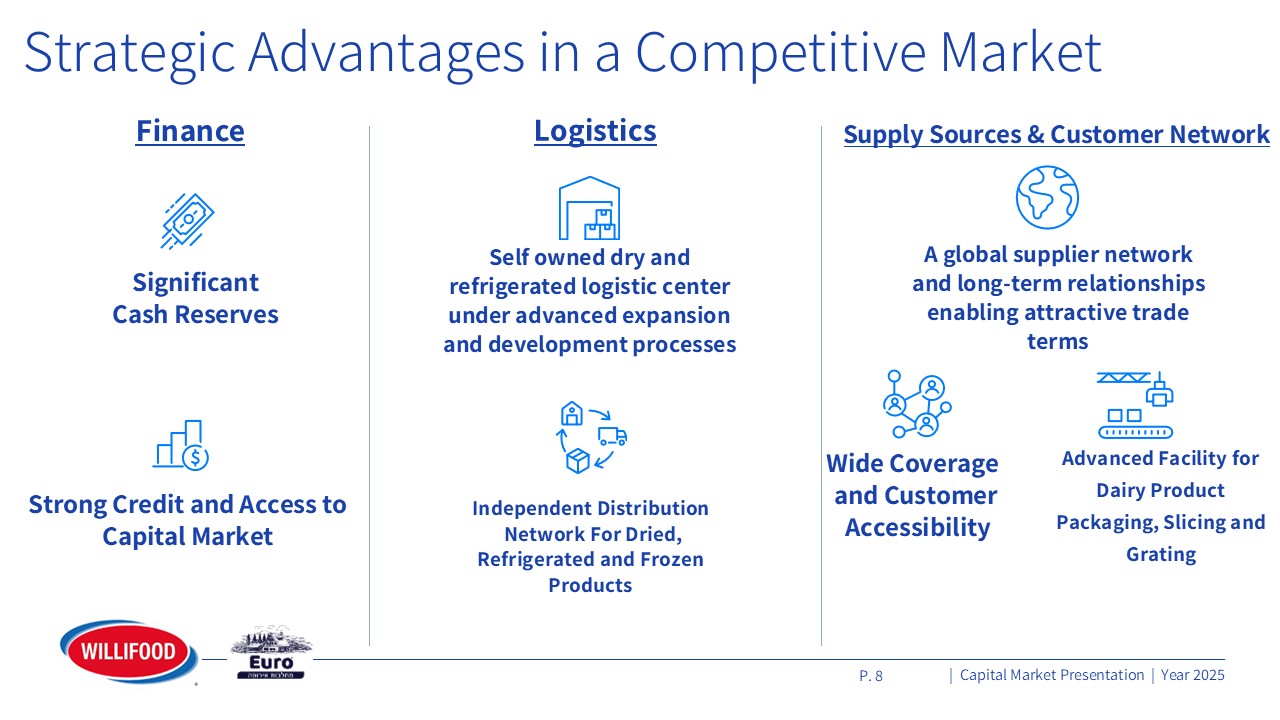
P. 8 Strategic Advantages in a Competitive Market Self owned dry and
refrigerated logistic center under advanced expansion and development processes A global supplier network and long-term relationships enabling attractive trade terms Independent Distribution Network For Dried, Refrigerated and Frozen
Products Wide Coverage and Customer Accessibility Logistics Supply Sources & Customer Network Advanced Facility for Dairy Product Packaging, Slicing and Grating Strong Credit and Access to Capital Market Significant Cash
Reserves Finance Year 2025 | Capital Market Presentation |
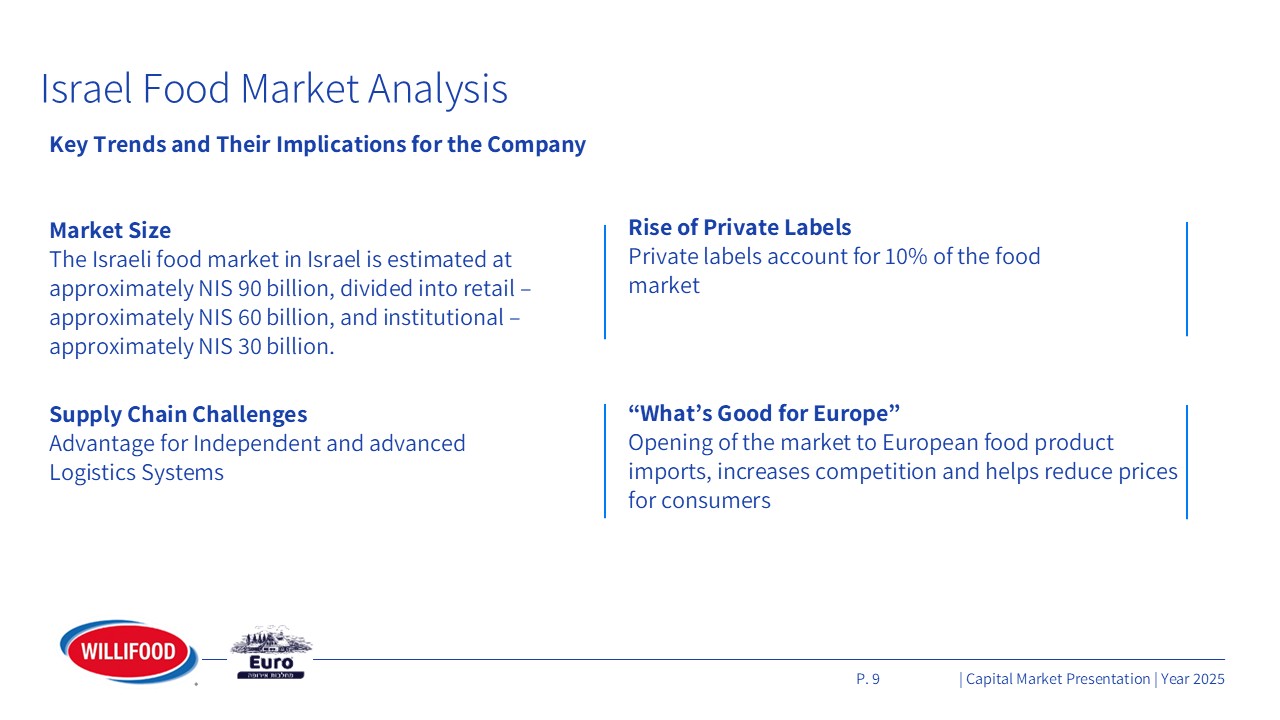
Year 2025 | Capital Market Presentation | P. 9 Israel Food Market Analysis Key
Trends and Their Implications for the Company Market Size The Israeli food market in Israel is estimated at approximately NIS 90 billion, divided into retail – approximately NIS 60 billion, and institutional – approximately NIS 30
billion. Supply Chain Challenges Advantage for Independent and advanced Logistics Systems Rise of Private Labels Private labels account for 10% of the food market “What’s Good for Europe” Opening of the market to European food product
imports, increases competition and helps reduce prices for consumers
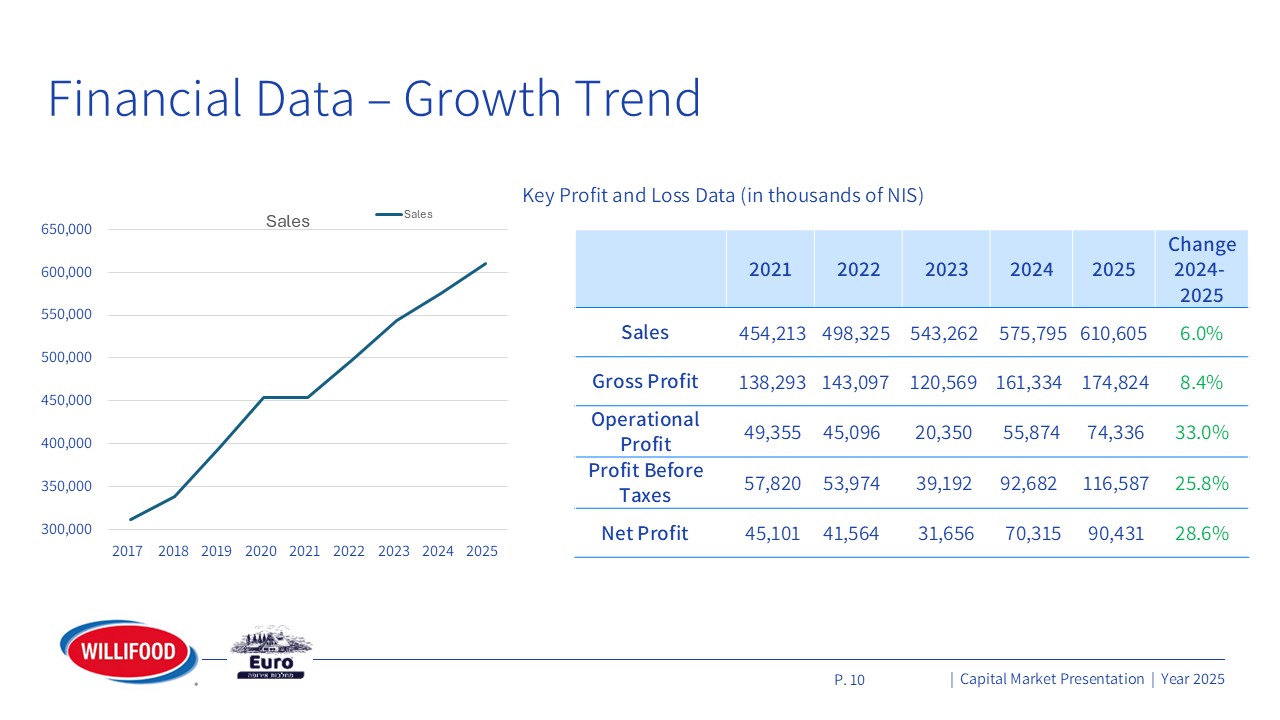
Year 2025 | Capital Market Presentation | P. 10 Financial Data – Growth
Trend Key Profit and Loss Data (in thousands of NIS) Change 2024-2025 2025 2024 2023 2022 2021 6.0% 610,605 575,795 543,262 498,325 454,213 Sales 8.4% 174,824 161,334 120,569 143,097 138,293 Gross
Profit 33.0% 74,336 55,874 20,350 45,096 49,355 Operational Profit 25.8% 116,587 92,682 39,192 53,974 57,820 Profit Before Taxes 28.6% 90,431 70,315 31,656 41,564 45,101 Net Profit
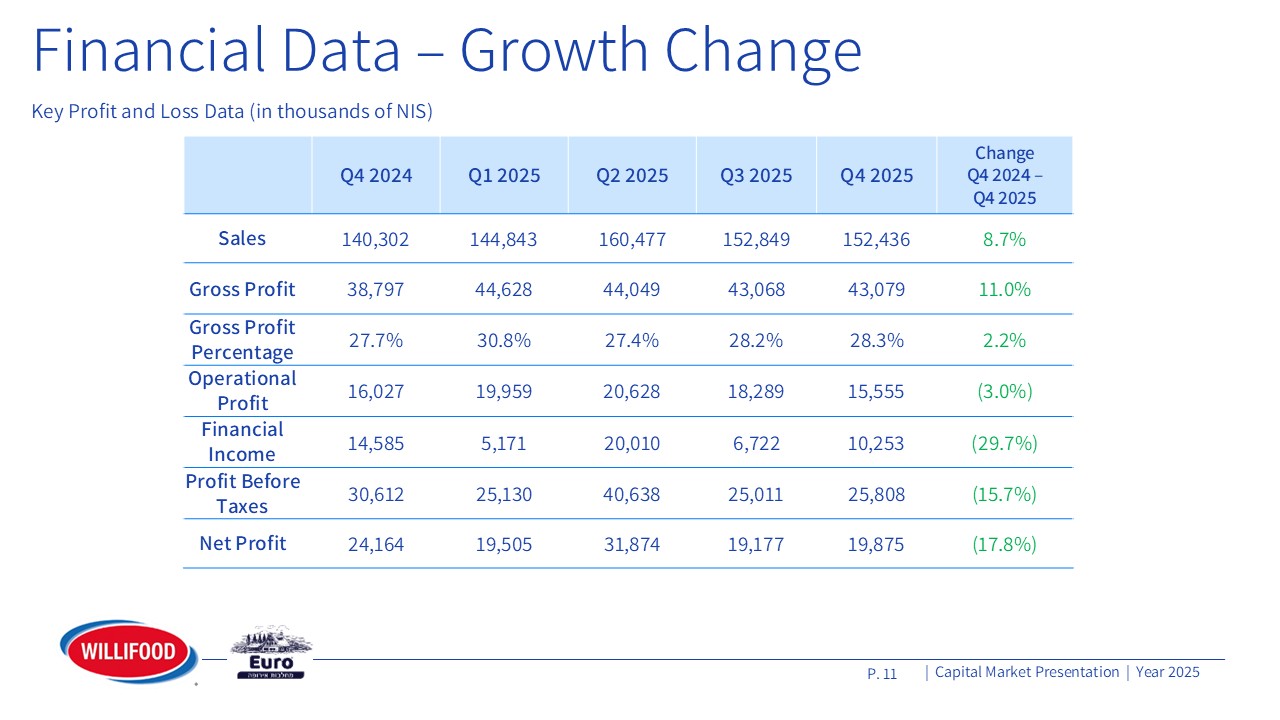
P. 11 Financial Data – Growth Change Key Profit and Loss Data (in thousands of
NIS) Change Q4 2024 – Q4 2025 Q4 2025 Q3 2025 Q2 2025 Q1 2025 Q4 2024 8.7% 152,436 152,849 160,477 144,843 140,302 Sales 11.0% 43,079 43,068 44,049 44,628 38,797 Gross
Profit 2.2% 28.3% 28.2% 27.4% 30.8% 27.7% Gross Profit Percentage (3.0%) 15,555 18,289 20,628 19,959 16,027 Operational Profit (29.7%) 10,253 6,722 20,010 5,171 14,585 Financial
Income (15.7%) 25,808 25,011 40,638 25,130 30,612 Profit Before Taxes (17.8%) 19,875 19,177 31,874 19,505 24,164 Net Profit Year 2025 | Capital Market Presentation |
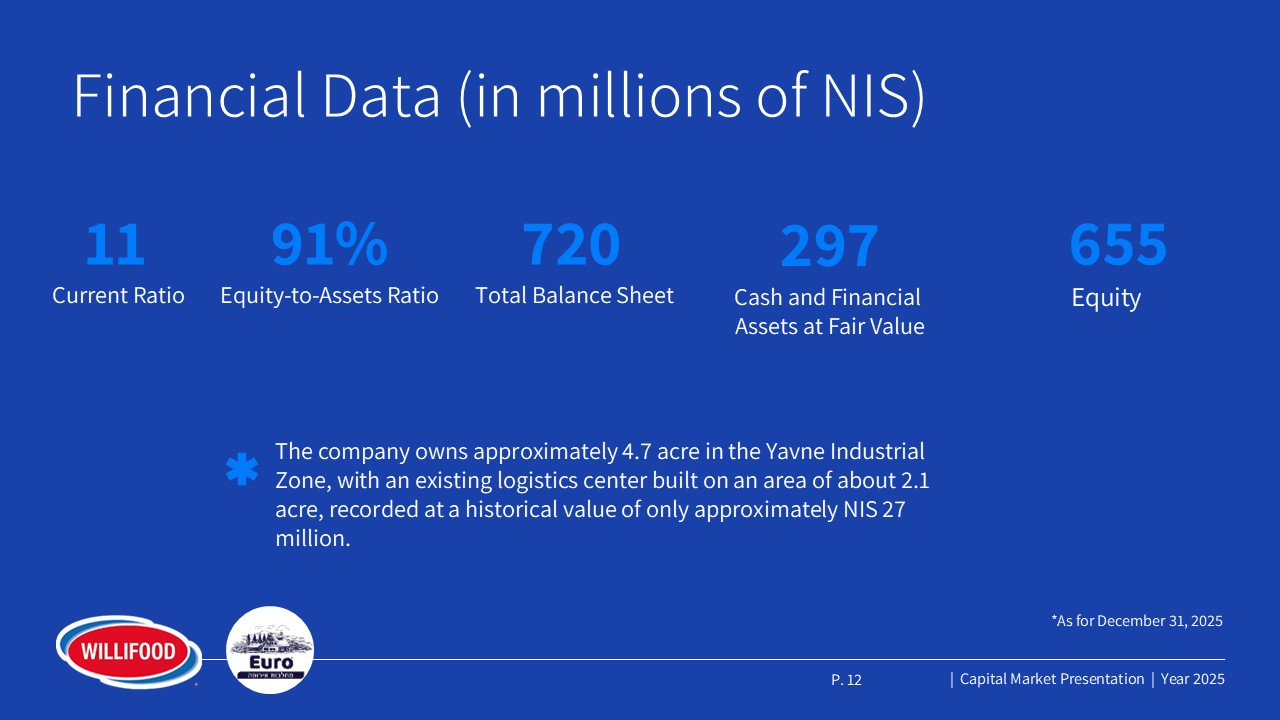
Year 2025 | Capital Market Presentation | P. 12 Financial Data (in millions of
NIS) 11 Current Ratio 91% Equity-to-Assets Ratio 720 Total Balance Sheet 297 Cash and Financial Assets at Fair Value 655 Equity The company owns approximately 4.7 acre in the Yavne Industrial Zone, with an existing logistics
center built on an area of about 2.1 acre, recorded at a historical value of only approximately NIS 27 million. *As for December 31, 2025
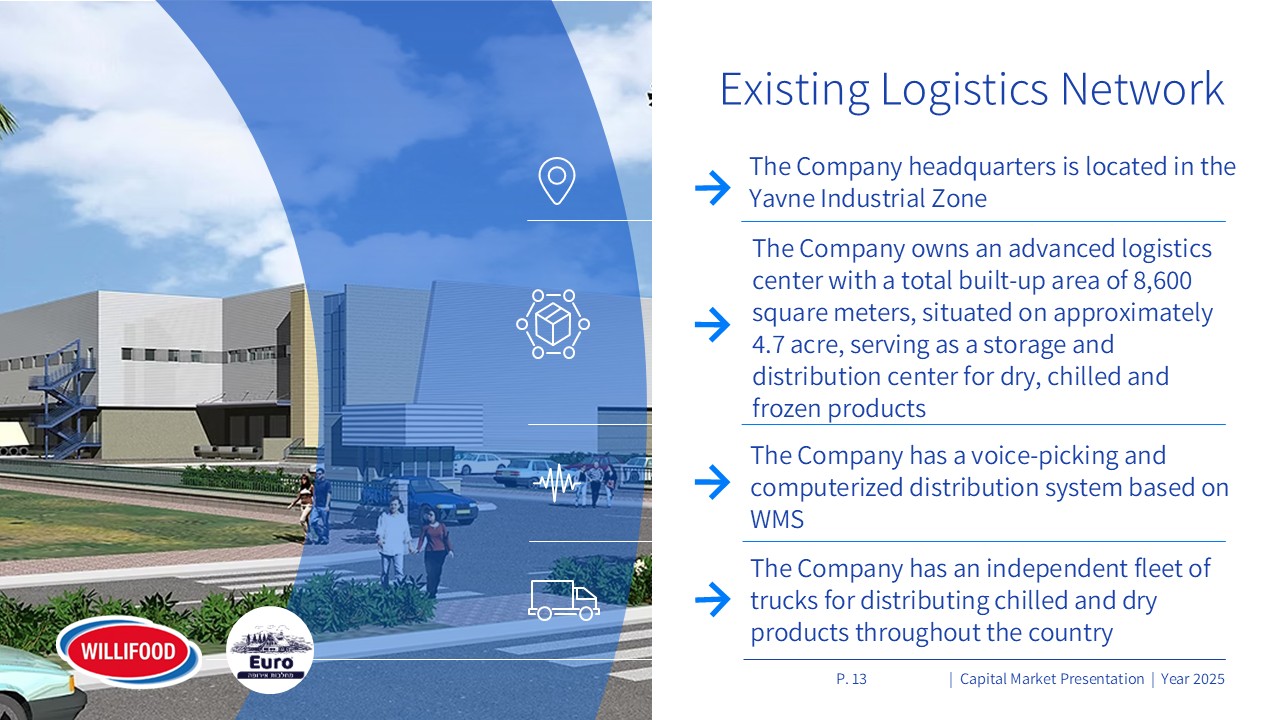
Year 2025 | Capital Market Presentation | P. 13 Existing Logistics Network The
Company headquarters is located in the Yavne Industrial Zone The Company owns an advanced logistics center with a total built-up area of 8,600 square meters, situated on approximately 4.7 acre, serving as a storage and distribution center for
dry, chilled and frozen products The Company has a voice-picking and computerized distribution system based on WMS The Company has an independent fleet of trucks for distributing chilled and dry products throughout the country
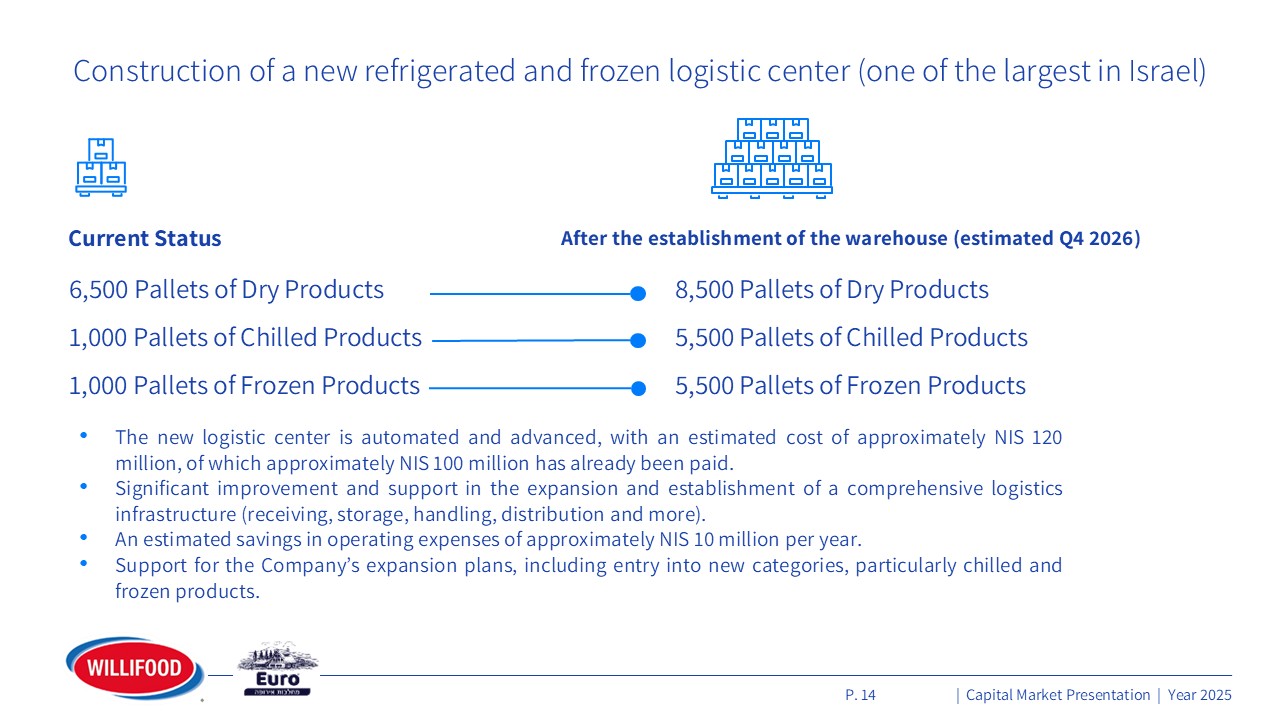
Year 2025 | Capital Market Presentation | P. 14 Construction of a new
refrigerated and frozen logistic center (one of the largest in Israel) Current Status 6,500 Pallets of Dry Products 1,000 Pallets of Chilled Products 1,000 Pallets of Frozen Products After the establishment of the warehouse (estimated Q4
2026) 8,500 Pallets of Dry Products 5,500 Pallets of Chilled Products 5,500 Pallets of Frozen Products The new logistic center is automated and advanced, with an estimated cost of approximately NIS 120 million, of which approximately NIS
100 million has already been paid. Significant improvement and support in the expansion and establishment of a comprehensive logistics infrastructure (receiving, storage, handling, distribution and more). An estimated savings in operating
expenses of approximately NIS 10 million per year. Support for the Company’s expansion plans, including entry into new categories, particularly chilled and frozen products.
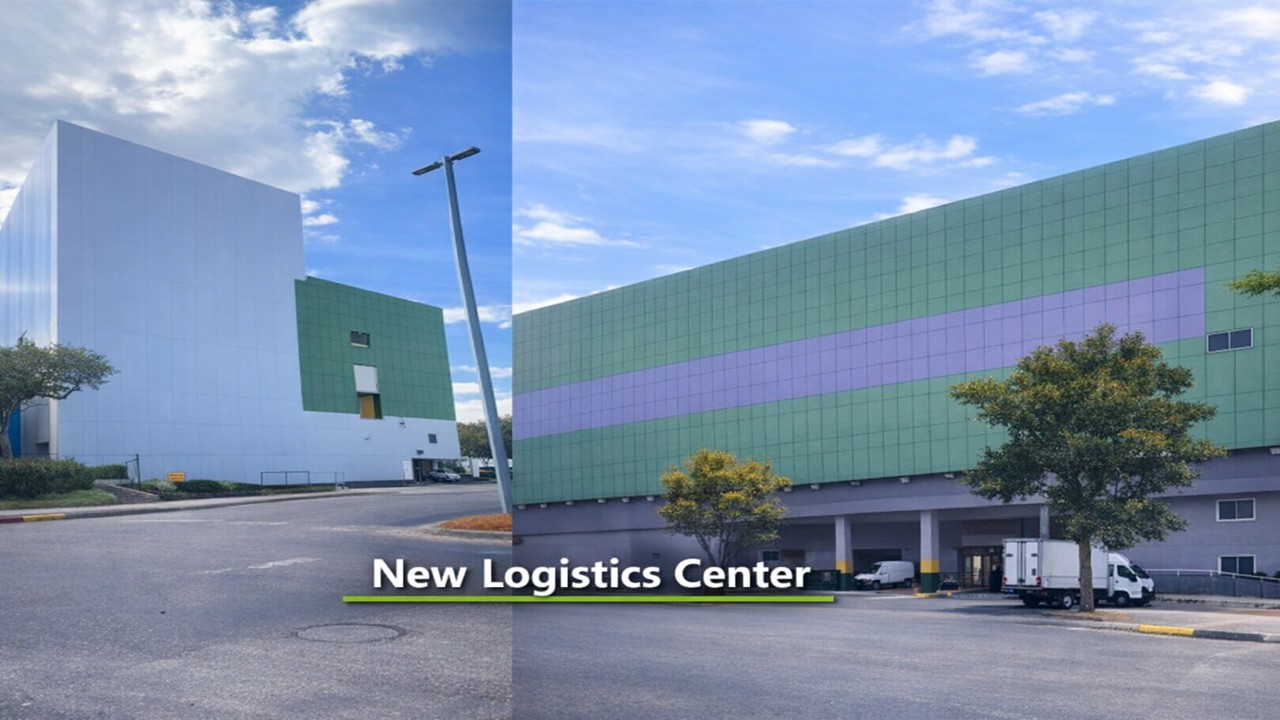
New Logistic Center
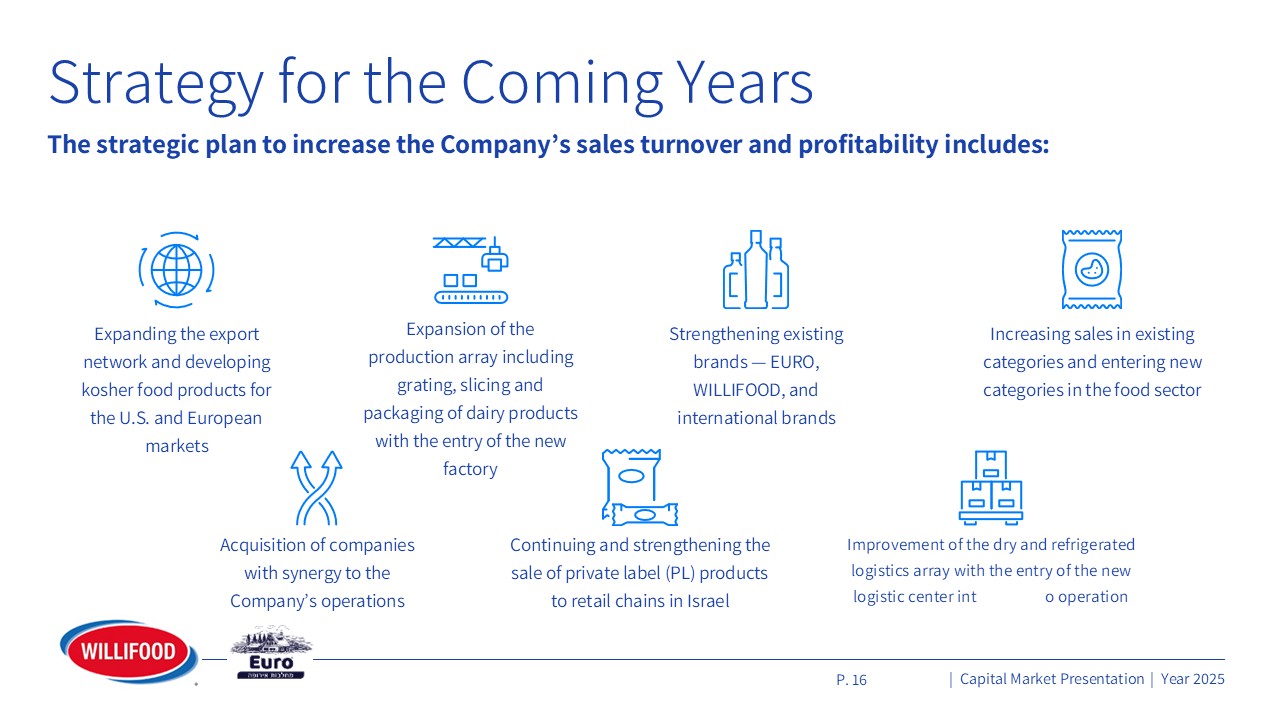
Year 2025 | Capital Market Presentation | P. 16 Strategy for the Coming
Years The strategic plan to increase the Company’s sales turnover and profitability includes: Expanding the export network and developing kosher food products for the U.S. and European markets Expansion of the production array including
grating, slicing and packaging of dairy products with the entry of the new factory Strengthening existing brands — EURO, WILLIFOOD, and international brands Increasing sales in existing categories and entering new categories in the food
sector Acquisition of companies with synergy to the Company’s operations Continuing and strengthening the sale of private label (PL) products to retail chains in Israel Improvement of the dry and refrigerated logistics array with the entry
of the new logistic center int o operation
Year 2025 | Capital Market Presentation | P. 17 Dividend Distribution
Policy Distribution of at least 40% of net profit Since 2021, the company has distributed NIS 237 million to its shareholders
G.Willi-Food International Ltd. Thank You