Pay vs Performance Disclosure - USD ($)
May 14, 2025
Dec. 31, 2025
Dec. 31, 2025
Dec. 31, 2024
Dec. 31, 2023
Dec. 31, 2022
Dec. 31, 2021
PAY VERSUS PERFORMANCE
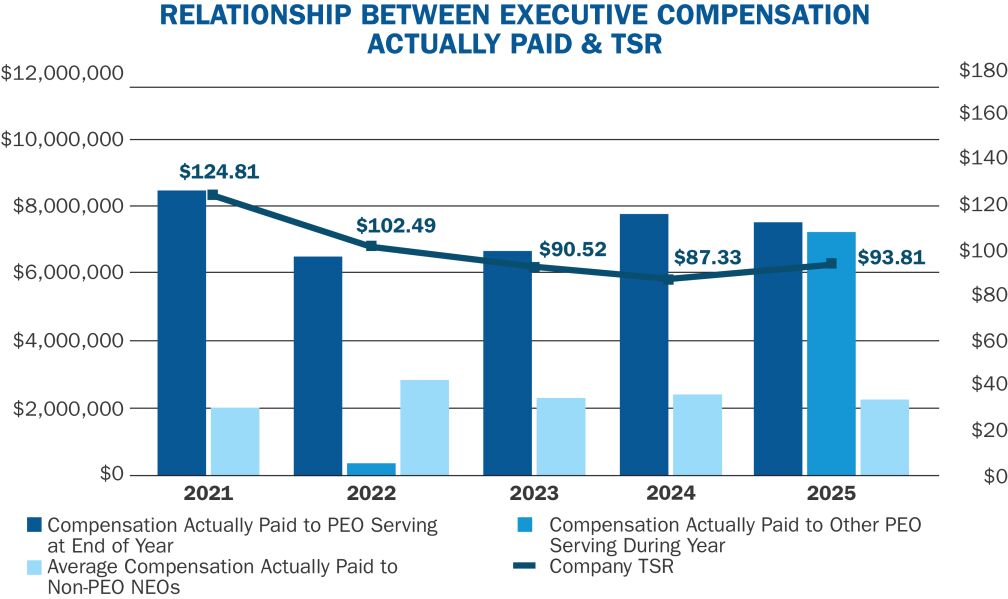
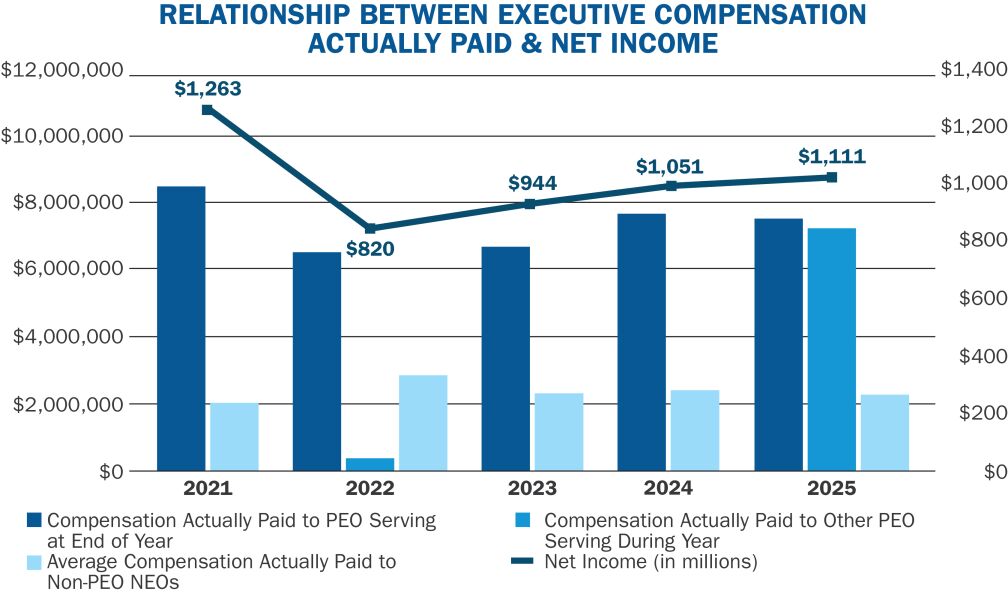
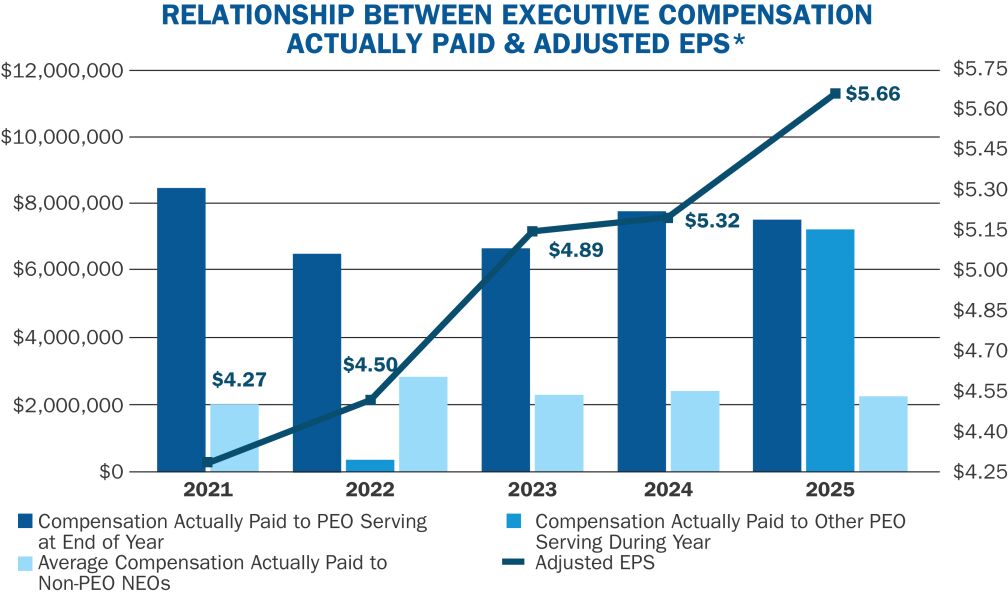
The following table provides information showing the relationship during 2025, 2024, 2023, 2022 and 2021 between (1) executive compensation “actually paid” (as defined by SEC rule) to (a) each person serving as our principal executive officer, or PEO, and (b) all of our other NEOs on an average basis, and (2) the Company’s financial performance
.
Value of Initial Fixed $100 |
||||||||||||||||||||||||||||||||||||||||||||||||||
Year |
Summary Compesation Table Total for PEO Serving at End of Year |
Compensation Actually Paid to PEO Serving at End of Year(1) |
Summary Compensation Table Total for Other PEO Serving During Year |
Compensation Actually Paid to Other PEO Serving During Year(1) |
Average Summary Compensation Table Total for Non-PEO NEOs |
Average Compensation Actually Paid to Non-PEO NEOs(1) |
Company TSR |
Compensation Peer Group TSR(2) |
Net Income (in millions) |
Adjusted EPS(3) | ||||||||||||||||||||||||||||||||||||||||
2025 |
$ | 7,055,667 (4) | $ | 7,510,597 (4) | $ | 6,327,892 | $ | 7,229,100 | $ | 2,979,458 (6) | $ | 2,255,625 (6) | $ | 93.81 | $ | 158.66 | $ | 1,111 | $ | 5.66 | ||||||||||||||||||||||||||||||
2024 |
$ | 8,580,730 (5) | $ | 7,829,705 (5) | N/A | N/A | $ | 2,957,990 (6) | $ | 2,438,759 (6) | $ | 87.33 | $ | 137.22 | $ | 1,051 | $ | 5.32 | ||||||||||||||||||||||||||||||||
2023 |
$ | 7,720,825 (5) | $ | 6,663,470 (5) | N/A | N/A | $ | 3,208,811 (6) | $ | 2,296,630 (6) | $ | 90.52 | $ | 109.82 (7) | $ | 944 | $ | 4.89 | ||||||||||||||||||||||||||||||||
2022 |
$ | 6,720,753 (5) | $ | 6,550,865 (5) | $ | 1,522,833 (8) | $ | 544,611 (8) | $ | 2,826,346 (6) | $ | 2,788,422 (6) | $ | 102.49 | $ | 118.19 (7) | $ | 820 | $ | 4.50 | ||||||||||||||||||||||||||||||
2021 |
$ | 7,398,128 (8) | $ | 8,409,238 (8) | N/A | N/A | $ | 1,839,683 (6) | $ | 2,025,485 (6) | $ | 124.81 | $ | 118.43 | $ | 1,263 | $ | 4.27 | ||||||||||||||||||||||||||||||||
| (1) | The table below sets forth each of the amounts required by SEC rule to be deducted from and added to the amount of total compensation as reflected in the Summary Compensation Table, to calculate compensation actually paid. In computing these amounts with respect to PSUs, (i) total fair value (FV) as of year-end is based on the updated expected payout of the PSU using data through year-end (including as estimated through Monte Carlo simulations), and (ii) total FV as of the vesting date is based on the number of shares actually earned based on performance. |
2025 |
2024 |
2023 |
2022 |
2021 |
||||||||||||||||||||||||||||||||||||||||||||
Adjustments to Total Compensation, from Summary Compensation Table |
PEO Serving at End of Year |
Other PEO Serving During Year |
All Average NEOs |
PEO at End of Year |
All Average NEOs |
PEO at End of Year |
All Average NEOs |
PEO Serving at End of Year |
Other PEO Serving During Year |
All Average NEOs |
PEO Serving at End of Year |
All Average NEOs |
||||||||||||||||||||||||||||||||||||
Total Compensation, from Summary Compensation Table |
$ | 7,055,667 | $ | 6,327,892 | $ | 2,979,458 | $ | 8,580,730 | $ | 2,957,990 | $ | 7,720,825 | $ | 3,208,811 | $ | 6,720,753 | $ | 1,522,833 | $ | 2,826,346 | $ | 7,398,128 | $ | 1,839,683 | ||||||||||||||||||||||||
Deduct |
$ | (4,060,491) | $ | (4,817,643) | $ | (1,024,321) | $ | (4,881,557) | $ | (1,151,400) | $ | (4,654,564) | $ | (1,191,531) | $ | (4,067,077) | $ | (290,791) | $ | (1,352,217) | $ | (3,999,969) | $ | (689,695) | ||||||||||||||||||||||||
Add year-end FV of equity awards granted during year that are outstanding and unvested as of year-end |
$ | 4,270,475 | $ | 5,151,441 | $ | 971,986 | $ | 5,038,937 | $ | 1,148,910 | $ | 4,312,502 | $ | 1,103,938 | $ | 3,974,063 | $ | — | $ | 1,315,031 | $ | 4,011,528 | $ | 706,983 | ||||||||||||||||||||||||
Add year-end of equity awards granted in prior years that are outstanding and unvested as of year-end |
$ | 221,868 | $ | 516,754 | $ | 63,136 | $ | (796,584) | $ | (161,524) | $ | (705,528) | $ | (238,561) | $ | 78,663 | $ | 318,793 | $ | 8,930 | $ | 1,430,514 | $ | 321,927 | ||||||||||||||||||||||||
Add |
$ | 23,078 | $ | 50,656 | $ | 6,129 | $ | (111,821) | $ | (27,665) | $ | (9,765) | $ | 870 | $ | (155,537) | $ | (461,447) | $ | (57,025) | $ | 116,792 | $ | 23,821 | ||||||||||||||||||||||||
Deduct |
$ | — | $ | — | $ | (105,431) | $ | — | $ | — | $ | — | $ | — | $ | — | $ | (1,041,948) | $ | — | $ | — | $ | — | ||||||||||||||||||||||||
Deduct |
$ | — | $ | — | $ | (685,295) | $ | — | $ | (360,504) | $ | — | $ | (624,104) | $ | — | $ | — | $ | — | $ | (1,017,097) | $ | (226,613) | ||||||||||||||||||||||||
Add |
$ | — | $ | — | $ | 49,963 | $ | — | $ | 32,952 | $ | — | $ | 37,207 | $ | — | $ | 497,171 | $ | 47,357 | $ | 469,342 | $ | 49,379 | ||||||||||||||||||||||||
Compensation Actually Paid (as defined by SEC rule) |
$ | 7,510,597 | $ | 7,229,100 | $ | 2,255,625 | $ | 7,829,705 | $ | 2,438,759 | $ | 6,663,470 | $ | 2,296,630 | $ | 6,550,865 | $ | 544,611 | $ | 2,788,422 | $ | 8,409,238 | $ | 2,025,485 | ||||||||||||||||||||||||
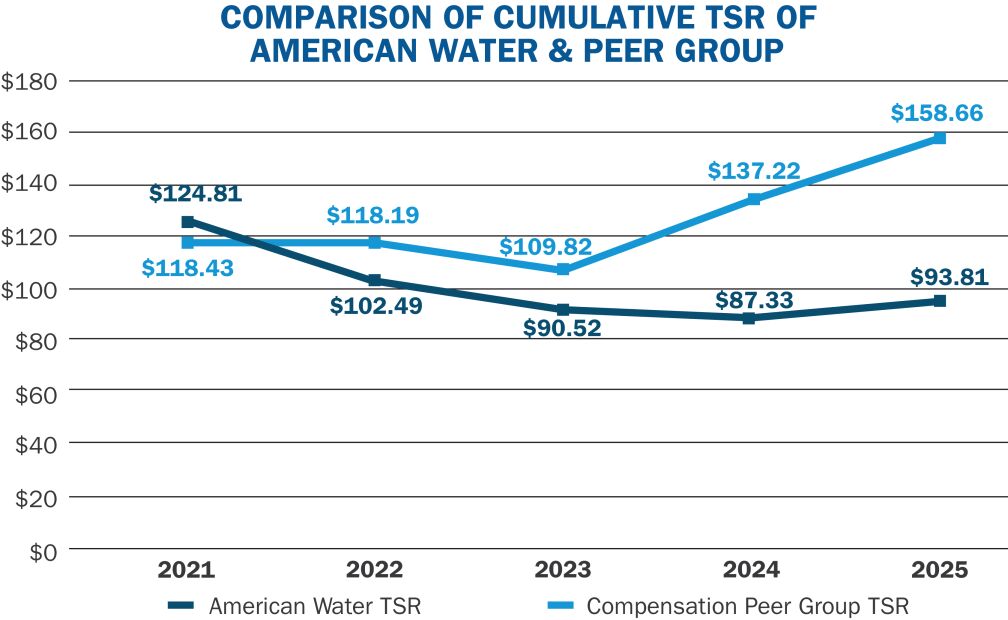
| (2) | The identity of the companies, and the analysis utilized by the ED&CC to review and approve changes, in the peer group for 2025, 2024, 2023, 2022 and 2021 are incorporated by reference from the descriptions contained in “Compensation Discussion and Analysis—Compensation Determinations and Pay Competitiveness” in this proxy statement and in the corresponding sections of our 2024, 2023, 2022 and 2021 proxy statements. The peer groups for 2025, 2024, 2023 and 2022 were comprised of the same companies, except that UGI Corporation replaced Public Service Enterprise Group Incorporated, beginning with the 2023 peer group. The peer group for 2021 was comprised of the same companies as for 2022, except that MDU Resources Group, Inc., which had been included in the 2021 peer group, was replaced by Essential Utilities, Inc. in 2022. |
| (3) | This metric is the Company-Selected Measure, which in our assessment represents the most important financial performance measure that we use to link compensation “actually paid” (as defined by SEC rule) in 2025 to our NEOs. Adjusted EPS is a non-GAAP measure. See Part B of Appendix A for a reconciliation. |
| (4) | Mr. Griffith has been serving as PEO commencing May 14, 2025, after succeeding Ms. Hardwick upon her retirement. |
| (5) | Ms. Hardwick was PEO from February 2, 2022 until May 14, 2025. |
| (6) | The persons included as the other NEOs in this calculation for each year are: (i) for 2025, Mses. Duffy, Kennedy, Norton and Mitchell, and Mr. Bowler; (ii) for 2024 and 2023, Mses. Kennedy and Norton, and James H. Gallegos and Mr. Griffith; (iii) for 2022, Mses. Kennedy and Norton, and Messrs. Gallegos and Griffith; and (iv) for 2021, Ms. Kennedy, Hardwick and Norton, and Adam Noble and Michael A. Sgro. |
| (7) | The cumulative TSR reported above for the Company’s peer group for (i) 2023 ($109.82) would have been $108.24 if the companies in the 2022 peer group had been used instead and (ii) 2022 ($118.19) would have |
| been $118.05 if the companies in the 2021 peer group had been used instead. There w e re no peer group changes that impacted compensation for 2025, 2024 or 2021. |
| (8) | During 2021, Walter J. Lynch served as our PEO until his retirement on February 2, 2022. |
| (6) | The persons included as the other NEOs in this calculation for each year are: (i) for 2025, Mses. Duffy, Kennedy, Norton and Mitchell, and Mr. Bowler; (ii) for 2024 and 2023, Mses. Kennedy and Norton, and James H. Gallegos and Mr. Griffith; (iii) for 2022, Mses. Kennedy and Norton, and Messrs. Gallegos and Griffith; and (iv) for 2021, Ms. Kennedy, Hardwick and Norton, and Adam Noble and Michael A. Sgro. |
| (7) | The cumulative TSR reported above for the Company’s peer group for (i) 2023 ($109.82) would have been $108.24 if the companies in the 2022 peer group had been used instead and (ii) 2022 ($118.19) would have |
| been $118.05 if the companies in the 2021 peer group had been used instead. There w e re no peer group changes that impacted compensation for 2025, 2024 or 2021. |
2025 |
2024 |
2023 |
2022 |
2021 |
||||||||||||||||||||||||||||||||||||||||||||
Adjustments to Total Compensation, from Summary Compensation Table |
PEO Serving at End of Year |
Other PEO Serving During Year |
All Average NEOs |
PEO at End of Year |
All Average NEOs |
PEO at End of Year |
All Average NEOs |
PEO Serving at End of Year |
Other PEO Serving During Year |
All Average NEOs |
PEO Serving at End of Year |
All Average NEOs |
||||||||||||||||||||||||||||||||||||
Total Compensation, from Summary Compensation Table |
$ | 7,055,667 | $ | 6,327,892 | $ | 2,979,458 | $ | 8,580,730 | $ | 2,957,990 | $ | 7,720,825 | $ | 3,208,811 | $ | 6,720,753 | $ | 1,522,833 | $ | 2,826,346 | $ | 7,398,128 | $ | 1,839,683 | ||||||||||||||||||||||||
Deduct |
$ | (4,060,491) | $ | (4,817,643) | $ | (1,024,321) | $ | (4,881,557) | $ | (1,151,400) | $ | (4,654,564) | $ | (1,191,531) | $ | (4,067,077) | $ | (290,791) | $ | (1,352,217) | $ | (3,999,969) | $ | (689,695) | ||||||||||||||||||||||||
Add year-end FV of equity awards granted during year that are outstanding and unvested as of year-end |
$ | 4,270,475 | $ | 5,151,441 | $ | 971,986 | $ | 5,038,937 | $ | 1,148,910 | $ | 4,312,502 | $ | 1,103,938 | $ | 3,974,063 | $ | — | $ | 1,315,031 | $ | 4,011,528 | $ | 706,983 | ||||||||||||||||||||||||
Add year-end of equity awards granted in prior years that are outstanding and unvested as of year-end |
$ | 221,868 | $ | 516,754 | $ | 63,136 | $ | (796,584) | $ | (161,524) | $ | (705,528) | $ | (238,561) | $ | 78,663 | $ | 318,793 | $ | 8,930 | $ | 1,430,514 | $ | 321,927 | ||||||||||||||||||||||||
Add |
$ | 23,078 | $ | 50,656 | $ | 6,129 | $ | (111,821) | $ | (27,665) | $ | (9,765) | $ | 870 | $ | (155,537) | $ | (461,447) | $ | (57,025) | $ | 116,792 | $ | 23,821 | ||||||||||||||||||||||||
Deduct |
$ | — | $ | — | $ | (105,431) | $ | — | $ | — | $ | — | $ | — | $ | — | $ | (1,041,948) | $ | — | $ | — | $ | — | ||||||||||||||||||||||||
Deduct |
$ | — | $ | — | $ | (685,295) | $ | — | $ | (360,504) | $ | — | $ | (624,104) | $ | — | $ | — | $ | — | $ | (1,017,097) | $ | (226,613) | ||||||||||||||||||||||||
Add |
$ | — | $ | — | $ | 49,963 | $ | — | $ | 32,952 | $ | — | $ | 37,207 | $ | — | $ | 497,171 | $ | 47,357 | $ | 469,342 | $ | 49,379 | ||||||||||||||||||||||||
Compensation Actually Paid (as defined by SEC rule) |
$ | 7,510,597 | $ | 7,229,100 | $ | 2,255,625 | $ | 7,829,705 | $ | 2,438,759 | $ | 6,663,470 | $ | 2,296,630 | $ | 6,550,865 | $ | 544,611 | $ | 2,788,422 | $ | 8,409,238 | $ | 2,025,485 | ||||||||||||||||||||||||
The following is an unranked tabular list of the most important financial and
non-financial
measure
s that we use to link compensation “actually paid” (as defined by SEC rule and set forth above) to all of our NEOs during 2025 to our performance. The Company-Selected Measure is denoted with an asterisk. Tabular List of Performance Measures | ||
Financial |
Non-Financial | |
EPS/Adjusted EPS* |
DART | |
EPS CAGR |
Drinking Water Quality | |
Relative TSR |
Customer Satisfaction | |
ROE |
||
non-GAAP
measure. See Part B of Appendix A for a reconciliation.