Pay vs Performance Disclosure - USD ($)
Dec. 31, 2021
Jun. 25, 2021
Dec. 31, 2025
Dec. 31, 2024
Dec. 31, 2023
Dec. 31, 2022
Dec. 31, 2021
Pay versus Performance
As required by Section 953(a) of the Dodd-Frank Act and Item 402(v) of Regulation philosophy and how the Compensation Committee makes its decisions about executive pay, you should refer to the CD&A.
S-K,
we are providing the following pay versus performance (“PVP”) table and related information, including “compensation actually paid” (as defined by the SEC and further described below) or “CAP”. For details about the Company’s pay-for-performance
PVP Table
Value of Initial Fixed $100Investment Based On: |
||||||||||||||||||||||||||||||||||||||||||||
Year |
SCT Total for PEO (Slager) (1) |
CAP to PEO (Slager) (1) (2) |
SCT total for PEO (Vander Ark) (3) |
CAP to PEO (Vander Ark) (2) (3) |
Average SCT Total for Non-PEO NEOs (4) |
Average CAP to Non-PEO NEOs (2) (4) |
Total Shareholder Return |
Peer Group (5) Total Shareholder Return (2025 Peer Group) |
Peer Group (5) Total Shareholder Return (2021-2024 Peer Group) |
Net Income |
Adjusted Free Cash Flow (6) |
|||||||||||||||||||||||||||||||||
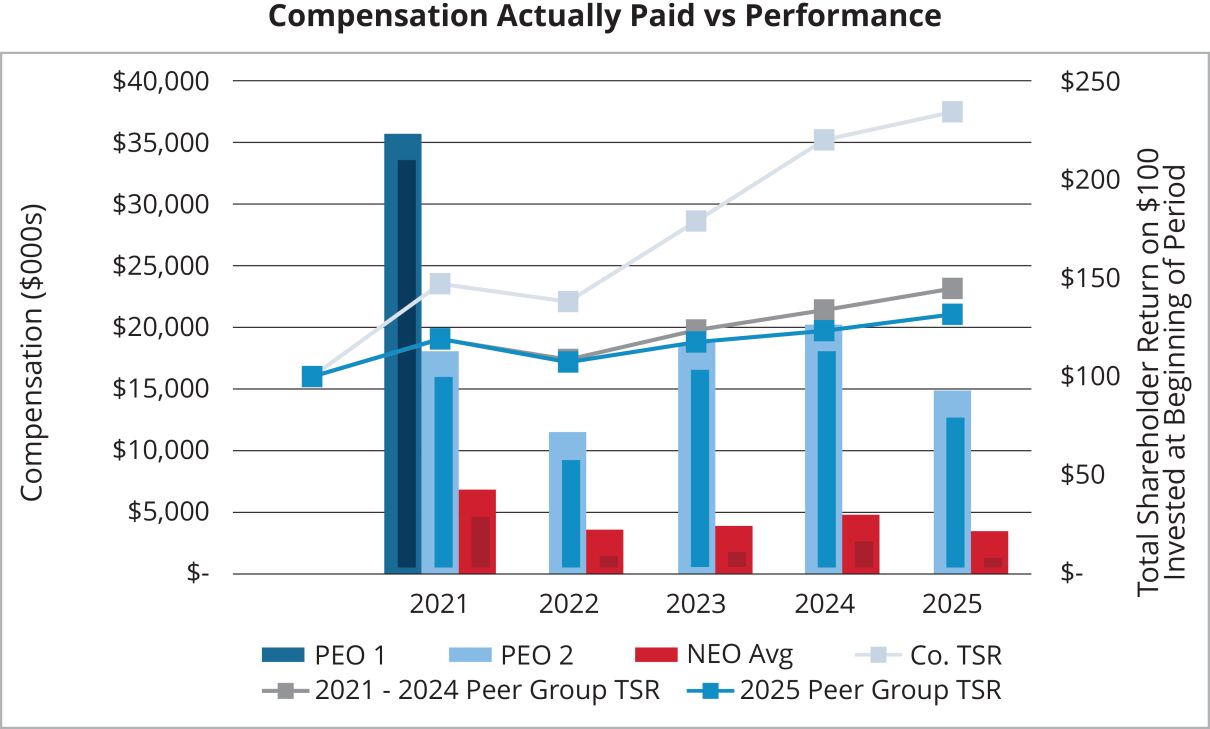
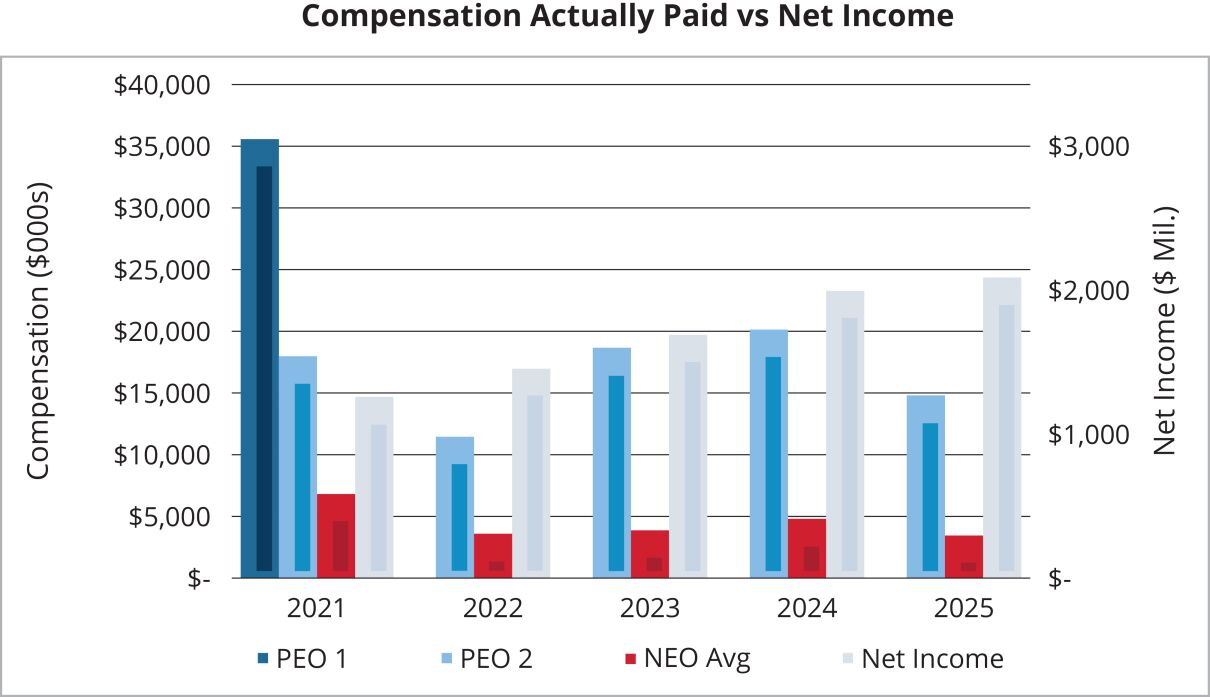
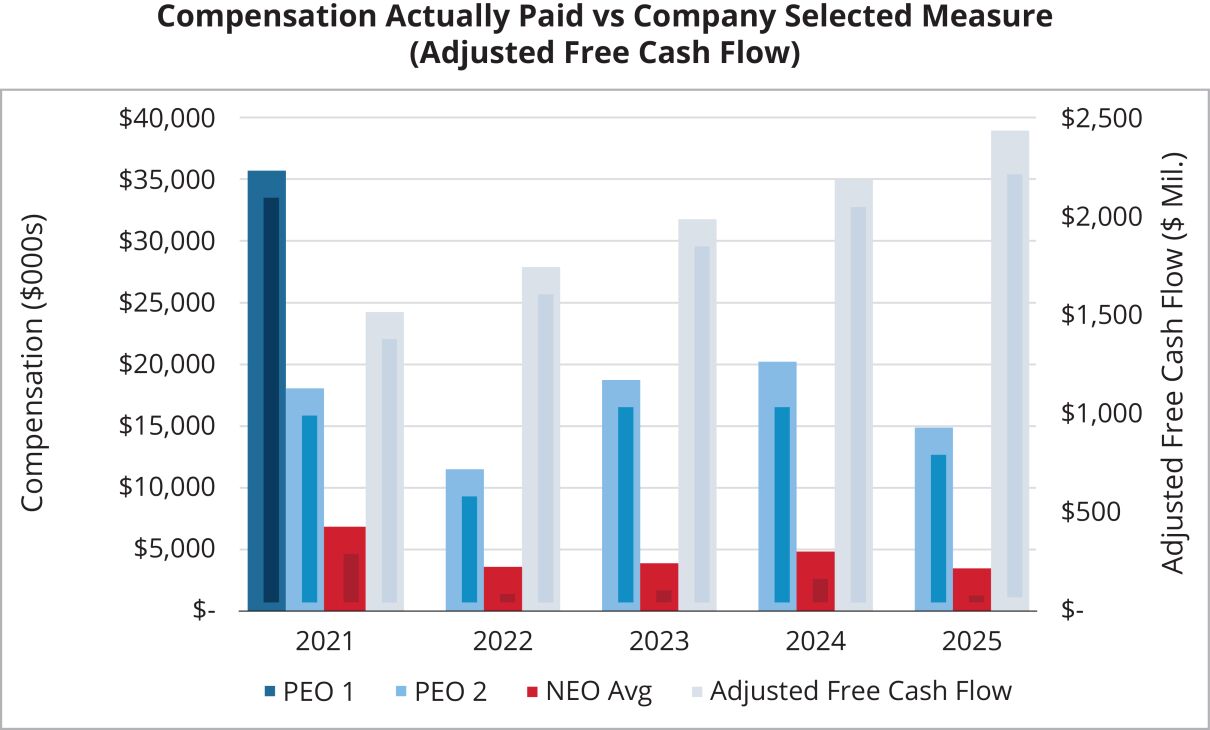
2025 |
N/A |
N/A |
$ |
14,857,016 |
$ |
14,865,606 |
$ |
3,360,819 |
$ |
3,462,640 |
$ |
234.13 |
$ |
131.58 |
$ |
144.66 |
$ |
2,139 |
$ |
2,433 |
||||||||||||||||||||||||
2024 |
N/A |
N/A |
$ |
12,806,922 |
$ |
20,215,828 |
$ |
3,262,335 |
$ |
4,815,156 |
$ |
219.96 |
$ |
123.22 |
$ |
133.81 |
$ |
2,043 |
$ |
2,183 |
||||||||||||||||||||||||
2023 |
N/A |
N/A |
$ |
11,336,591 |
(7) |
$ |
18,731,525 |
(7) |
$ |
3,354,729 |
$ |
3,871,169 |
(7) |
$ |
178.80 |
$ |
117.60 |
$ |
123.52 |
$ |
1,731 |
$ |
1,985 |
|||||||||||||||||||||
2022 |
N/A |
N/A |
$ |
9,914,945 |
(7) |
$ |
11,495,079 |
(7) |
$ |
3,405,936 |
$ |
3,591,775 |
$ |
137.95 |
$ |
107.37 |
$ |
108.67 |
$ |
1,488 |
$ |
1,742 |
||||||||||||||||||||||
2021 |
$ |
15,027,945 |
$ |
35,683,981 |
$ |
7,873,660 |
$ |
18,049,268 |
$ |
3,365,003 |
$ |
6,844,632 |
$ |
147.01 |
$ |
119.19 |
$ |
118.97 |
$ |
1,290 |
$ |
1,515 |
||||||||||||||||||||||
(1) |
Reflects compensation for our former Chief Executive Officer, Mr. Slager, who served as our Principal Executive Officer (PEO) during a portion of 2021 until his retirement effective June 25, 2021. |
(2) |
CAP is calculated by making the following adjustments from the SCT totals as follows: |
PEOs:
Item and Value Added (Deducted) |
2025 Vander Ark |
2024 Vander Ark |
2023 Vander Ark |
2022 Vander Ark |
2021 Vander Ark |
2021 Slager |
||||||||||||||||||
Summary Compensation Table Total |
$ |
14,857,016 |
$ |
12,806,922 |
$ |
11,336,591 |
$ |
9,914,945 |
$ |
7,873,660 |
$ |
15,027,945 |
||||||||||||
- SCT Stock Awards Column Value |
($ |
11,124,489 |
) |
($ |
8,463,766 |
) |
($ |
7,343,734 |
) |
($ |
5,660,534 |
) |
($ |
4,613,538 |
) |
($ |
10,004,991 |
) | ||||||
+ Year-End Fair Value of Outstanding Equity Awards Granted in Covered Year |
$ |
9,661,487 |
$ |
10,058,007 |
$ |
9,643,993 |
$ |
6,862,648 |
$ |
8,543,250 |
$ |
14,959,599 |
||||||||||||
+/- Change in Fair Value of Outstanding Equity Awards Granted in Prior Years |
$ |
64,009 |
$ |
3,411,151 |
$ |
2,669,353 |
($ |
131,216 |
) |
$ |
5,164,238 |
$ |
4,211,103 |
|||||||||||
+/- Change in Fair Value of Prior-Year Equity Awards Vested in Covered Year |
$ |
721,636 |
$ |
2,343,100 |
$ |
2,126,092 |
($ |
686,831 |
) |
$ |
902,692 |
$ |
5,695,213 |
|||||||||||
+ Fair Value as of Vesting Date of Equity Awards Granted and Vested in Covered Year |
$ |
0 |
$ |
0 |
$ |
0 |
$ |
0 |
$ |
0 |
$ |
4,521,132 |
||||||||||||
+ Average Value of Dividends Paid on Equity Awards not Otherwise Reflected in Fair Value of Total Compensation |
$ |
685,947 |
$ |
60,414 |
$ |
299,230 |
$ |
1,196,067 |
$ |
178,966 |
$ |
1,273,980 |
||||||||||||
Compensation Actually Paid |
$ |
14,865,606 |
$ |
20,215,828 |
$ |
18,731,525 |
$ |
11,495,079 |
$ |
18,049,268 |
$ |
35,683,981 |
||||||||||||
Average
Non-PEO
NEOs: Item and Value Added (Deducted) |
2025 |
2024 |
2023 |
2022 |
2021 |
|||||||||||||||
Summary Compensation Table Total |
$ |
3,360,819 |
$ |
3,262,335 |
$ |
3,354,729 |
$ |
3,405,936 |
$ |
3,365,003 |
||||||||||
- SCT Stock Awards Column Value |
($ |
2,047,393 |
) |
($ |
1,710,589 |
) |
($ |
1,684,108 |
) |
($ |
1,670,511 |
) |
($ |
1,673,751 |
) | |||||
+ Year-End Fair Value of Outstanding Equity Awards Granted in Covered Year |
$ |
1,778,142 |
$ |
2,020,309 |
$ |
1,550,800 |
$ |
1,928,470 |
$ |
3,219,620 |
||||||||||
+/- Change in Fair Value of Outstanding Equity Awards Granted in Prior Years |
$ |
25,360 |
$ |
729,628 |
$ |
571,552 |
($ |
75,670 |
) |
$ |
1,458,159 |
|||||||||
+/- Change in Fair Value of Prior-Year Equity Awards Vested in Covered Year |
$ |
208,597 |
$ |
482,935 |
$ |
594,990 |
($ |
232,884 |
) |
$ |
380,189 |
|||||||||
+/- Change in Fair Value at the end of the Prior Year of Equity Awards that Failed to Meet Vesting Conditions in the Year |
$ |
0 |
$ |
0 |
($ |
607,379 |
) |
$ |
0 |
$ |
0 |
|||||||||
+ Average Value of Dividends Paid on Equity Awards not Otherwise Reflected in Fair Value of Total Compensation |
$ |
137,115 |
$ |
30,538 |
$ |
90,585 |
$ |
236,434 |
$ |
95,412 |
||||||||||
Compensation Actually Paid |
$ |
3,462,640 |
$ |
4,815,156 |
$ |
3,871,169 |
$ |
3,591,775 |
$ |
6,844,632 |
||||||||||
Pay versus performance measurement date fair values were determined based on the same methodology used for grant date fair value purposes. Restricted stock units were valued based on the closing stock price on the relevant measurement date. Performance stock units were valued using a fair value per share determined using a Monte Carlo model run on the relevant measurement date. On the vesting date, the final payout factor is applied to the closing stock price on that date.
(3) |
Reflects compensation for our President and Chief Executive Officer, Mr. Vander Ark, who has served as our PEO since June 25, 2021. The compensation reflected includes Mr. Vander Ark’s pay as a non-PEO NEO in 2021. |
(4) |
The Company’s non-PEO NEOs for 2021-2025 were: |
2021: Brian M. DelGhiaccio, Catharine D. Ellingsen, Jeffrey A. Hughes and Timothy E. Stuart
2022: Brian M. DelGhiaccio, Brian A. Bales, Catharine D. Ellingsen and Timothy E. Stuart
2023: Brian M. DelGhiaccio, Brian A. Bales, Gregg K. Brummer, Catharine D. Ellingsen and Timothy E. Stuart
2024: Brian M. DelGhiaccio, Brian A. Bales, Gregg K. Brummer and Catharine D. Ellingsen
2025: Brian M. DelGhiaccio, Brian A. Bales, Gregg K. Brummer and Catharine D. Ellingsen
(5) |
The Company has used its peer group from the CD&A for purposes of this comparison. The companies that comprised the Peer Group selected by the Talent & Compensation Committee in our CD&A were as follows: |
2021-2024: Air Products and Chemicals, Inc., American Electric Power Company, Inc., Canadian National Railway Company, Canadian Pacific Kansas City Limited (formerly Canadian Pacific Railway Limited), Cintas Corporation, CSX Corporation, Ecolab Inc., Entergy Corporation, Fastenal Company, FedEx Corporation, J.B. Hunt Transport Services, Inc., Norfolk Southern Corporation, Ryder System, Inc., Sysco Corporation, W.W. Grainger, Inc., Waste Connections, Inc. and Waste Management, Inc. 2025: American Electric Power Company, Inc., Canadian National Railway Company, Canadian Pacific Kansas City Limited, Cintas Corporation, CSX Corporation, Dow Inc., Ecolab Inc., FedEx Corporation, J.B. Hunt Transport Services, Inc., LyondellBasell Industries N.V., NextEra Energy, Inc., Norfolk Southern Corporation, Sysco Corporation, Union Pacific Corporation, W.W. Grainger, Inc., Waste Connections, Inc. and Waste Management, Inc. |
The Company updated the composition of its Peer Group in 2025 to better align with companies of similar size and business model to Republic. See page 76 for additional information on the updated Peer Group.
(6) |
The Company Selected Measure is adjusted free cash flow, as described in the CD&A section. Adjusted free cash flow is a non-GAAP financial measure. For a reconciliation of adjusted free cash flow to its comparable GAAP measure, see “Reconciliation of GAAP to Non-GAAP Financial Measures” in the Annex on page 105. |
(7) |
For 2022 and 2023, SCT totals for PEO (Vander Ark) reflect recalculation of “All Other Compensation” relating to use of Company-owned aircraft in accordance with SEC rules and for 2023, Average CAP to Non-PEO NEOs reflects a recalculation of the fair value of equity awards to conform to the stated vesting of those awards. |
(4) |
The Company’s non-PEO NEOs for 2021-2025 were: |
2021: Brian M. DelGhiaccio, Catharine D. Ellingsen, Jeffrey A. Hughes and Timothy E. Stuart
2022: Brian M. DelGhiaccio, Brian A. Bales, Catharine D. Ellingsen and Timothy E. Stuart
2023: Brian M. DelGhiaccio, Brian A. Bales, Gregg K. Brummer, Catharine D. Ellingsen and Timothy E. Stuart
2024: Brian M. DelGhiaccio, Brian A. Bales, Gregg K. Brummer and Catharine D. Ellingsen
2025: Brian M. DelGhiaccio, Brian A. Bales, Gregg K. Brummer and Catharine D. Ellingsen
(5) |
The Company has used its peer group from the CD&A for purposes of this comparison. The companies that comprised the Peer Group selected by the Talent & Compensation Committee in our CD&A were as follows: |
2021-2024: Air Products and Chemicals, Inc., American Electric Power Company, Inc., Canadian National Railway Company, Canadian Pacific Kansas City Limited (formerly Canadian Pacific Railway Limited), Cintas Corporation, CSX Corporation, Ecolab Inc., Entergy Corporation, Fastenal Company, FedEx Corporation, J.B. Hunt Transport Services, Inc., Norfolk Southern Corporation, Ryder System, Inc., Sysco Corporation, W.W. Grainger, Inc., Waste Connections, Inc. and Waste Management, Inc. 2025: American Electric Power Company, Inc., Canadian National Railway Company, Canadian Pacific Kansas City Limited, Cintas Corporation, CSX Corporation, Dow Inc., Ecolab Inc., FedEx Corporation, J.B. Hunt Transport Services, Inc., LyondellBasell Industries N.V., NextEra Energy, Inc., Norfolk Southern Corporation, Sysco Corporation, Union Pacific Corporation, W.W. Grainger, Inc., Waste Connections, Inc. and Waste Management, Inc. |
The Company updated the composition of its Peer Group in 2025 to better align with companies of similar size and business model to Republic. See page 76 for additional information on the updated Peer Group.
PEOs:
Item and Value Added (Deducted) |
2025 Vander Ark |
2024 Vander Ark |
2023 Vander Ark |
2022 Vander Ark |
2021 Vander Ark |
2021 Slager |
||||||||||||||||||
Summary Compensation Table Total |
$ |
14,857,016 |
$ |
12,806,922 |
$ |
11,336,591 |
$ |
9,914,945 |
$ |
7,873,660 |
$ |
15,027,945 |
||||||||||||
- SCT Stock Awards Column Value |
($ |
11,124,489 |
) |
($ |
8,463,766 |
) |
($ |
7,343,734 |
) |
($ |
5,660,534 |
) |
($ |
4,613,538 |
) |
($ |
10,004,991 |
) | ||||||
+ Year-End Fair Value of Outstanding Equity Awards Granted in Covered Year |
$ |
9,661,487 |
$ |
10,058,007 |
$ |
9,643,993 |
$ |
6,862,648 |
$ |
8,543,250 |
$ |
14,959,599 |
||||||||||||
+/- Change in Fair Value of Outstanding Equity Awards Granted in Prior Years |
$ |
64,009 |
$ |
3,411,151 |
$ |
2,669,353 |
($ |
131,216 |
) |
$ |
5,164,238 |
$ |
4,211,103 |
|||||||||||
+/- Change in Fair Value of Prior-Year Equity Awards Vested in Covered Year |
$ |
721,636 |
$ |
2,343,100 |
$ |
2,126,092 |
($ |
686,831 |
) |
$ |
902,692 |
$ |
5,695,213 |
|||||||||||
+ Fair Value as of Vesting Date of Equity Awards Granted and Vested in Covered Year |
$ |
0 |
$ |
0 |
$ |
0 |
$ |
0 |
$ |
0 |
$ |
4,521,132 |
||||||||||||
+ Average Value of Dividends Paid on Equity Awards not Otherwise Reflected in Fair Value of Total Compensation |
$ |
685,947 |
$ |
60,414 |
$ |
299,230 |
$ |
1,196,067 |
$ |
178,966 |
$ |
1,273,980 |
||||||||||||
Compensation Actually Paid |
$ |
14,865,606 |
$ |
20,215,828 |
$ |
18,731,525 |
$ |
11,495,079 |
$ |
18,049,268 |
$ |
35,683,981 |
||||||||||||
Average
Non-PEO
NEOs: Item and Value Added (Deducted) |
2025 |
2024 |
2023 |
2022 |
2021 |
|||||||||||||||
Summary Compensation Table Total |
$ |
3,360,819 |
$ |
3,262,335 |
$ |
3,354,729 |
$ |
3,405,936 |
$ |
3,365,003 |
||||||||||
- SCT Stock Awards Column Value |
($ |
2,047,393 |
) |
($ |
1,710,589 |
) |
($ |
1,684,108 |
) |
($ |
1,670,511 |
) |
($ |
1,673,751 |
) | |||||
+ Year-End Fair Value of Outstanding Equity Awards Granted in Covered Year |
$ |
1,778,142 |
$ |
2,020,309 |
$ |
1,550,800 |
$ |
1,928,470 |
$ |
3,219,620 |
||||||||||
+/- Change in Fair Value of Outstanding Equity Awards Granted in Prior Years |
$ |
25,360 |
$ |
729,628 |
$ |
571,552 |
($ |
75,670 |
) |
$ |
1,458,159 |
|||||||||
+/- Change in Fair Value of Prior-Year Equity Awards Vested in Covered Year |
$ |
208,597 |
$ |
482,935 |
$ |
594,990 |
($ |
232,884 |
) |
$ |
380,189 |
|||||||||
+/- Change in Fair Value at the end of the Prior Year of Equity Awards that Failed to Meet Vesting Conditions in the Year |
$ |
0 |
$ |
0 |
($ |
607,379 |
) |
$ |
0 |
$ |
0 |
|||||||||
+ Average Value of Dividends Paid on Equity Awards not Otherwise Reflected in Fair Value of Total Compensation |
$ |
137,115 |
$ |
30,538 |
$ |
90,585 |
$ |
236,434 |
$ |
95,412 |
||||||||||
Compensation Actually Paid |
$ |
3,462,640 |
$ |
4,815,156 |
$ |
3,871,169 |
$ |
3,591,775 |
$ |
6,844,632 |
||||||||||
Tabular List of Company Performance Measures
The table below lists in
alphabetical
order the financial performance measures that we believe represent the most important performance measures used to link CAP to our named executive officers to our performance for the most recently completed fiscal year. See our CD&A at pages 56-79 for a further discussion of these performance measures. Adjusted Earnings Per Share
Adjusted Free Cash Flow
Cash Flow Value Creation
Return on Invested Capital
Total Shareholder Return
For a more comprehensive discussion of how the Talent & Compensation Committee views the
relationship
between named executive officer pay and performance, please see our CD&A at pages 56-79 of
this Proxy Statement. non-GAAP
financial measure. For a reconciliation of adjusted free cash flow to its comparable GAAP measure, see “Reconciliation of GAAP to Non-GAAP
Financial Measures” in the Annex on page 105.