Pay vs Performance Disclosure
Dec. 31, 2025
USD ($)
Dec. 31, 2024
USD ($)
Dec. 31, 2023
USD ($)
Dec. 31, 2022
USD ($)
Dec. 31, 2021
USD ($)
| Year | Summary Compensation Table Total for CEO | Compensation Actually Paid to CEO1 | Average Summary Compensation Table Total for Non-CEO Named Executive Officers | Average Compensation Actually Paid to Non-CEO Named Executive Officers2 | Value of initial fixed $100 investment based on:3 | Net Income (in billions) | Combined Ratio5 | |||||||||||||||||||
Total Shareholder Return | Peer Group Total Shareholder Return4 | |||||||||||||||||||||||||
| 2025 | $ | 17,705,924 | $ | 25,770,278 | $ | 4,775,921 | $ | 5,990,098 | $ | 254.12 | $ | 228.85 | $ | 11.3 | 87.4 | |||||||||||
| 2024 | 16,377,514 | 61,138,966 | 4,339,067 | 12,538,153 | 261.98 | 209.20 | 8.5 | 88.8 | ||||||||||||||||||
| 2023 | 15,636,618 | 49,003,116 | 4,062,285 | 9,728,818 | 173.05 | 154.70 | 3.9 | 94.9 | ||||||||||||||||||
| 2022 | 12,748,826 | 48,474,661 | 3,171,093 | 9,195,384 | 140.52 | 139.68 | 0.7 | 95.8 | ||||||||||||||||||
| 2021 | 14,462,961 | 26,403,691 | 3,668,598 | 5,359,600 | 110.82 | 117.51 | 3.4 | 95.3 | ||||||||||||||||||
below) under the circumstances set forth below:a
| 2025 | 2024 | 2023 | 2022 | 2021 | |||||||||||||
| Closing stock price as of last trading day of year | $227.72 | $239.61 | $159.28 | $129.71 | $102.65 | ||||||||||||
Deduction of the grant date fair value of awards reported in the “Stock Awards” column of the Summary Compensation Table (Stock Awards) for the covered fiscal year | $ | (11,000,278) | $ | (10,500,128) | $ | (10,000,106) | $ | (9,500,203) | $ | (9,500,212) | |||||||
Addition of the year-end fair value of all Stock Awards granted during the covered fiscal year that are outstanding and unvested | 16,475,484 | 22,068,144 | 20,662,548 | 16,357,106 | 12,631,713 | ||||||||||||
Change in the year-end fair value (from prior year end) of all Stock Awards granted in any prior fiscal year that are outstanding and unvested | (313,546) | 22,607,319 | 15,038,380 | 23,872,689 | 8,498,852 | ||||||||||||
Change in the fair value (from prior year end to vesting date) of all Stock Awards granted in any prior fiscal year that vested | 2,902,694 | 10,586,117 | 7,665,676 | 4,996,243 | 310,377 | ||||||||||||
| Total Adjustments | $ | 8,064,354 | $ | 44,761,452 | $ | 33,366,498 | $ | 35,725,835 | $ | 11,940,730 | |||||||
a Beginning in 2025, the Stock Awards were granted under the 2024 Plan and include time-based and performance-based restricted stock unit awards. For each covered fiscal year, the additions and changes in fair value in the table above also reflect the value of any reinvested dividend equivalent units applicable to these Stock Awards in connection with dividends paid on the company’s common stock, and changes in the projected vesting factor for performance-based restricted stock unit awards. See “Executive Compensation – Summary Compensation Table,” “Executive Compensation – Narrative Disclosure to Summary Compensation Table and Grants of Plan-Based Awards Table,” “Executive Compensation – Outstanding Equity Awards at Fiscal Year-End,” and “Executive Compensation – Option Exercises and Stock Vested” for further discussion.
| 2025 | 2024 | 2023 | 2022 | 2021 | |||||||||||||
Deduction of the grant date fair value of Stock Awards for the covered fiscal year | $ | (2,247,211) | $ | (2,104,937) | $ | (2,003,269) | $ | (1,906,333) | $ | (2,134,497) | |||||||
Addition of the year-end fair value of all Stock Awards granted during the covered fiscal year that are outstanding and unvested | 3,080,661 | 4,042,343 | 3,782,595 | 3,359,339 | 2,755,577 | ||||||||||||
Change in the year-end fair value (from prior year end) of all Stock Awards granted in any prior fiscal year that are outstanding and unvested | (209,902) | 4,376,523 | 2,854,453 | 3,915,370 | 1,061,423 | ||||||||||||
Change in the fair value (from prior year end to vesting date) of all Stock Awards granted in any prior fiscal year that vested | 590,629 | 1,885,157 | 1,032,754 | 655,915 | 8,499 | ||||||||||||
| Total Adjustments | $ | 1,214,177 | $ | 8,199,086 | $ | 5,666,533 | $ | 6,024,291 | $ | 1,691,002 | |||||||
a For additional information, see Note a to Note 1.
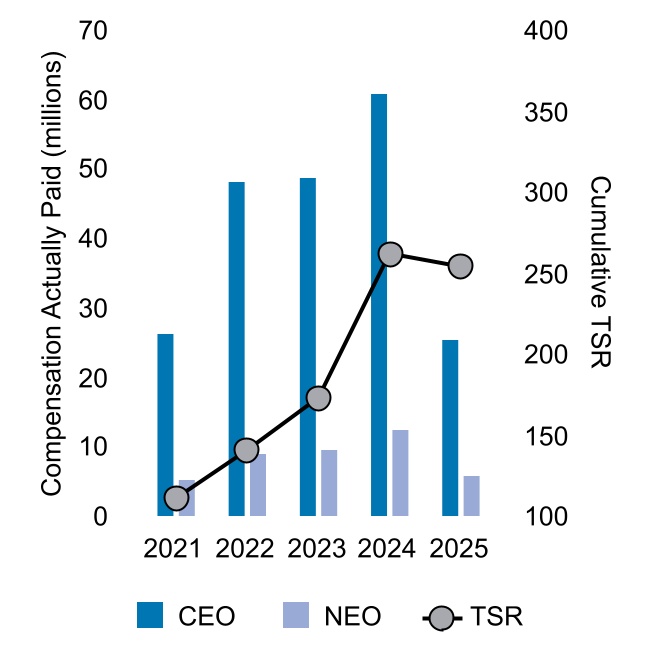
Cumulative TSR As shown in the Pay Versus Performance Table, our TSR increased over the covered periods from $110.82 to $254.12. During most of the covered fiscal years, our cumulative TSR outpaced the TSR of our chosen peer group, the S&P 500 P/C Group. TSR is the cumulative value at the end of each covered period, assuming $100 was invested at the close of trading on December 31, 2020.
As noted above, the compensation actually paid amounts to our NEOs during the covered periods reflected changes in the fair value of our time-based and performance-based restricted stock unit awards. These amounts increased compensation actually paid, as compared to the values reflected in the Summary Compensation Table totals, for each NEO during each covered year.
We do not include TSR as a performance measure in our executive compensation program. Rather, we focus on our stated operating and investment goals and allow TSR to reflect our achievement of those goals. However, we do provide a high percentage of total compensation to our NEOs in the form of equity awards. Accordingly, as our stock price increases (and TSR likewise increases), we expect that the compensation actually paid amounts to our NEOs will generally increase proportionately. Short-term stock price movements affect TSR, including in 2025, while our compensation philosophy and business decisions remain focused on creating an enduring business and long-term shareholder value.
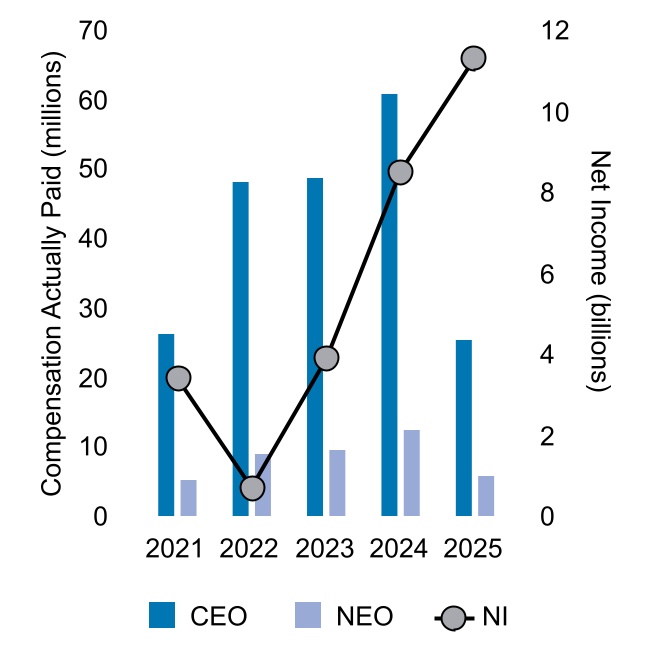
Net Income As a property-casualty insurance company, we have earnings from both underwriting activity and investment operations. We believe that our shareholder value will be increased in the long run if we continue to focus on profitable growth of our insurance operations and the relative performance of our fixed-maturity portfolio. Net income, which includes the impact of market fluctuations on our equity investments, increased in 2025, reflecting profitable underwriting and investment results.
Due to our long-term focus on our insurance operations, we make business decisions and set annual targets that are designed to enhance the longer-term performance of those operations. Accordingly, the trends in the compensation actually paid amounts to our NEOs may not correlate with net income as we do not use net income as a performance measure in our executive compensation program.
Relationship Between Compensation Actually Paid and Performance Measures
Compensation Actually Paid As shown in the Pay Versus Performance Table, compensation actually paid decreased sizably in 2025, after increasing in 2024 and remaining relatively consistent in 2023 and in 2022. The variation in these amounts during the covered periods reflected changes to the fair value of our time-based and performance-based restricted stock unit awards, the additional value of any new reinvested dividend equivalent units applicable to these awards, and changes in the projected vesting factor for performance-based awards.
Combined Ratio We have selected our combined ratio as the “company-selected measure” for the Pay Versus Performance Table because it supports a strong pay-for-performance linkage and further aligns our executives’ interests with those of our shareholders. A fundamental tenet of our executive compensation program continues to be to support our long-standing companywide goal of growing as fast as we can at a 96 or better combined ratio while continuing to deliver high-quality customer service. We strongly believe that achieving our target profit margin takes precedence over growing premiums in years where we are challenged to achieve both, as was the case in both 2022 and 2023.
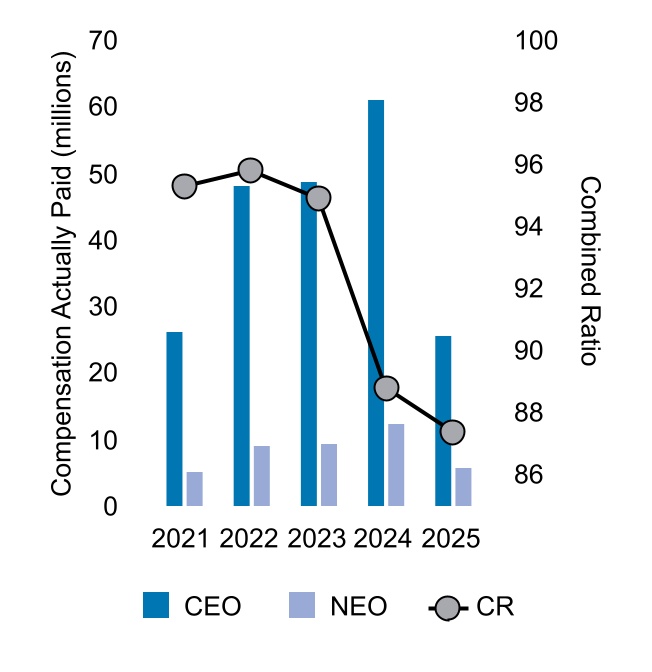
Our Gainshare program is designed to support our long-standing companywide goal. Gainshare payments each year, if any, are based in part on the profitability of our insurance businesses, on a weighted-average basis, through our combined ratio performance measure. Accordingly, in years where our combined ratio is higher, the payouts under the Gainshare program are adversely impacted. During all of the covered fiscal years, we satisfied our goal of achieving a 96 or better combined ratio on a companywide basis, although not all of our insurance businesses achieved this target. The 2025 Gainshare payout reflects satisfying or exceeding our combined ratio targets for all of our insurance businesses. Because Gainshare is a cash incentive program, the value applicable to Gainshare payouts is the same in both the Summary Compensation Table total and the compensation actually paid columns in the Pay Versus Performance Table.
Additionally, our annual performance-based restricted stock unit awards (performance versus market insurance results) include a profitability requirement of a combined ratio of 96 or better over the most recent 12-month period when the vesting is determined. The profitability requirement was met for the awards that vested in each of the years shown. The vesting of these awards was included in the applicable compensation actually paid column in the Pay Versus Performance Table and reflected changes in the fair value of these awards as described above.
Relationship Between Our Cumulative TSR and our Peer Group’s Cumulative TSR
The following graph compares the cumulative TSR of Progressive’s Common Shares (PGR) to the cumulative TSR of our chosen peer group for the last five years, assuming $100 was invested at the close of trading on December 31, 2020.
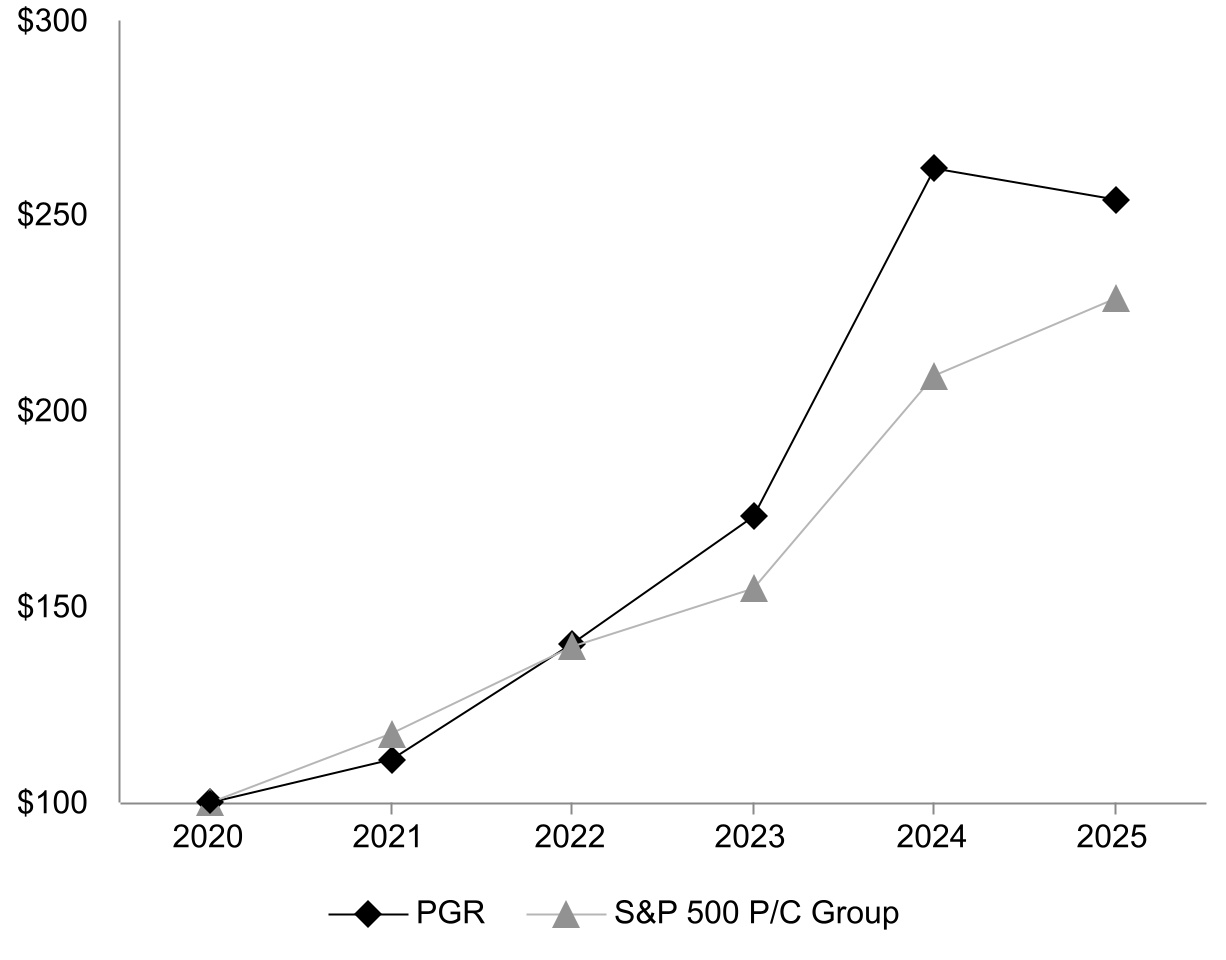
| For the years ended December 31, | 2021 | 2022 | 2023 | 2024 | 2025 | ||||||||||||
| PGR | $ | 110.82 | $ | 140.52 | $ | 173.05 | $ | 261.98 | $ | 254.12 | |||||||
| S&P 500 P/C Group | 117.51 | 139.68 | 154.70 | 209.20 | 228.85 | ||||||||||||
| Name | Combined Ratio | Premium Growth | 3-Year Return Fixed- Income Portfolio | Policies In Force (PIF) Growth | ||||||||||
| Susan Patricia Griffith | ✔ | ✔ | ✔ | ✔ | ||||||||||
| John P. Sauerland | ✔ | ✔ | ✔ | ✔ | ||||||||||
| Patrick K. Callahan | ✔ | ✔ | ✔ | |||||||||||
| Karen B. Bailo | ✔ | ✔ | ✔ | |||||||||||
| John Murphy | ✔ | ✔ | ✔ | |||||||||||
4 Our peer group is the Standard & Poor’s 500 Property & Casualty Insurance Index (S&P 500 P/C Group).