Pay Versus Performance
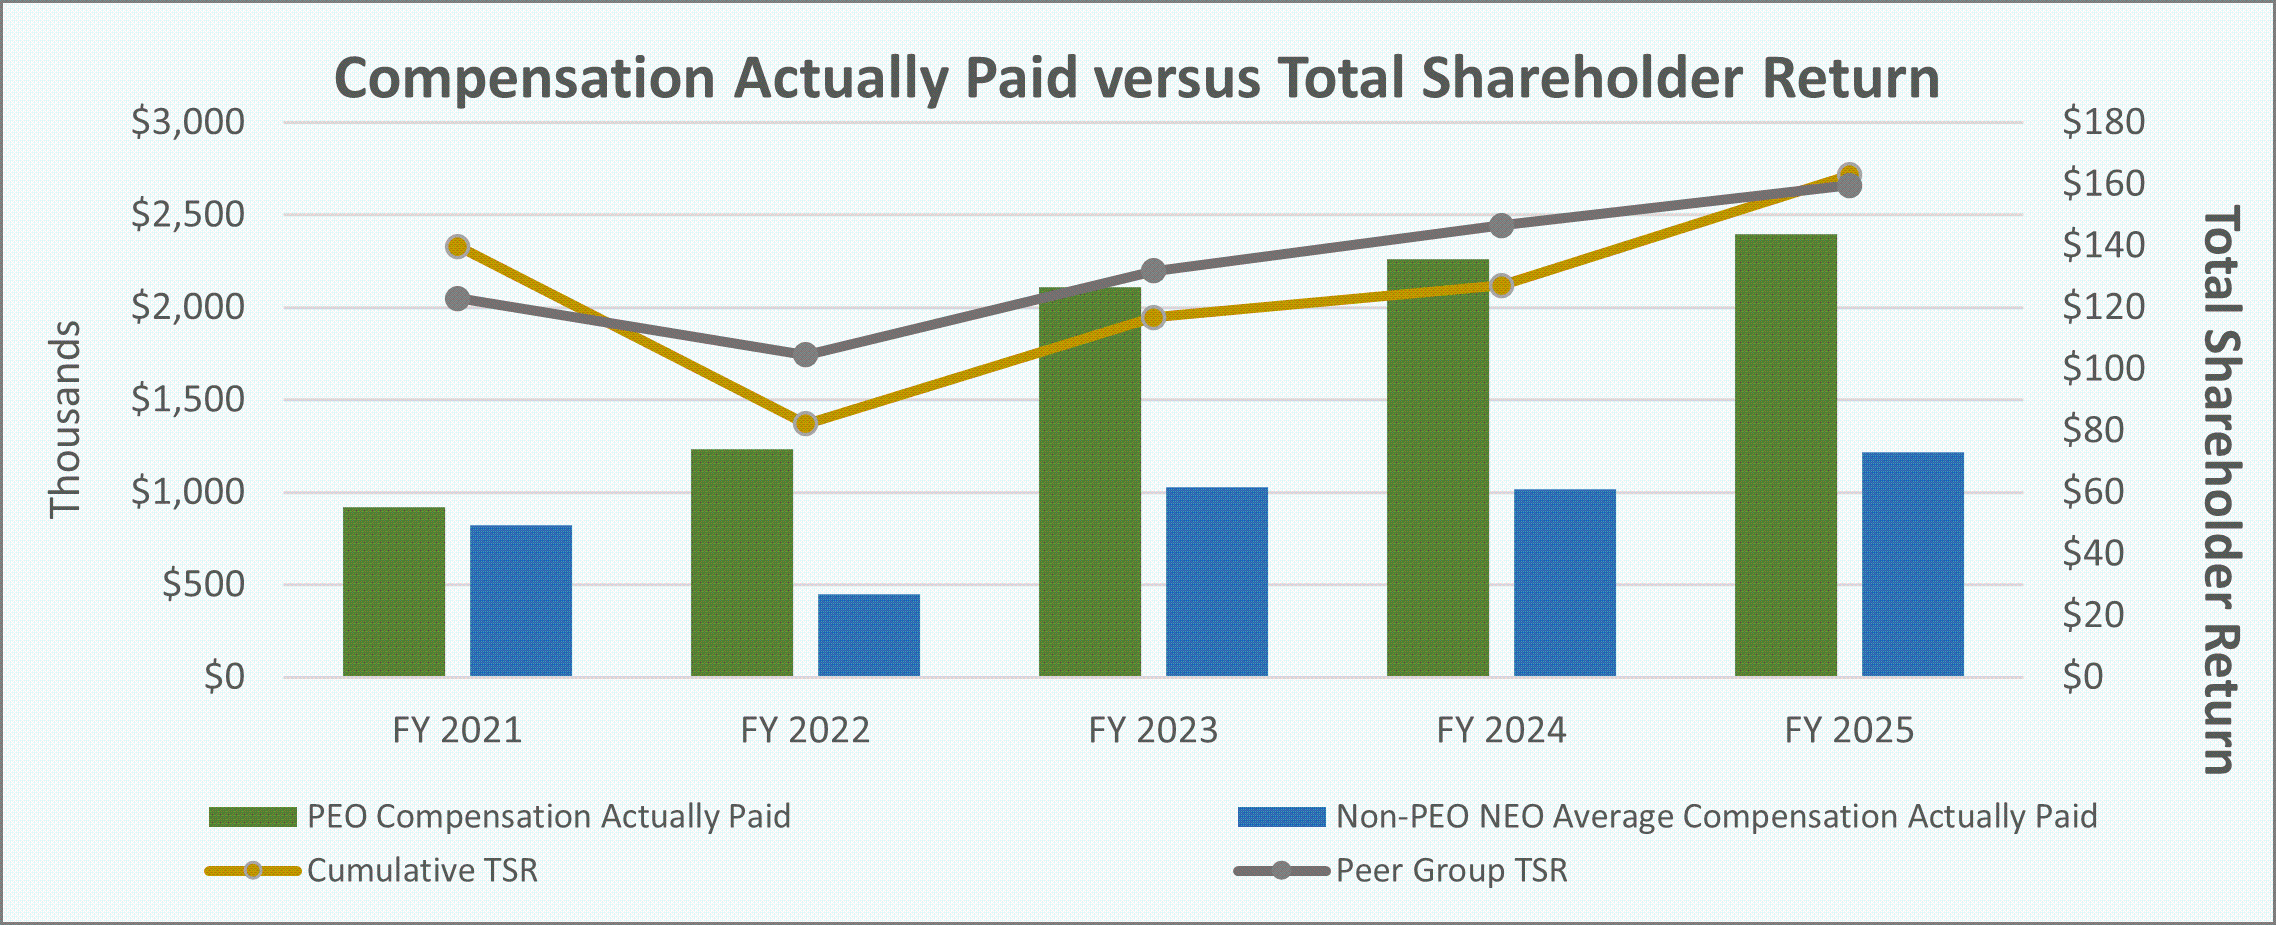
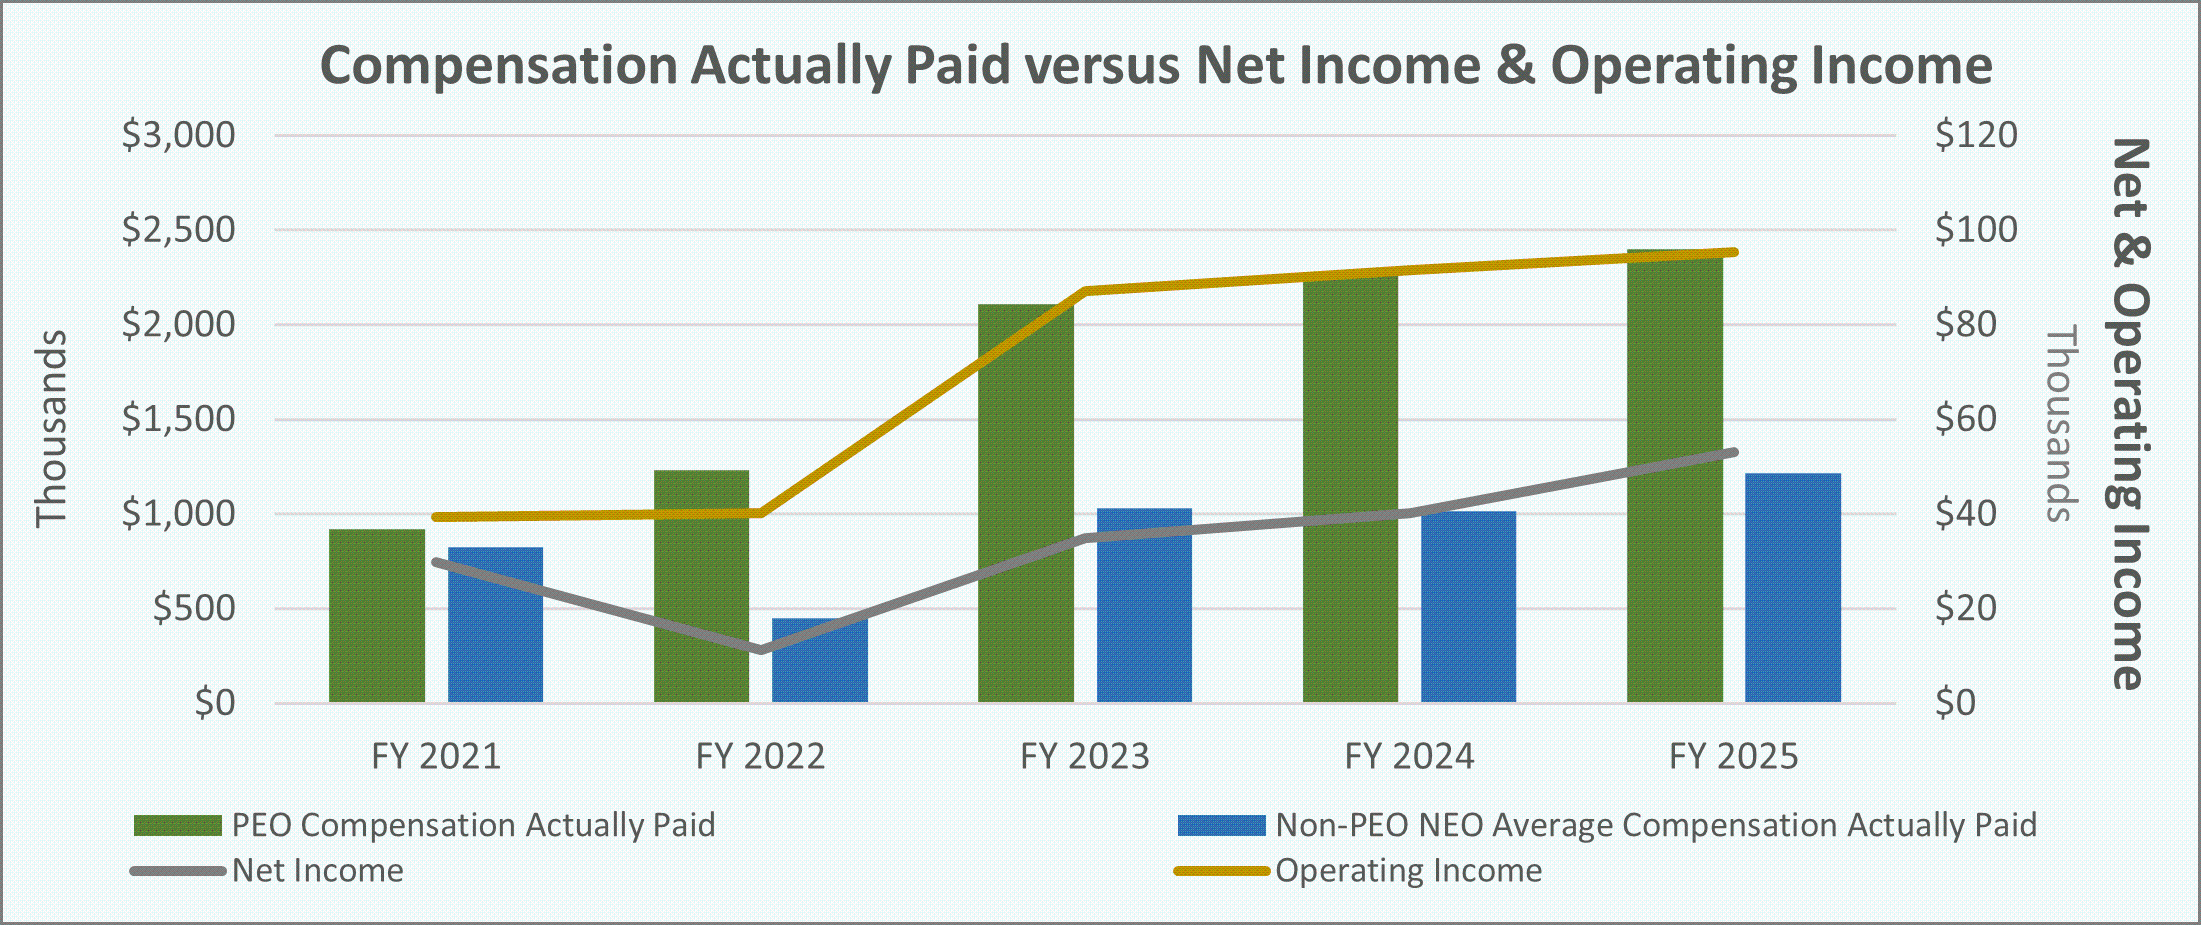
The following table summarizes compensation paid to the Company’s principal executive officer (“PEO”) as set forth in the Summary Compensation Table, compensation actually paid to the PEO, average compensation paid to the Company’s Non-PEO named executive officers ("NEOs”) as set forth in the Summary Compensation Table, and average compensation actually paid to the Company’s Non-PEO NEOs, each as calculated in accordance with SEC rules, and certain Company and peer group performance measures for the periods indicated:
|
|
|
|
|
|
|
|
|
|
|
|
|
|
|
|
|
|
|
|
|
|
|
Value of Initial Fixed $100 Investment Based on (3): |
|
|
|
|
000’s |
|
||||||||||||||||||
|
|
|
|
|
|
|
|
|
|
|
|
|
|
|
|
|
|
|
|
|
|
|
|
|
|
|
|
|
|
|
|
|
|
|
|
|
|
|
|
||||||||
Year |
|
Summary |
|
Compensation Actually Paid to PEO ($) (2) |
|
Average Summary Compensation Table Total for Non-PEO NEOs ($)(1) |
|
Average Compensation Actually Paid to Non-PEO NEOs ($)(2) |
|
Total |
|
Peer Group |
|
Net |
|
Operating |
|
||||||||||||||||||||||||||||||
|
|
|
|
|
|
|
|
|
|
|
|
|
|
|
|
|
|
|
|
|
|
|
|
|
|
|
|
|
|
|
|
|
|
|
|
|
|
|
|
||||||||
2025 |
|
|
|
2,187,652 |
|
|
|
|
|
2,397,455 |
|
|
|
|
|
1,088,477 |
|
|
|
|
|
1,215,324 |
|
|
|
|
|
163.00 |
|
|
|
|
|
159.55 |
|
|
|
|
|
53,017 |
|
|
|
|
|
95,363 |
|
2024 |
|
|
|
1,954,761 |
|
|
|
|
|
2,259,586 |
|
|
|
|
|
941,974 |
|
|
|
|
|
1,014,820 |
|
|
|
|
|
127.10 |
|
|
|
|
|
146.60 |
|
|
|
|
|
40,115 |
|
|
|
|
|
91,443 |
|
2023 |
|
|
|
1,707,848 |
|
|
|
|
|
2,109,366 |
|
|
|
|
|
894,343 |
|
|
|
|
|
1,029,150 |
|
|
|
|
|
116.78 |
|
|
|
|
|
131.90 |
|
|
|
|
|
34,951 |
|
|
|
|
|
87,041 |
|
2022 |
|
|
|
1,712,818 |
|
|
|
|
|
1,231,468 |
|
|
|
|
|
781,145 |
|
|
|
|
|
450,930 |
|
|
|
|
|
82.17 |
|
|
|
|
|
104.62 |
|
|
|
|
|
11,195 |
|
|
|
|
|
40,183 |
|
2021 |
|
|
|
1,078,110 |
|
|
|
|
|
920,864 |
|
|
|
|
|
835,208 |
|
|
|
|
|
823,730 |
|
|
|
|
|
139.69 |
|
|
|
|
|
122.96 |
|
|
|
|
|
29,851 |
|
|
|
|
|
39,356 |
|
Reconciliation of Actual Compensation Paid
The following table reconciles the PEO Summary Compensation Table total and the Non-PEO NEOs average Summary Compensation Table total to PEO Compensation Actually Paid and NEOs average Compensation Actually Paid for the periods indicated:
|
|
|
|
|
|
|
|
Increase (Decrease) in Value of |
|
|
|
|
|
|
|
|
|
|
|
|
|
|
|
|
|||||||||||||||||
|
|
|
|
|
|
|
|
|
|
|
|
|
|
|
|
|
|
|
|
|
|
|
|
|
|||||||||||||||||
|
|
Total |
|
Current Year |
|
Prior Year |
|
Grants |
|
Grants from |
|
Change in |
|
Compensation |
|
||||||||||||||||||||||||||
|
|
|
|
|
|
|
|
|
|
|
|
|
|
|
|
|
|
|
|
|
|
|
|
|
|
|
|
|
|
|
|
|
|
|
|||||||
PEO |
|
|
|
|
|
|
|
|
|
|
|
|
|
|
|
|
|
|
|
|
|
|
|
|
|
|
|
|
|
|
|
|
|
|
|||||||
2025 |
|
|
|
2,187,652 |
|
|
|
|
|
174,345 |
|
|
|
|
|
283,236 |
|
|
|
|
|
962 |
|
|
|
|
|
(183,750 |
) |
|
|
|
|
(64,990 |
) |
|
|
|
|
2,397,455 |
|
2024 |
|
|
|
1,954,761 |
|
|
|
|
|
28,616 |
|
|
|
|
|
269,916 |
|
|
|
|
|
6,467 |
|
|
|
|
|
- |
|
|
|
|
|
(173 |
) |
|
|
|
|
2,259,586 |
|
2023 |
|
|
|
1,707,848 |
|
|
|
|
|
120,887 |
|
|
|
|
|
276,954 |
|
|
|
|
|
44,399 |
|
|
|
|
|
- |
|
|
|
|
|
(40,722 |
) |
|
|
|
|
2,109,366 |
|
2022 |
|
|
|
1,712,818 |
|
|
|
|
|
(242,563 |
) |
|
|
|
|
(126,506 |
) |
|
|
|
|
- |
|
|
|
|
|
(148,648 |
) |
|
|
|
|
36,367 |
|
|
|
|
|
1,231,468 |
|
2021 |
|
|
|
1,078,110 |
|
|
|
|
|
82,833 |
|
|
|
|
|
72,757 |
|
|
|
|
|
766 |
|
|
|
|
|
(188,535 |
) |
|
|
|
|
(125,067 |
) |
|
|
|
|
920,864 |
|
NEO Average |
|
|
|
|
|
|
|
|
|
|
|
|
|
|
|
|
|
|
|
|
|
|
|
|
|
|
|
|
|
|
|
|
|
|
|||||||
2025 |
|
|
|
1,088,477 |
|
|
|
|
|
66,829 |
|
|
|
|
|
149,093 |
|
|
|
|
|
497 |
|
|
|
|
|
(89,572 |
) |
|
|
|
|
- |
|
|
|
|
|
1,215,324 |
|
2024 |
|
|
|
941,974 |
|
|
|
|
|
8,191 |
|
|
|
|
|
108,045 |
|
|
|
|
|
1,156 |
|
|
|
|
|
- |
|
|
|
|
|
(44,546 |
) |
|
|
|
|
1,014,820 |
|
2023 |
|
|
|
894,343 |
|
|
|
|
|
42,301 |
|
|
|
|
|
102,519 |
|
|
|
|
|
31,857 |
|
|
|
|
|
- |
|
|
|
|
|
(41,870 |
) |
|
|
|
|
1,029,150 |
|
2022 |
|
|
|
781,145 |
|
|
|
|
|
(59,617 |
) |
|
|
|
|
(121,939 |
) |
|
|
|
|
- |
|
|
|
|
|
(148,659 |
) |
|
|
|
|
- |
|
|
|
|
|
450,930 |
|
2021 |
|
|
|
835,208 |
|
|
|
|
|
63,501 |
|
|
|
|
|
48,497 |
|
|
|
|
|
447 |
|
|
|
|
|
(125,679 |
) |
|
|
|
|
1,757 |
|
|
|
|
|
823,730 |
|
|
|
12/31/25 |
|
12/31/24 |
|
12/31/23 |
|
12/31/22 |
|
12/31/21 |
|
|
|
|
|
|
|
|
|
|
|
Closing Share Price |
|
$47.75 |
|
$37.92 |
|
$35.53 |
|
$25.62 |
|
$44.55 |
Reconciliation of Actual Compensation Paid
The following table reconciles the PEO Summary Compensation Table total and the Non-PEO NEOs average Summary Compensation Table total to PEO Compensation Actually Paid and NEOs average Compensation Actually Paid for the periods indicated:
|
|
|
|
|
|
|
|
Increase (Decrease) in Value of |
|
|
|
|
|
|
|
|
|
|
|
|
|
|
|
|
|||||||||||||||||
|
|
|
|
|
|
|
|
|
|
|
|
|
|
|
|
|
|
|
|
|
|
|
|
|
|||||||||||||||||
|
|
Total |
|
Current Year |
|
Prior Year |
|
Grants |
|
Grants from |
|
Change in |
|
Compensation |
|
||||||||||||||||||||||||||
|
|
|
|
|
|
|
|
|
|
|
|
|
|
|
|
|
|
|
|
|
|
|
|
|
|
|
|
|
|
|
|
|
|
|
|||||||
PEO |
|
|
|
|
|
|
|
|
|
|
|
|
|
|
|
|
|
|
|
|
|
|
|
|
|
|
|
|
|
|
|
|
|
|
|||||||
2025 |
|
|
|
2,187,652 |
|
|
|
|
|
174,345 |
|
|
|
|
|
283,236 |
|
|
|
|
|
962 |
|
|
|
|
|
(183,750 |
) |
|
|
|
|
(64,990 |
) |
|
|
|
|
2,397,455 |
|
2024 |
|
|
|
1,954,761 |
|
|
|
|
|
28,616 |
|
|
|
|
|
269,916 |
|
|
|
|
|
6,467 |
|
|
|
|
|
- |
|
|
|
|
|
(173 |
) |
|
|
|
|
2,259,586 |
|
2023 |
|
|
|
1,707,848 |
|
|
|
|
|
120,887 |
|
|
|
|
|
276,954 |
|
|
|
|
|
44,399 |
|
|
|
|
|
- |
|
|
|
|
|
(40,722 |
) |
|
|
|
|
2,109,366 |
|
2022 |
|
|
|
1,712,818 |
|
|
|
|
|
(242,563 |
) |
|
|
|
|
(126,506 |
) |
|
|
|
|
- |
|
|
|
|
|
(148,648 |
) |
|
|
|
|
36,367 |
|
|
|
|
|
1,231,468 |
|
2021 |
|
|
|
1,078,110 |
|
|
|
|
|
82,833 |
|
|
|
|
|
72,757 |
|
|
|
|
|
766 |
|
|
|
|
|
(188,535 |
) |
|
|
|
|
(125,067 |
) |
|
|
|
|
920,864 |
|
NEO Average |
|
|
|
|
|
|
|
|
|
|
|
|
|
|
|
|
|
|
|
|
|
|
|
|
|
|
|
|
|
|
|
|
|
|
|||||||
2025 |
|
|
|
1,088,477 |
|
|
|
|
|
66,829 |
|
|
|
|
|
149,093 |
|
|
|
|
|
497 |
|
|
|
|
|
(89,572 |
) |
|
|
|
|
- |
|
|
|
|
|
1,215,324 |
|
2024 |
|
|
|
941,974 |
|
|
|
|
|
8,191 |
|
|
|
|
|
108,045 |
|
|
|
|
|
1,156 |
|
|
|
|
|
- |
|
|
|
|
|
(44,546 |
) |
|
|
|
|
1,014,820 |
|
2023 |
|
|
|
894,343 |
|
|
|
|
|
42,301 |
|
|
|
|
|
102,519 |
|
|
|
|
|
31,857 |
|
|
|
|
|
- |
|
|
|
|
|
(41,870 |
) |
|
|
|
|
1,029,150 |
|
2022 |
|
|
|
781,145 |
|
|
|
|
|
(59,617 |
) |
|
|
|
|
(121,939 |
) |
|
|
|
|
- |
|
|
|
|
|
(148,659 |
) |
|
|
|
|
- |
|
|
|
|
|
450,930 |
|
2021 |
|
|
|
835,208 |
|
|
|
|
|
63,501 |
|
|
|
|
|
48,497 |
|
|
|
|
|
447 |
|
|
|
|
|
(125,679 |
) |
|
|
|
|
1,757 |
|
|
|
|
|
823,730 |
|
The three items listed below are, in the Company’s assessment, the most important financial performance measures used by the Company to link Compensation Actually Paid for 2025 to Company performance: