Pay vs Performance Disclosure - USD ($)
Dec. 31, 2025
Dec. 31, 2024
Dec. 31, 2023
Dec. 31, 2022
Dec. 31, 2021
Pay versus performance table
The company’s compensation philosophy is to pay for performance over the long- and short-term taking into consideration a approach bases compensation on actual results and how those results were achieved. We align executive and shareholder interests through a compensation program providing a mix of salary, incentives, and benefits paid over time, including deferred equity-based awards. Review our “Compensation discussion
range
of factors, including both financial and non-financial
performance measures. Our pay-for-performance
and
analysis” starting on page 42 for more information on executive compensation considerations and decisions for our NEOs. Page 53 of the “Compensation discussion and analysis” includes 2025 compensation decisions for our NEOs; these decisions are different than those reflected in the table below which are calculated under prescribed SEC rules. The table below shows the following information for the past five fiscal years: (i) “total” compensation for our NEOs for purposes of the “Summary compensation table”; (ii) the “Compensation actually paid” to NEOs (calculated using rules required by the SEC); (iii) our total shareholder return (TSR); (iv) the TSR of the KBW Bank Index; (v) our net income; and (vi) our revenue (which is our “company-selected performance measure”). “Compensation actually paid” does not represent the value of cash and shares of the company’s common stock received by NEOs during the year, but rather is an amount calculated under SEC rules and includes, among other things, year-over-year changes in the value of unvested equity-based awards. As a result of the calculation methodology required by the SEC, “Compensation actually paid” amounts below differ from compensation actually received by the individuals and the compensation decisions described in the “Compensation discussion and analysis” section above.
2025 Pay versus performance table
“Summary compensation table” total for CEO (1) ($) |
Compensation actually paid to CEO (2) ($) |
Average “Summary compensation table” total for non-CEO NEOs (1) ($) |
Average compensation actually paid to non-CEO NEOs (2) ($) |
Company TSR (3) ($) |
Peer group TSR (3) ($) |
Net income ($ in millions) |
Revenue (4) ($ in millions) | |||||||||||||||||||||||||||||||||
2025 |
33,711,521 | 53,507,725 | 20,199,081 | 30,992,675 | 205 | 196 | 30,509 | 113,097 | ||||||||||||||||||||||||||||||||
2024 (5) |
28,738,702 | 47,777,368 | 16,477,980 | 26,304,042 | 160 | 148 | 26,973 | 105,856 | ||||||||||||||||||||||||||||||||
2023 (5) |
28,571,192 | 32,139,080 | 14,135,415 | 15,797,000 | 119 | 108 | 26,305 | 102,769 | ||||||||||||||||||||||||||||||||
2022 |
30,177,503 | 11,009,642 | 18,641,262 | 11,731,112 | 114 | 109 | 27,528 | 94,950 | ||||||||||||||||||||||||||||||||
2021 |
23,729,169 | 49,888,896 | 16,930,383 | 29,568,322 | 150 | 138 | 31,978 | 89,113 | ||||||||||||||||||||||||||||||||
| (1) | The CEO for each year reported was Brian T. Moynihan. The other NEOs, or Non-CEO NEOs, for each year reported are as follows: |
• |
2025 & 2024 & 2023: Alastair M. Borthwick; Dean C. Athanasia; James P. DeMare; and Matthew M. Koder |
• |
2022: Alastair M. Borthwick; Dean C. Athanasia; Paul M. Donofrio; and Geoffrey S. Greener |
• |
2021: Alastair M. Borthwick; Paul M. Donofrio; James P. DeMare; Matthew M. Koder; and Thomas K. Montag |
| (2) | SEC rules require certain adjustments be made to the “Summary compensation table” totals to determine “compensation actually paid” as reported in the “Pay versus performance table” above. For purposes of the pension valuation adjustments shown below, there was no pension service or prior service cost. In addition, for purposes of the equity award adjustments shown below, no equity awards were canceled due to a failure to meet vesting conditions. The following table details the applicable adjustments that were made to determine “compensation actually paid” (all amounts are averages for the NEOs other than the CEO) for 2025. See the “Pay versus performance table” on page 78 in the 2025 proxy statement, page 86 in the 2024 proxy statement and page 80 in the 2023 proxy statement for the adjustments made to determine “compensation actually paid” for prior years: |
Year |
Executive(s) |
Summary compensation table total ($) |
Pension valuation adjustments |
Equity award adjustments |
||||||||||||||||||||||||||||||||||||||||||||||||
Deduct change in pension value ($) |
Deduct grant date value of stock awards granted in the year ($) |
Add year-end value of unvested equity awards granted in the year ($) |
Change in value of unvested equity awards granted in prior years ($) |
Change in value of equity awards granted in prior years which vested in year ($) |
Change in value of equity awards granted and vested in year ($) |
Add dividends & interest accrued ($) |
Compensation actually paid total ($) | |||||||||||||||||||||||||||||||||||||||||||||
2025 |
CEO |
33,711,521 | (972,981) | (30,666,747) | 26,497,679 | 13,483,178 | 1,255,320 | 8,431,370 | 1,768,385 | 53,507,725 | ||||||||||||||||||||||||||||||||||||||||||
Non-CEO NEOs |
20,199,081 | (3,827) | (12,012,238) | 14,264,819 | 6,905,292 | 686,004 | 0 | 953,544 | 30,992,675 | |||||||||||||||||||||||||||||||||||||||||||
| (3) | TSR is determined based on the value of an initial fixed investment of $100 on December 31, 2020. The peer group TSR represents TSR of the KBW Bank Index. |
| (4) | Represents total revenue, net of interest expense. |
| (5) | Effective in the fourth quarter of 2025 and as previously disclosed in our Form 8-K dated January 6, 2026, the company elected to change its accounting methods related to its tax-related affordable housing, eligible wind renewable energy and solar renewable energy equity investments. This resulted in revisions to our reported revenue and net income for fiscal years 2024 and 2023 (there were no such revisions for fiscal years 2022 and 2021, as these periods were not presented in our fiscal year 2025 annual report on our Form 10-K). This 2025 Pay versus performance table and the chart below reflect revenue and net income for fiscal years 2024 and 2023 as reported in our fiscal year 2025 annual report on our Form 10-K. The company has not revised the compensation amounts previously reported for such years. |
| (1) | The CEO for each year reported was Brian T. Moynihan. The other NEOs, or Non-CEO NEOs, for each year reported are as follows: |
• |
2025 & 2024 & 2023: Alastair M. Borthwick; Dean C. Athanasia; James P. DeMare; and Matthew M. Koder |
• |
2022: Alastair M. Borthwick; Dean C. Athanasia; Paul M. Donofrio; and Geoffrey S. Greener |
• |
2021: Alastair M. Borthwick; Paul M. Donofrio; James P. DeMare; Matthew M. Koder; and Thomas K. Montag |
| (2) | SEC rules require certain adjustments be made to the “Summary compensation table” totals to determine “compensation actually paid” as reported in the “Pay versus performance table” above. For purposes of the pension valuation adjustments shown below, there was no pension service or prior service cost. In addition, for purposes of the equity award adjustments shown below, no equity awards were canceled due to a failure to meet vesting conditions. The following table details the applicable adjustments that were made to determine “compensation actually paid” (all amounts are averages for the NEOs other than the CEO) for 2025. See the “Pay versus performance table” on page 78 in the 2025 proxy statement, page 86 in the 2024 proxy statement and page 80 in the 2023 proxy statement for the adjustments made to determine “compensation actually paid” for prior years: |
Year |
Executive(s) |
Summary compensation table total ($) |
Pension valuation adjustments |
Equity award adjustments |
||||||||||||||||||||||||||||||||||||||||||||||||
Deduct change in pension value ($) |
Deduct grant date value of stock awards granted in the year ($) |
Add year-end value of unvested equity awards granted in the year ($) |
Change in value of unvested equity awards granted in prior years ($) |
Change in value of equity awards granted in prior years which vested in year ($) |
Change in value of equity awards granted and vested in year ($) |
Add dividends & interest accrued ($) |
Compensation actually paid total ($) | |||||||||||||||||||||||||||||||||||||||||||||
2025 |
CEO |
33,711,521 | (972,981) | (30,666,747) | 26,497,679 | 13,483,178 | 1,255,320 | 8,431,370 | 1,768,385 | 53,507,725 | ||||||||||||||||||||||||||||||||||||||||||
Non-CEO NEOs |
20,199,081 | (3,827) | (12,012,238) | 14,264,819 | 6,905,292 | 686,004 | 0 | 953,544 | 30,992,675 | |||||||||||||||||||||||||||||||||||||||||||
The chart below highlights the alignment between “compensation actually paid” to our NEOs and our TSR performance and net income for
the
past five fiscal years. 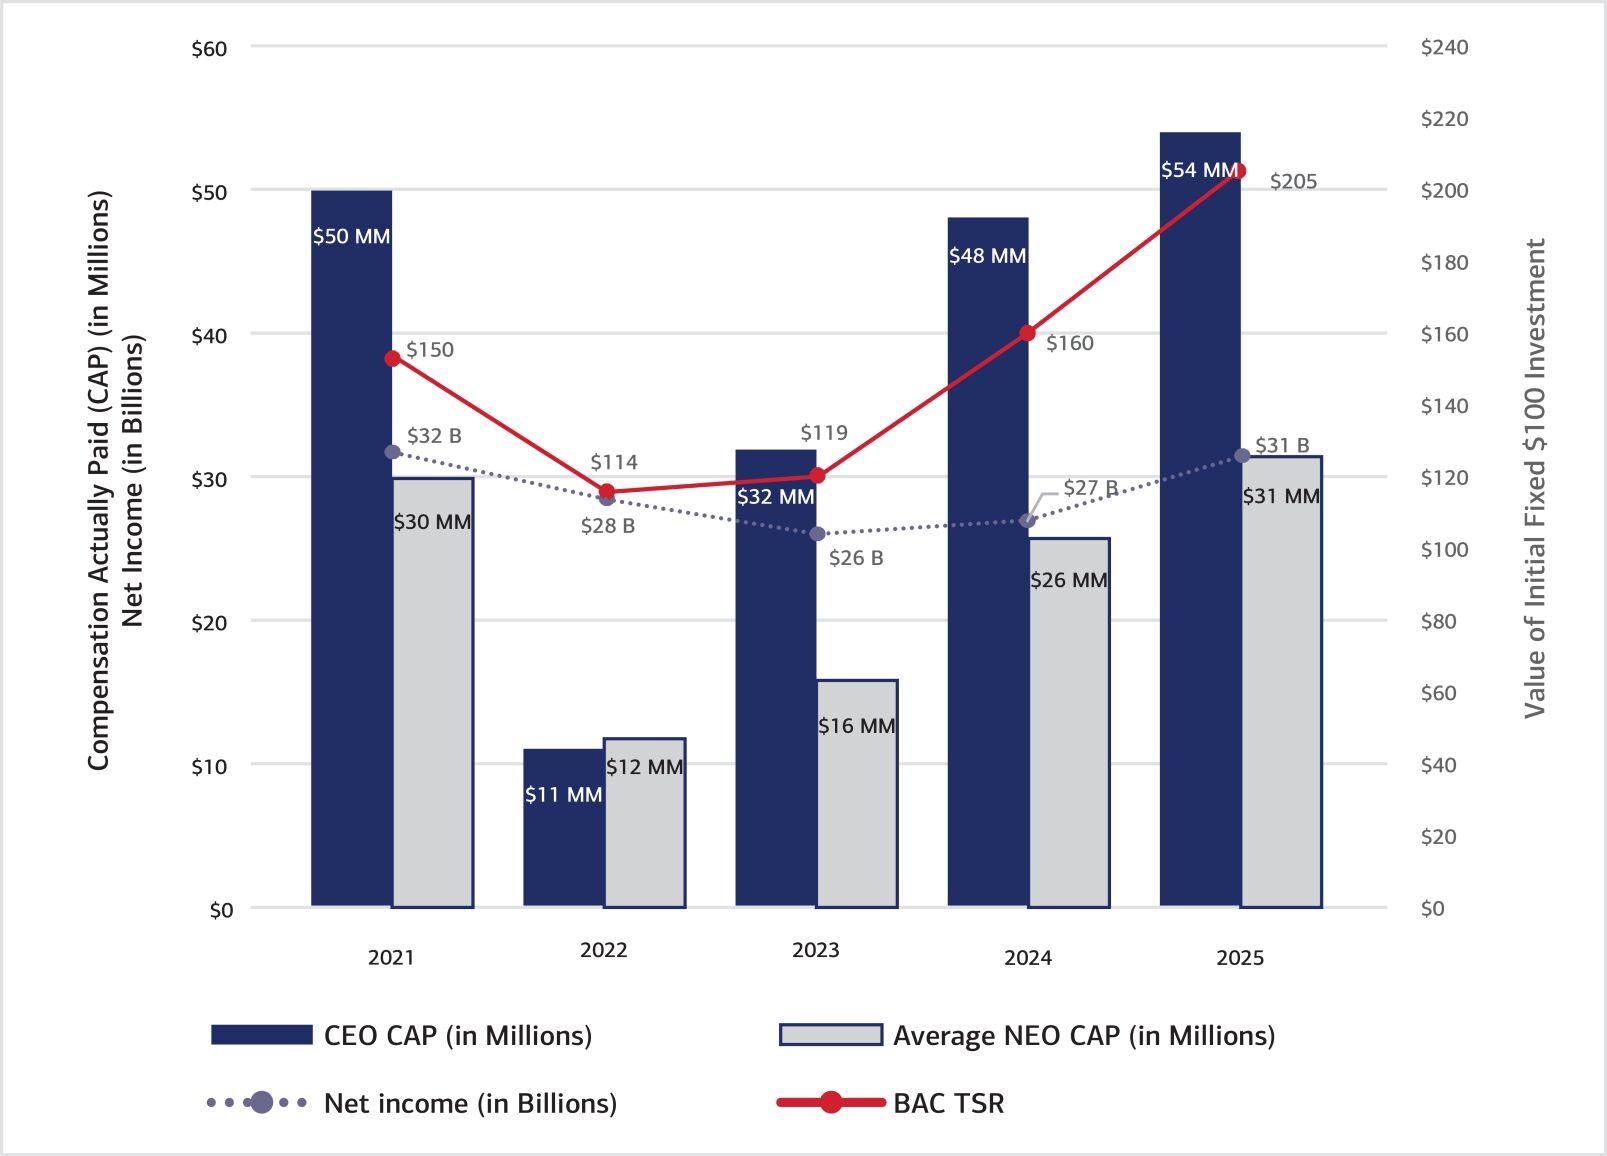
The chart below highlights the alignment between “compensation actually paid” to our NEOs and our TSR performance and net income for
the
past five fiscal years. Net Income
Revenue
Total Shareholder Return
Return on Assets
Return on Tangible Common Equity
Tangible Book Value*
| * | Tangible book value per common share represents ending tangible common shareholders’ equity divided by ending common shares outstanding. |