Exhibit 99.3

New Afton Operations
British Columbia, Canada
Technical Report Summary
|
Prepared for:
Coeur Mining, Inc.
Report current as at:
31 December, 2025
|
Prepared by:
Mr. Tyler Roberts, P.Eng.
Mr. Devin Wade, P.Geo.
Ms. Jennifer Katchen, P.Eng.
Mr. Vincent Nadeau-Benoit, P.Geo.
Mr. Matthew Davis, P.Eng.
Ms. Emily O’Hara, P.Eng.
|
 |
New Afton Operations
British Columbia
Technical Report Summary
|
Date and Signature Page
The following Qualified Persons, who are employees of Coeur Mining, Inc. or its subsidiaries, prepared this technical report summary, entitled “New Afton Operations, British Columbia, Technical
Report Summary” and confirm that the information in the technical report summary is current as at 31 December, 2025.
“Signed”
Mr. Tyler Roberts, P.Eng.
“Signed”
Mr. Devin Wade, P.Geo.
“Signed”
Ms. Jennifer Katchen, P.Eng.
“Signed”
Mr. Vincent Nadeau-Benoit, P.Geo.
“Signed”
Mr. Matthew Davis, P.Eng.
“Signed”
Ms. Emily O’Hara, P.Eng.
|
New Afton Operations
British Columbia
Technical Report Summary
|
CONTENTS
|
1.0
|
EXECUTIVE SUMMARY
|
1-1
|
|
1.1
|
Introduction
|
1-1
|
|
1.2
|
Terms of Reference
|
1-1
|
|
1.3
|
Property Setting
|
1-1
|
|
1.4
|
Mineral Tenure, Surface Rights, Water Rights, Royalties and Agreements
|
1-2
|
|
1.5
|
Geology and Mineralization
|
1-3
|
|
1.6
|
History and Exploration
|
1-3
|
|
1.7
|
Drilling and Sampling
|
1-3
|
|
1.8
|
Data Verification
|
1-4
|
|
1.9
|
Metallurgical Testwork
|
1-4
|
|
1.10
|
Mineral Resource Estimation
|
1-5
|
|
1.10.1
|
Estimation Methodology
|
1-5
|
|
1.10.2
|
Mineral Resource Statement
|
1-6
|
|
1.10.3
|
Factors That May Affect the Mineral Resource Estimate
|
1-6
|
|
1.11
|
Mineral Reserve Estimation
|
1-8
|
|
1.11.1
|
Estimation Methodology
|
1-8
|
|
1.11.2
|
Mineral Reserve Statement
|
1-8
|
|
1.11.3
|
Factors That May Affect the Mineral Reserve Estimate
|
1-8
|
|
1.12
|
Mining Methods
|
1-9
|
|
1.13
|
Recovery Methods
|
1-11
|
|
1.14
|
Infrastructure
|
1-11
|
|
1.15
|
Markets and Contracts
|
1-12
|
|
1.15.1
|
Market Studies
|
1-12
|
|
1.15.2
|
Commodity Prices
|
1-13
|
|
1.15.3
|
Contracts
|
1-13
|
|
1.16
|
Environmental, Permitting and Social Considerations
|
1-13
|
|
1.16.1
|
Environmental Studies and Monitoring
|
1-13
|
|
1.16.2
|
Closure and Reclamation Considerations
|
1-14
|
|
1.16.3
|
Permitting
|
1-14
|
|
1.16.4
|
Social Considerations, Plans, Negotiations and Agreements
|
1-14
|
|
1.17
|
Capital Cost Estimates
|
1-14
|
|
1.18
|
Operating Cost Estimates
|
1-15
|
|
1.19
|
Economic Analysis
|
1-16
|
|
1.19.1
|
Forward-Looking Information
|
1-16
|
|
1.19.2
|
Methodology and Assumptions
|
1-17
|
|
1.19.3
|
Economic Analysis
|
1-17
|
|
1.19.4
|
Sensitivity Analysis
|
1-19
|
|
1.20
|
Risks and Opportunities
|
1-19
|
|
1.20.1
|
Risks
|
1-19
|
|
1.20.2
|
Opportunities
|
1-19
|
|
1.21
|
Conclusions
|
1-20
|
|
1.22
|
Recommendations
|
1-20
|
|
2.0
|
INTRODUCTION
|
2-1
|
|
2.1
|
Registrant
|
2-1
|
|
2.2
|
Terms of Reference
|
2-1
|
|
2.2.1
|
Report Purpose
|
2-1
|
|
2.2.2
|
Terms of Reference
|
2-1
|
|
New Afton Operations
British Columbia
Technical Report Summary
|
|
2.3
|
Qualified Persons
|
2-3
|
|
2.4
|
Site Visits and Scope of Personal Inspection
|
2-3
|
|
2.4.1
|
Mr. Tyler Roberts
|
2-3
|
|
2.4.2
|
Mr. Devin Wade
|
2-3
|
|
2.4.3
|
Ms. Jennifer Katchen
|
2-3
|
|
2.4.4
|
Mr. Vincent Nadeau-Benoit
|
2-4
|
|
2.4.5
|
Mr. Matthew Davis
|
2-5
|
|
2.4.6
|
Ms. Emily O’Hara
|
2-5
|
|
2.5
|
Report Date
|
2-5
|
|
2.6
|
Information Sources and References
|
2-5
|
|
2.7
|
Previous Technical Report Summaries
|
2-5
|
|
3.0
|
PROPERTY DESCRIPTION
|
3-1
|
|
3.1
|
Property Location
|
3-1
|
|
3.2
|
Ownership
|
3-1
|
|
3.3
|
Mineral Title
|
3-1
|
|
3.3.1
|
Tenure Holdings
|
3-1
|
|
3.3.2
|
Tenure Maintenance Requirements
|
3-8
|
|
3.4
|
Surface Rights
|
3-8
|
|
3.5
|
Water Rights
|
3-8
|
|
3.6
|
Royalties
|
3-8
|
|
3.7
|
Agreements
|
3-12
|
|
3.8
|
Encumbrances
|
3-12
|
|
3.8.1
|
Permitting Requirements
|
3-12
|
|
3.8.2
|
Permitting Timelines
|
3-12
|
|
3.8.3
|
Violations and Fines
|
3-12
|
|
3.9
|
Significant Factors and Risks That May Affect Access, Title or Work Programs
|
3-12
|
|
4.0
|
ACCESSIBILITY, CLIMATE, LOCAL RESOURCES, INFRASTRUCTURE AND PHYSIOGRAPHY
|
4-1
|
|
4.1
|
Physiography
|
4-1
|
|
4.2
|
Accessibility
|
4-1
|
|
4.3
|
Climate
|
4-1
|
|
4.4
|
Infrastructure
|
4-1
|
|
5.0
|
HISTORY
|
5-1
|
|
6.0
|
GEOLOGICAL SETTING, MINERALIZATION, AND DEPOSIT
|
6-1
|
|
6.1
|
Deposit Type
|
6-1
|
|
6.2
|
Regional Geology
|
6-1
|
|
6.3
|
Local Geology
|
6-3
|
|
6.3.1
|
Lithological Units
|
6-3
|
|
6.3.2
|
Structure
|
6-3
|
|
6.3.3
|
Metamorphism
|
6-3
|
|
6.3.4
|
Mineralization
|
6-3
|
|
6.4
|
Property Geology
|
6-8
|
|
6.4.1
|
Deposit Dimensions
|
6-8
|
|
6.4.2
|
Lithological Units
|
6-8
|
|
6.4.3
|
Structure
|
6-8
|
|
6.4.4
|
Alteration
|
6-8
|
|
6.4.5
|
Mineralization
|
6-11
|
|
7.0
|
EXPLORATION
|
7-1
|
|
7.1
|
Exploration
|
7-1
|
|
7.1.1
|
Grids and Surveys
|
7-1
|
|
7.1.2
|
Geological Mapping
|
7-1
|
|
New Afton Operations
British Columbia
Technical Report Summary
|
|
7.1.3
|
Geochemistry
|
7-1
|
|
7.1.4
|
Geophysics
|
7-1
|
|
7.1.5
|
Exploration Drifts
|
7-5
|
|
7.1.6
|
Other Studies
|
7-5
|
|
7.1.7
|
Qualified Person’s Interpretation of the Exploration Information
|
7-5
|
|
7.1.8
|
Exploration Potential
|
7-5
|
|
7.2
|
Drilling
|
7-7
|
|
7.2.1
|
Overview
|
7-7
|
|
7.2.2
|
Drill Methods
|
7-7
|
|
7.2.3
|
Logging
|
7-7
|
|
7.2.4
|
Recovery
|
7-13
|
|
7.2.5
|
Collar Surveys
|
7-13
|
|
7.2.6
|
Down Hole Surveys
|
7-13
|
|
7.2.7
|
Drilling Since Database Close-out Date
|
7-13
|
|
7.2.8
|
Comment on Material Results and Interpretation
|
7-14
|
|
7.3
|
Hydrogeology
|
7-14
|
|
7.3.1
|
Sampling Methods and Laboratory Determinations
|
7-14
|
|
7.3.2
|
Comment on Results
|
7-14
|
|
7.3.3
|
Surface Water
|
7-15
|
|
7.3.4
|
Groundwater
|
7-15
|
|
7.4
|
Geotechnical
|
7-16
|
|
7.4.1
|
Sampling Methods and Laboratory Determinations
|
7-17
|
|
7.4.2
|
In Situ Rock Mass Stress
|
7-18
|
|
7.4.3
|
Comment on Results
|
7-18
|
|
8.0
|
SAMPLE PREPARATION, ANALYSES, AND SECURITY
|
8-1
|
|
8.1
|
Sampling Methods
|
8-1
|
|
8.2
|
Sample Security Methods
|
8-1
|
|
8.3
|
Density Determinations
|
8-1
|
|
8.4
|
Analytical and Test Laboratories
|
8-2
|
|
8.5
|
Sample Preparation
|
8-2
|
|
8.6
|
Analysis
|
8-2
|
|
8.7
|
Quality Assurance and Quality Control
|
8-3
|
|
8.8
|
Database
|
8-4
|
|
8.9
|
Qualified Person’s Opinion on Sample Preparation, Security, and Analytical Procedures
|
8-5
|
|
9.0
|
DATA VERIFICATION
|
9-1
|
|
9.1
|
Internal Data Verification
|
9-1
|
|
9.2
|
External Data Verification
|
9-1
|
|
9.3
|
Data Verification by Qualified Person
|
9-2
|
|
9.3.1
|
Mr. Nadeau-Benoit
|
9-2
|
|
9.3.2
|
Mr. Roberts
|
9-2
|
|
9.4
|
Qualified Person’s Opinion on Data Adequacy
|
9-3
|
|
10.0
|
MINERAL PROCESSING AND METALLURGICAL TESTING
|
10-1
|
|
10.1
|
Test Laboratories
|
10-1
|
|
10.2
|
Metallurgical Testwork
|
10-1
|
|
10.2.1
|
C-Zone
|
10-1
|
|
10.2.2
|
East Extension
|
10-3
|
|
10.2.3
|
D-Zone
|
10-3
|
|
10.2.4
|
K-Zone
|
10-4
|
|
10.2.5
|
Cleaner Circuit Upgrade
|
10-4
|
|
10.3
|
Recovery Estimates
|
10-4
|
|
10.4
|
Metallurgical Variability
|
10-5
|
|
New Afton Operations
British Columbia
Technical Report Summary
|
|
10.5
|
Deleterious Elements
|
10-7
|
|
10.6
|
Qualified Person’s Opinion on Data Adequacy
|
10-7
|
|
11.0
|
MINERAL RESOURCE ESTIMATES
|
11-1
|
|
11.1
|
Introduction
|
11-1
|
|
11.2
|
Exploratory Data Analysis
|
11-1
|
|
11.3
|
Geological Models
|
11-1
|
|
11.4
|
Density Assignment
|
11-2
|
|
11.5
|
Grade Capping/Outlier Restrictions
|
11-2
|
|
11.6
|
Composites
|
11-4
|
|
11.7
|
Variography
|
11-4
|
|
11.8
|
Estimation/interpolation Methods
|
11-4
|
|
11.9
|
Validation
|
11-4
|
|
11.10
|
Confidence Classification of Mineral Resource Estimate
|
11-5
|
|
11.10.1
|
Mineral Resource Confidence Classification
|
11-5
|
|
11.10.2
|
Uncertainties Considered During Confidence Classification
|
11-5
|
|
11.11
|
Reasonable Prospects of Economic Extraction
|
11-6
|
|
11.11.1
|
Input Assumptions
|
11-6
|
|
11.11.2
|
Commodity Price
|
11-6
|
|
11.11.3
|
Cut-off Grades
|
11-6
|
|
11.11.4
|
QP Statement
|
11-8
|
|
11.12
|
Mineral Resource Statement
|
11-8
|
|
11.13
|
Uncertainties (Factors) That May Affect the Mineral Resource Estimate
|
11-8
|
|
12.0
|
MINERAL RESERVE ESTIMATES
|
12-1
|
|
12.1
|
Introduction
|
12-1
|
|
12.2
|
Development of Mining Case
|
12-1
|
|
12.3
|
Cut-offs
|
12-3
|
|
12.4
|
Ore Loss and Dilution
|
12-3
|
|
12.5
|
Commodity Price
|
12-4
|
|
12.6
|
Mineral Reserve Statement
|
12-5
|
|
12.7
|
Uncertainties (Factors) That May Affect the Mineral Reserve Estimate
|
12-5
|
|
13.0
|
MINING METHODS
|
13-1
|
|
13.1
|
Introduction
|
13-1
|
|
13.2
|
Geotechnical Considerations
|
13-1
|
|
13.2.1
|
Caveability and Fragmentation
|
13-1
|
|
13.2.2
|
Stope Stability
|
13-1
|
|
13.2.3
|
Surface Subsidence
|
13-2
|
|
13.2.4
|
Mud Rushes
|
13-3
|
|
13.2.5
|
Air Blast
|
13-3
|
|
13.2.6
|
Support Systems
|
13-4
|
|
13.2.7
|
Monitoring
|
13-4
|
|
13.3
|
Hydrogeological Considerations
|
13-5
|
|
13.4
|
Operations
|
13-5
|
|
13.4.1
|
Mining Method
|
13-5
|
|
13.4.2
|
Access
|
13-6
|
|
13.4.3
|
B3 Cave
|
13-6
|
|
13.4.4
|
C-Zone
|
13-6
|
|
13.4.5
|
East Extension
|
13-7
|
|
13.5
|
Materials Handling
|
13-8
|
|
13.5.1
|
B3 Cave
|
13-8
|
|
13.5.2
|
C-Zone
|
13-8
|
|
13.5.3
|
East Extension
|
13-9
|
|
New Afton Operations
British Columbia
Technical Report Summary
|
|
13.6
|
Underground Infrastructure
|
13-9
|
|
13.6.1
|
Maintenance and Workshops
|
13-9
|
|
13.6.2
|
Fuel Bay
|
13-10
|
|
13.6.3
|
Batch Plant
|
13-10
|
|
13.6.4
|
Refuge Stations
|
13-10
|
|
13.6.5
|
Utility and Fire Water
|
13-10
|
|
13.6.6
|
Compressed Air and Electricity
|
13-10
|
|
13.6.7
|
Communications
|
13-10
|
|
13.7
|
Ventilation
|
13-11
|
|
13.8
|
Blasting and Explosives
|
13-13
|
|
13.9
|
Production Schedule
|
13-13
|
|
13.10
|
Equipment
|
13-13
|
|
13.11
|
Personnel
|
13-15
|
|
14.0
|
RECOVERY METHODS
|
14-1
|
|
14.1
|
Process Method Selection
|
14-1
|
|
14.2
|
Flowsheet
|
14-1
|
|
14.3
|
Throughput
|
14-1
|
|
14.4
|
Plant Design
|
14-1
|
|
14.4.1
|
Crushing
|
14-1
|
|
14.4.2
|
Grinding
|
14-3
|
|
14.4.3
|
Flotation
|
14-3
|
|
14.4.4
|
Dewatering
|
14-4
|
|
14.4.5
|
Tailings
|
14-4
|
|
14.5
|
Equipment Sizing
|
14-5
|
|
14.6
|
Power and Consumables
|
14-6
|
|
14.6.2
|
Consumables
|
14-6
|
|
14.6.3
|
Personnel
|
14-6
|
|
15.0
|
INFRASTRUCTURE
|
15-1
|
|
15.1
|
Introduction
|
15-1
|
|
15.2
|
Surface Buildings and Facilities
|
15-1
|
|
15.3
|
Roads and Logistics
|
15-3
|
|
15.4
|
Stockpiles
|
15-3
|
|
15.5
|
Waste Rock Storage Facilities
|
15-3
|
|
15.6
|
Tailings Storage Facilities
|
15-3
|
|
15.6.1
|
Afton Pit TSF
|
15-4
|
|
15.6.2
|
New Afton TSF
|
15-4
|
|
15.6.3
|
Historical Afton TSF
|
15-4
|
|
15.6.4
|
Pothook TSF
|
15-5
|
|
15.6.5
|
Tailings Facility Stabilization
|
15-5
|
|
15.6.6
|
Monitoring
|
15-6
|
|
15.6.7
|
Performance Reviews
|
15-6
|
|
15.7
|
Water Management
|
15-6
|
|
15.8
|
Water Supply
|
15-7
|
|
15.9
|
Camps and Accommodation
|
15-7
|
|
15.10
|
Power and Electrical
|
15-7
|
|
16.0
|
MARKET STUDIES AND CONTRACTS
|
16-1
|
|
16.1
|
Markets
|
16-1
|
|
16.2
|
Commodity Price Forecasts
|
16-1
|
|
16.3
|
Contracts
|
16-2
|
|
17.0
|
ENVIRONMENTAL STUDIES, PERMITTING, AND PLANS, NEGOTIATIONS, OR AGREEMENTS WITH LOCAL INDIVIDUALS OR GROUPS
|
17-1
|
|
New Afton Operations
British Columbia
Technical Report Summary
|
|
17.1
|
Baseline and Supporting Studies
|
17-1
|
|
17.2
|
Environmental Considerations/Monitoring Programs
|
17-1
|
|
17.3
|
Closure and Reclamation Considerations
|
17-1
|
|
17.4
|
Permitting
|
17-2
|
|
17.5
|
Social Considerations, Plans, Negotiations and Agreements
|
17-3
|
|
17.5.1
|
Social Considerations
|
17-3
|
|
17.5.2
|
Indigenous Communities
|
17-3
|
|
17.5.3
|
Cultural Heritage
|
17-4
|
|
17.6
|
Qualified Person’s Opinion on Adequacy of Current Plans to Address Issues
|
17-4
|
|
18.0
|
CAPITAL AND OPERATING COSTS
|
18-1
|
|
18.1
|
Introduction
|
18-1
|
|
18.2
|
Capital Cost Estimates
|
18-1
|
|
18.2.1
|
Mine-Related Costs
|
18-1
|
|
18.2.2
|
Other Costs
|
18-1
|
|
18.2.3
|
Capital Cost Summary
|
18-1
|
|
18.3
|
Operating Cost Estimates
|
18-2
|
|
18.3.1
|
Basis of Estimate
|
18-2
|
|
18.3.2
|
Mining and Processing Costs
|
18-2
|
|
18.3.3
|
General and Administrative Costs
|
18-3
|
|
18.3.4
|
Other Operating Costs
|
18-3
|
|
18.3.5
|
Operating Cost Summary
|
18-3
|
|
19.0
|
ECONOMIC ANALYSIS
|
19-1
|
|
19.1
|
Forward-looking Information
|
19-1
|
|
19.2
|
Methodology Used
|
19-1
|
|
19.3
|
Financial Model Parameters
|
19-2
|
|
19.3.1
|
Mineral Resource, Mineral Reserve, and Mine Life
|
19-2
|
|
19.3.2
|
Metallurgical Recoveries
|
19-2
|
|
19.3.3
|
Smelting and Refining Terms
|
19-2
|
|
19.3.4
|
Metal Prices
|
19-2
|
|
19.3.5
|
Capital and Operating Costs
|
19-2
|
|
19.3.6
|
Working Capital
|
19-3
|
|
19.3.7
|
Taxes and Royalties
|
19-3
|
|
19.3.8
|
Closure Costs and Salvage Value
|
19-3
|
|
19.3.9
|
Financing
|
19-3
|
|
19.3.10
|
Inflation
|
19-3
|
|
19.4
|
Economic Analysis
|
19-3
|
|
19.5
|
Sensitivity Analysis
|
19-4
|
|
20.0
|
ADJACENT PROPERTIES
|
20-1
|
|
21.0
|
OTHER RELEVANT DATA AND INFORMATION
|
21-1
|
|
22.0
|
INTERPRETATION AND CONCLUSIONS
|
22-1
|
|
22.1
|
Introduction
|
22-1
|
|
22.2
|
Mineral Tenure, Surface Rights, Water Rights, Royalties and Agreements
|
22-1
|
|
22.3
|
Geology and Mineralization
|
22-1
|
|
22.4
|
Exploration, Drilling, and Sampling
|
22-2
|
|
22.5
|
Data Verification
|
22-2
|
|
22.6
|
Metallurgical Testwork
|
22-2
|
|
22.7
|
Mineral Resource Estimates
|
22-2
|
|
22.8
|
Mineral Reserve Estimates
|
22-3
|
|
22.9
|
Mining Methods
|
22-3
|
|
22.10
|
Recovery Methods
|
22-4
|
|
22.11
|
Infrastructure
|
22-4
|
|
New Afton Operations
British Columbia
Technical Report Summary
|
|
22.12
|
Market Studies
|
22-4
|
|
22.13
|
Environmental, Permitting and Social Considerations
|
22-4
|
|
22.14
|
Capital Cost Estimates
|
22-5
|
|
22.15
|
Operating Cost Estimates
|
22-5
|
|
22.16
|
Economic Analysis
|
22-5
|
|
22.17
|
Risks and Opportunities
|
22-6
|
|
22.17.1
|
Risks
|
22-6
|
|
22.17.2
|
Opportunities
|
22-6
|
|
22.18
|
Conclusions
|
22-7
|
|
23.0
|
RECOMMENDATIONS
|
23-1
|
|
24.0
|
REFERENCES
|
24-1
|
|
24.1
|
Bibliography
|
24-1
|
|
24.2
|
Abbreviations and Units of Measure
|
24-5
|
|
24.3
|
Glossary of Terms
|
24-9
|
|
25.0
|
RELIANCE ON INFORMATION PROVIDED BY THE REGISTRANT
|
25-1
|
|
25.1
|
Introduction
|
25-1
|
|
25.2
|
Macroeconomic Trends
|
25-1
|
|
25.3
|
Markets
|
25-1
|
|
25.4
|
Legal Matters
|
25-1
|
|
25.5
|
Environmental Matters
|
25-2
|
|
25.6
|
Stakeholder Accommodations
|
25-2
|
|
25.7
|
Governmental Factors
|
25-2
|
|
TABLES
|
||
|
Table 1‑1:
|
Measured, Indicated and Inferred Mineral Resource Statement
|
1-7
|
|
Table 1‑2:
|
Proven and Probable Mineral Reserves Statement
|
1-9
|
|
Table 1‑3:
|
LOM Sustaining Capital Cost Estimate
|
1-15
|
|
Table 1‑4:
|
LOM Total Operating Cost Estimate
|
1-16
|
|
Table 1‑5:
|
Commodity Price Forecast Used in Cashflow Analysis
|
1-18
|
|
Table 1‑6:
|
Cashflow Summary Table
|
1-18
|
|
Table 2‑1:
|
QP Chapter Responsibilities
|
2-4
|
|
Table 3‑1:
|
Mineral Tenure Summary Table
|
3-2
|
|
Table 3‑2:
|
Surface Rights Summary Table
|
3-9
|
|
Table 5‑1:
|
Exploration and Development History Summary Table
|
5-2
|
|
Table 6‑1:
|
Stratigraphic Table
|
6-6
|
|
Table 6‑2:
|
Alteration Types
|
6-12
|
|
Table 6‑3:
|
Mineralized Zone Characteristics
|
6-13
|
|
Table 7‑1:
|
Geophysical Surveys
|
7-2
|
|
Table 7‑2:
|
Petrographic and Other Studies Completed
|
7-6
|
|
Table 7‑3:
|
Property Drill Summary Table
|
7-8
|
|
Table 7‑4:
|
Drilling Used for Mineral Resource Estimation
|
7-10
|
|
Table 7‑5:
|
Geotechnical Properties By Mining Zone
|
7-17
|
|
Table 7‑6:
|
Geotechnical Properties By Lithology
|
7-17
|
|
Table 9‑1:
|
External Data Reviews
|
9-2
|
|
Table 11‑1:
|
Interpolation Parameters
|
11-5
|
|
Table 11‑2:
|
Cut-off Input Assumptions
|
11-7
|
|
Table 11‑3:
|
Measured, Indicated, and Inferred Mineral Resources Statement
|
11-9
|
|
Table 12‑1:
|
NSR Parameters
|
12-4
|
|
Table 12‑2:
|
Proven and Probable Mineral Reserves Statement
|
12-6
|
|
New Afton Operations
British Columbia
Technical Report Summary
|
|
Table 13‑1:
|
LOM Production Plan
|
13-14
|
|
Table 13‑2:
|
Key Equipment List
|
13-16
|
|
Table 16‑1:
|
Commodity Price Forecast Used in Cashflow Analysis
|
16-3
|
|
Table 18‑1:
|
LOM Capital Cost Estimate (US$ M)
|
18-2
|
|
Table 18‑2:
|
LOM Operating Cost Estimate
|
18-4
|
|
Table 19‑1:
|
Cashflow Summary Table
|
19-5
|
|
Table 19‑2:
|
Cashflow Forecast on Annualized Basis (US$ M)
|
19-6
|
|
Table 19‑3:
|
Sensitivity Table (US$ M)
|
19-7
|
|
FIGURES
|
||
|
Figure 2‑1:
|
Location of New Afton Mine
|
2-2
|
|
Figure 3‑1:
|
Mineral Tenure Location Plan
|
3-7
|
|
Figure 3‑2:
|
Lands Purchase Agreement Royalty
|
3-11
|
|
Figure 6‑1:
|
Regional Geology Map
|
6-2
|
|
Figure 6‑2:
|
Local Geology Map
|
6-4
|
|
Figure 6‑3:
|
Stratigraphic Column, New Afton Deposit Area
|
6-5
|
|
Figure 6‑4:
|
Geology Map, New Afton Deposit
|
6-9
|
|
Figure 6‑5:
|
Mineralized Zones Relative to Lithological Units
|
6-10
|
|
Figure 6‑6:
|
Mineralization Domains within the New Afton Geological Model
|
6-14
|
|
Figure 7‑1:
|
Map of Geophysical Surveys
|
7-4
|
|
Figure 7‑2:
|
Drill Collar Location Plan, Project Area
|
7-9
|
|
Figure 7‑3:
|
Collar Locations of Drilling used for Mineral Resource Estimation
|
7-11
|
|
Figure 7‑4:
|
Example Drill Section, Drilling Used In Mineral Resource Estimates
|
7-12
|
|
Figure 10‑1:
|
Copper Recovery Curves At 16,000 t/d Processing Rate
|
10-6
|
|
Figure 10‑2:
|
Gold Recovery Curves At 16,000 t/d Processing Rate
|
10-7
|
|
Figure 11‑1:
|
Low-Grade Estimation and Mineral Reserves-Constraining Shapes
|
11-3
|
|
Figure 12‑1:
|
Final Mine Layout Plan
|
12-2
|
|
Figure 13‑1:
|
Ventilation Schematic
|
13-12
|
|
Figure 14‑1:
|
Process Flowsheet
|
14-2
|
|
Figure 15‑1:
|
Infrastructure Layout Plan
|
15-2
|
|
New Afton Operations
British Columbia
Technical Report Summary
|
| 1.0 |
EXECUTIVE SUMMARY
|
| 1.1 |
Introduction
|
Mr. Tyler Roberts, P.Eng., Mr. Devin Wade, P.Geo., Ms. Jennifer Katchen, P.Eng., Mr. Vincent Nadeau-Benoit, P.Geo., Mr. Matthew Davis, P.Eng., and Ms. Emily O’Hara, P.Eng., prepared this technical
report summary (the Report) for Coeur Mining, Inc. (Coeur), on the New Afton copper–gold mine (the New Afton Operations or the Project) in British Columbia (BC).
Coeur acquired the New Afton Operations in March 2026 through its acquisition of New Gold Inc. (New Gold).
| 1.2 |
Terms of Reference
|
The Report was prepared to be attached as an exhibit to support mineral property disclosure, including mineral resource and mineral reserve estimates, for the New Afton Operations in Coeur’s Current
Report on Form 8-K.
Unless otherwise indicated, all financial values are reported in United States dollars (US$). The Canadian currency is the Canadian dollar (C$). Unless otherwise noted, the Report uses metric units
and US English.
Mineral resources and mineral reserves are reported using the definitions in Item 1300 of Regulation S–K (17 CFR Part 229) (S-K 1300) of the United States Securities and Exchange Commission.
| 1.3 |
Property Setting
|
The New Afton Operations are in the south-central interior region of British Columbia, approximately 10 km west of the City of Kamloops and approximately 350 km northeast of Vancouver. The
approximate center of the property is located at 50° 39' latitude north and 120° 31' longitude west, or 5614800N and 675500E using NAD83, Zone 10 North Universal Transverse Mercator (UTM) coordinates. The nominal elevation of the property is
approximately 700 meters above mean sea level (masl).
The operations are located just west of the junction of the Trans-Canada Highway No. 1 with Coquihalla Highway No. 5, which both provide year-round road access. Access to the site is by a mine road
located off the Trans-Canada Highway. The Kamloops airport is served by regular scheduled flights to Vancouver and Victoria, British Columbia, and Calgary, Alberta. The Canadian National Railway and Canadian Pacific Railway both pass through
Kamloops.
British Columbia Hydro and Power Authority (BC Hydro) transmission lines, a FortisBC Inc. (FortisBC) natural gas pipeline, and a Pembina Pipeline Corporation (Pembina) oil pipeline traverse the
mining lease north of the historical Afton pit. A water pipeline, approximately 4 km in length, delivers fresh water from Kamloops Lake to the mine site. Coeur purchased the water pipeline and pump house facilities from Teck Resources Limited
(Teck) and its subsidiary (Afton Operating Corp.) as part of a purchase agreement in 2007.
|
New Afton Operations
British Columbia
Technical Report Summary
|
Coeur has four active water licenses to withdraw water from Kamloops Lake for mining and milling operations.
The Kamloops area is in the rain shadow of the British Columbia Coast Mountains and is characterized by a semi-arid climate. The mine operates year-round.
| 1.4 |
Mineral Tenure, Surface Rights, Water Rights, Royalties and Agreements
|
Coeur’s mineral tenures in the mine area comprise cell claims, legacy claims, and a mining lease. Mineral claims cover a total area of approximately 21,714 ha, and the mining lease covers
approximately 902 ha.
The Project area is defined by Coeur’s M-229 Mines Act Permit boundary; within this permit boundary, Coeur is authorized to complete approved surface works and mining operations as written in the
M-229 Permit document. The New Afton deposit is within the M-229 permit boundary. The permit area encompasses most of the mining lease area, as well as a portion of several mineral claims.
The New Afton Mining Lease is valid until November 2036 and is renewed annually with a cash payment due on or before the November 29 anniversary date. Work completed within the mining lease boundary
cannot be used for the annual lease renewal or on mineral claims that overlap the mining lease. The remainder of the mineral tenure is renewed with either exploration work done on a mineral claim (including contiguous mineral claims) and submitted
online in the form of a work report, or with a ‘cash in lieu of work’ payment.
Coeur holds the surface rights plus a section of Crown property (Crown land in British Columbia is land owned by the provincial government) within and adjacent to the area covered by the M-229 Permit
boundary. The area held under surface rights totals 5,620.5 acres. No additional rights are needed to support the life-of-mine (LOM) plan presented in this Report.
Coeur has engaged in several royalty agreements with various third parties on relatively small parcels within the broader overall property, with one proximal to the New Afton mine. In 2007, a Land
Purchase Agreement was signed between Teck, Afton Operating Corporation, and New Gold Inc. (Coeur). Part of this agreement was a 2% net smelter royalty (NSR) on ‘the lands subject to the agreement payable to Teck or a C$12 M buyout at any time on
the mineral rights. This royalty remains active, has changed hands twice, and would now be payable to Royal Gold Inc.
Coeur is party to a Cooperation Agreement originally with the Tk’emlúps te Secwépemc and the Skeetchestn Indian Band (together referred to as the SSN). The Cooperation Agreement provides that a fixed
royalty amount is paid annually until the full amount is reached in January 31, 2030.
|
New Afton Operations
British Columbia
Technical Report Summary
|
| 1.5 |
Geology and Mineralization
|
The New Afton deposit, and its associated hydrothermal systems, occurs where the Late Triassic to Early Jurassic mafic to intermediate volcanic and volcaniclastic rocks of the Nicola Group are in
contact with the multi-phase Late Triassic to Early Jurassic alkaline intrusions of the Iron Mask Batholith. Post-accretion Early to Middle Eocene sedimentary and volcanic rocks of the Kamloops Group unconformably overlie the island-arc
assemblages. The New Afton deposit is classified as a silica-saturated alkalic copper–gold porphyry deposit.
Copper–gold mineralization typically occurs as east-west subvertical tabular zones of disseminations, stringers, and fracture-filling sulfides within rocks of the volcanic Nicola Group and the
diorite. The deposit consists of three principal zones:
| • |
The Main zone, located on the western edge of the Pothook diorite is subdivided into Lift 1 East, Lift 1 West (both mined out), and the B3, C-Zone, and D-Zone mining zones. Mining is currently focused on the B3
and C-Zone. Mineral resources are estimated for the D-Zone;
|
| • |
The Hanging wall (HW) zones are smaller satellite zones located along the southern margin of the Pothook diorite;
|
| • |
The Eastern zones include two separate areas located on the northern margin of the Pothook diorite: East Extension and K-Zone. East Extension is currently in the mine planning phase and the K-Zone has estimated
mineral resources.
|
Mineralization is subdivided into three types: hypogene (either chalcopyrite- or bornite-dominant), secondary hypogene (sometimes referred to as mesogene) (overprint of tennantite-enargite +
tetrahedrite and bornite + chalcocite rims), and supergene (native copper and chalcocite).
| 1.6 |
History and Exploration
|
Companies that had a Project interest prior to Coeur included Teck, Iso Mines Ltd., Westridge Ltd., Indogold Development Ltd., and DRC Resources Corporation (DRC). DRC changed its name to New Gold in
2005. Work completed prior to Coeur’s Project interest included claims staking, geochemical and geophysical surveys, drilling, construction of an exploration decline, and mining-related studies. Open pit mining operations ran from 1977–1997.
Underground development commenced in 2007.
Coeur acquired the New Afton Operations in March 2026 through its acquisition of New Gold.
| 1.7 |
Drilling and Sampling
|
A total of 1,712 core, reverse circulation, piezo cone penetration, vertical seismic profiling, Odex, and sonic drill holes (601,145.21 m) have been completed in the Project area from 2000–2025. No
drilling was conducted in 2004. Drilling includes drill holes completed for geotechnical, hydrogeological, metallurgical and exploration purposes. Drill holes are both surface and underground. A total of 1,165 core holes (491,531.79 m) is used in
estimation. Drill holes omitted from estimation support include drilling prior to 2000, distal exploration drill holes and geotechnical drill holes.
|
New Afton Operations
British Columbia
Technical Report Summary
|
Core recovery averaged 98.5% for those drill holes used in estimation.
Drill hole collars are located by mine survey staff. Downhole dip and azimuth data were also measured for core drill holes by the drill contractor using a DeviGyro Overshot Xpress (OX) downhole tool.
In the opinion of the Qualified Person (QP), the sample preparation procedures, analytical methods, QA/QC protocols, and sample security for the samples used in mineral resource estimation are
acceptable, meet industry-standard practice, and are acceptable for mineral resource and mineral reserve estimation and mine planning purposes.
| 1.8 |
Data Verification
|
Data verification programs were carried out by independent consultants and operations personnel over time. Coeur implements a series of routine verification procedures to ensure the reliable
collection of exploration data. All work is conducted by appropriately qualified personnel under the supervision of qualified geologists.
A number of validation checks were performed in support of technical reports filed as a result of New Afton’s Canadian regulatory reporting requirements.
The QP supervised the preparation of the mineral resource estimate, completed site visits, undertook review of selected data audit reports, drill cores, geological data, QA/QC procedures, and
completed a validation of the current drill hole database. The QP is of the opinion that the data verification programs for Project data adequately support the geological interpretations, the analytical and database quality, and therefore support
the use of the data in mineral resource and mineral reserve estimation, and in mine planning.
| 1.9 |
Metallurgical Testwork
|
Initial metallurgical testing was performed in 2008 and 2009 to evaluate the mineralogy of the deposit and contribute to the process plant and tailings storage facility (TSF) designs. Testwork
included mineralogical studies, modal analyses, grinding tests, flotation tests, gravity tests, variability tests, and dewatering tests. It was determined that conventional crushing, grinding, and concentration processes were appropriate given the
mineralogy of the deposit.
Since the New Afton Operations commenced production in 2012, additional metallurgical testwork was completed, primarily by ALS Laboratories (ALS) in Kamloops, to support the evaluation of C-Zone,
East Extension, HW, K-Zone and D-Zone. ALS is independent of Coeur/New Gold. This testwork included chemical and mineralogical studies, comminution testwork (semi-autogenous grind (SAG) mill comminution (SMC), SAG power index (SPI) with comminution
economic evaluation tool (CEET) crusher index determination, Bond ball and rod mill index tests), dilution cleaning tests, locked-cycle tests, gravity recoverable gold tests, and flotation technology evaluations.
|
New Afton Operations
British Columbia
Technical Report Summary
|
Two main mineralization types will be treated over the life-of-mine (LOM): hypogene ore (including background material that is not classified as either hypogene, secondary hypogene, or supergene) and
secondary hypogene ore. Hypogene ore and background material form the majority of the material to be processed at 95% while secondary hypogene ore makes up the remaining 5%. Predictive recovery formulas were developed (based on feed grades, grind
size, and throughput rate) to forecast copper and gold recoveries. Based on operating experience, C-Zone hypogene copper recovery is capped at 92%. LOM copper and gold recovery rates are estimated to be approximately 88.4% and 83.9%, respectively.
The New Afton concentrate has historically been very clean and marketable. There are no known deleterious elements that could have a significant effect on economic extraction. Expected penalties
associated with mercury and arsenic levels have been taken into account in the concentrate sales model.
| 1.10 |
Mineral Resource Estimation
|
| 1.10.1 |
Estimation Methodology
|
Two block models were generated to estimate mineral resources at New Afton. The two models cover the same extent but have different block sizes to provide more flexibility with choice of mining
methods. A 10 x 10 x 10 m model was generated to estimate Mineral Resources for zones considered suitable for mining through block caving. A 5 x 5 x 5 m sub-blocked model was generated to test potential applicability of more selective underground
mining methods.
Grade shells were modelled at specific grade thresholds. Mineralized grade shells were generated for all mineralized zones at a grade threshold of 0.2% copper equivalent (CuEq). Sub-domain grade
thresholds were 5.0% CuEq for East Extension, 1.0% CuEq for HW1 and 0.8% for K-Zone. Estimation was also carried out in complementing lithological domains including monzonite dykes, latite dyke, and Nicola Group volcanic rocks. The picrite unit was
assigned a grade of zero for all metals contained within. All domains were used as hard boundaries during the estimation process.
The block model grades for copper, gold, and silver were estimated using ordinary kriging (OK). The copper, gold, and silver estimates were conducted in a single pass using a search ellipsoid
measuring 150 x 150 x 40 m for the 10 x 10 x 10 m model and a search ellipsoid measuring 150 x 150 x 20 m for the 5 x 5 x 5 m sub-blocked model.
The mineral resource estimates were reported assuming underground stope mining methods for East Extension and underground bulk mining methods, likely block caving, for all other zones. Constraining
volumes were created to demonstrate the spatial continuity of the mineralization within a potentially mineable shape.
For underground bulk mining zones, mineral resources were reported within resource cave shapes created using a cut-off grade of 0.33% CuEq. Within the resource cave shapes, resources are reported for
blocks above 0.30% CuEq for K-Zone, and above 0.15% CuEq for the other zones.
|
New Afton Operations
British Columbia
Technical Report Summary
|
The following copper-equivalency is used:
| • |
Cu% + (Au g/t * Au Recovery * Au Payable * (Au Price - Refining) / 31.1035) + (Ag g/t * Ag Recovery * Ag Payable * (Ag Price - Refining) / 31.1035) / (22.046 * Cu Recovery * Cu Payable * (Cu Price - Refining).
|
The calculations are based on the following:
| • |
Au price: US$2,500/oz Au; Au recovery: 87.7%; Au payable: 97.0%; Au refining charge: US$6.00/oz; Ag price: US$30/oz Au; Ag recovery: 73.5%; Ag payable: 90.0%; Ag refining charge: US$0.50/oz; Cu price: US$4.40/lb
Cu; Cu recovery: 86.4%; Cu payable: 96.4%; Cu refining charge: US$0.8/lb.
|
| 1.10.2 |
Mineral Resource Statement
|
Mineral resources are reported using the mineral resource definitions set out in S-K 1300, and are reported exclusive of those mineral resources converted to mineral reserves. Mineral resources that
are not mineral reserves do not have demonstrated economic viability.
Estimates are current as at December 31, 2025. The reference point for the estimate is in situ.
Mineral resource estimates are summarized in Table 1‑1.
The Qualified Persons for the estimates are Mr. Vincent Nadeau-Benoit P.Geo., and Mr. Tyler Roberts, P.Eng., both Coeur employees.
| 1.10.3 |
Factors That May Affect the Mineral Resource Estimate
|
Factors that may affect the Mineral Resource and Mineral Reserve estimates include metal price and exchange rate assumptions; changes to the assumptions used to generate cut-off grades;
interpretations of mineralization geometry and continuity of mineralized zones; changes to geological and mineralization shape and geological and grade continuity assumptions; density and domain assignments; geotechnical and hydrogeological
assumptions; parameters used to derive cave resource shapes and stope shapes; assumptions related to cave mixing and dilution; changes to metallurgical recovery assumptions; changes to inputs to capital and operating cost estimates; and assumptions
regarding the continued ability to access the site, retain mineral and surface rights, maintain environmental and other regulatory permits, and maintain the social and environmental license to operate.
|
New Afton Operations
British Columbia
Technical Report Summary
|
Table 1‑1: Measured, Indicated and Inferred Mineral Resource Statement
|
Zone
|
Category
|
Tonnes
(t x 1,000)
|
Grade | Metal Content |
Cut-off
Grade
|
Metallurgical
Recovery |
|||||||||||||||||||
|
Au
(g/t)
|
Ag
(g/t)
|
Cu
(%)
|
Au Ounces
(oz x 1,000)
|
Ag Ounces
(oz x 1,000)
|
Cu Pounds
(lb x 1,000,000)
|
CuEq.
(%)
|
Au
(%)
|
Ag
(%)
|
Cu
(%)
|
||||||||||||||||
|
B-Zone
C-Zone
D-Zone
HW
|
Measured
|
29,843
|
0.58
|
1.78
|
0.62
|
552
|
1,707
|
408
|
0.15
|
87.7
|
73.5
|
86.4
|
|||||||||||||
|
Indicated
|
25,611
|
0.28
|
1.04
|
0.28
|
230
|
859
|
158
|
0.15
|
87.7
|
73.5
|
86.4
|
||||||||||||||
|
Sub-total measured and indicated
|
55,454
|
0.44
|
1.44
|
0.46
|
782
|
2,566
|
566
|
0.15
|
87.7
|
73.5
|
86.4
|
||||||||||||||
|
Inferred
|
1,289
|
0.35
|
0.70
|
0.22
|
15
|
29
|
6
|
0.15
|
87.7
|
73.5
|
86.4
|
||||||||||||||
|
K-Zone
|
Measured
|
7,206
|
0.70
|
3.66
|
0.91
|
162
|
849
|
144
|
0.30
|
87.7
|
73.5
|
86.4
|
|||||||||||||
|
Indicated
|
40,436
|
0.43
|
1.52
|
0.52
|
553
|
1,979
|
462
|
0.30
|
87.7
|
73.5
|
86.4
|
||||||||||||||
|
Sub-total measured and indicated
|
47,642
|
0.47
|
1.85
|
0.58
|
715
|
2,827
|
606
|
0.30
|
87.7
|
73.5
|
86.4
|
||||||||||||||
|
Inferred
|
5,877
|
0.45
|
1.64
|
0.59
|
86
|
309
|
77
|
0.30
|
87.7
|
73.5
|
86.4
|
||||||||||||||
|
East
Extension
|
Measured
|
—
|
—
|
—
|
—
|
—
|
—
|
—
|
—
|
—
|
—
|
—
|
|||||||||||||
|
Indicated
|
1,558
|
0.96
|
4.24
|
1.04
|
48
|
213
|
36
|
1.26
|
87.7
|
73.5
|
86.4
|
||||||||||||||
|
Sub-total measured and indicated
|
1,558
|
0.96
|
4.24
|
1.04
|
48
|
213
|
36
|
1.26
|
87.7
|
73.5
|
86.4
|
||||||||||||||
|
Inferred
|
—
|
—
|
—
|
—
|
—
|
—
|
—
|
—
|
—
|
—
|
—
|
||||||||||||||
|
Total
|
Measured
|
37,049
|
0.60
|
2.15
|
0.68
|
715
|
2,555
|
552
|
—
|
87.7
|
73.5
|
86.4
|
|||||||||||||
|
Indicated
|
67,605
|
0.38
|
1.40
|
0.44
|
831
|
3,051
|
656
|
—
|
87.7
|
73.5
|
86.4
|
||||||||||||||
|
Total measured and indicated
|
104,654
|
0.46
|
1.67
|
0.52
|
1,545
|
5,606
|
1,208
|
—
|
87.7
|
73.5
|
86.4
|
||||||||||||||
|
Inferred
|
7,166
|
0.44
|
1.47
|
0.53
|
100
|
338
|
83
|
—
|
87.7
|
73.5
|
86.4
|
||||||||||||||
Notes to accompany mineral resource tables:
| 1. |
The mineral resource estimates are current as at December 31, 2025, and are reported using the definitions in Item 1300 of Regulation S–K (17 CFR Part 229) (S-K 1300).
|
| 2. |
The reference point for the mineral resource estimate is in situ. The Qualified Persons for the estimate are Mr. Vincent Nadeau-Benoit P.Geo., and Mr. Tyler Roberts, P.Eng., both Coeur employees.
|
| 3. |
Mineral resources are reported exclusive of those mineral resources converted to mineral reserves. Mineral resources that are not mineral reserves do not have demonstrated economic viability.
|
| 4. |
Mineral Resources are estimated using metal price assumptions of US$4.40 per pound of copper, US$2,500 per ounce of gold, and US$30 per ounce of silver, and a foreign exchange rate assumption of 1.30 C$/1.00US$.
|
| 5. |
For underground bulk mining, mineral resources are reported within resource cave shapes created using a cut-off grade of 0.33% CuEq. Within resource cave shapes, resources are reported for blocks above 0.30% CuEq
for K-Zone, and above 0.15% CuEq for the other zones. For stope mining, mineral resources are reported within mineable shapes created using a cut-off grade of 1.26% CuEq and include must-take material.
|
| 6. |
The following copper-equivalency (CuEq%) formula is used: Cu% + (Au g/t * Au Recovery * Au Payable * (Au Price - Refining) / 31.1035) + (Ag g/t * Ag Recovery *
Ag Payable * (Ag Price - Refining) / 31.1035) / (22.046 * Cu Recovery * Cu Payable * (Cu Price - Refining). The calculations are based on the following: Au price: US$2,500/oz Au; Au recovery: 87.7%; Au payable: 97.0%; Au refining charge:
US$6.00/oz; Ag price: US$30/oz Au; Ag recovery: 73.5%; Ag payable: 90.0%; Ag refining charge: US$0.50/oz; Cu price: US$4.40/lb Cu; Cu recovery: 86.4%; Cu payable: 96.4%; Cu refining charge: US$0.8/lb.
|
| 7. |
Rounding of tonnes, grades, troy ounces and pounds as required by reporting guidelines, may result in apparent differences between tonnes, grades, and contained metal contents.
|
|
New Afton Operations
British Columbia
Technical Report Summary
|
| 1.11 |
Mineral Reserve Estimation
|
| 1.11.1 |
Estimation Methodology
|
C-Zone mineral reserves were estimated using the 10 x 10 x 10 m model. Measured and indicated mineral resources were converted to probable mineral reserves. Due to the uncertainty associated with
estimating movement of material within the block caves, no proven mineral reserves were reported for C-Zone and East Extension. Mining of the B3 block cave is expected to be completed in Q1 2026. Material is continuing to be drawn from the B3 cave;
however, this material is unclassified and is not included in the mineral reserves or mine plan in this Report.
East Extension mineral reserves were estimated using the 5 x 5 x 5 m sub-blocked model. Indicated mineral resources were converted to probable mineral reserves.
Mineral reserve block models were generated by adding an NSR attribute, in US$ per tonne, to each block in the resource block models. Blocks classified as inferred mineral resources, or without a
resource classification, were set to zero grade and zero NSR.
Ore recovery in the block caves is assumed to be 100% of the mixed/diluted block model. Dilution assumptions for East Extension stopes are currently estimated at 10.8%, with 5.8% from hanging-wall
and footwall overbreak at the block model grade and 5% backfill dilution at zero grade. n additional 93% mining recovery factor is applied to stope tonnes to account for un-blasted ore in the shoulders of the stopes and un-mucked ore remaining on
the floor of the stopes.
| 1.11.2 |
Mineral Reserve Statement
|
Mineral reserves were classified using the mineral reserve definitions set out in S-K 1300. The reference point for the mineral reserve estimate is the point of delivery to the process plant.
Mineral reserves are current as at December 31, 2025.
Mineral reserves are reported in Table 1‑2.
The Qualified Person for the estimate is Mr. Tyler Roberts, P.Eng., a Coeur employee.
| 1.11.3 |
Factors That May Affect the Mineral Reserve Estimate
|
Factors that may affect the mineral reserve estimates include changes to the long-term copper, gold, and silver price and exchange rate assumptions; changes to the parameters used to derive the cave
outlines and stope shapes and determine the cut-off values; changes to geotechnical and hydrogeological assumptions; changes to the cave mixing model and dilution estimates; changes to metallurgical recovery assumptions; changes to inputs to
capital and operating cost estimates; and the ability to maintain the social and environmental license to operate.
|
New Afton Operations
British Columbia
Technical Report Summary
|
Table 1‑2: Proven and Probable Mineral Reserves Statement
|
Zone
|
Category
|
Tonnes
(kt)
|
Grade | Contained Metal |
Metallurgical
Recovery
(%) |
||||||||||||||
|
Au
(g/t)
|
Ag
(g/t)
|
Cu
(%)
|
Au
(koz)
|
Ag
(koz)
|
Cu (Mlbs)
|
||||||||||||||
|
C-Zone
|
Proven
|
—
|
—
|
—
|
—
|
—
|
—
|
—
|
—
|
||||||||||
|
Probable
|
35,212
|
0.65
|
1.62
|
0.72
|
739
|
1,837
|
556
|
88.5
|
|||||||||||
|
Sub-total proven and probable
|
35,212
|
0.65
|
1.62
|
0.72
|
739
|
1,837
|
556
|
88.5
|
|||||||||||
|
East Extension
|
Proven
|
—
|
—
|
—
|
—
|
—
|
—
|
—
|
—
|
||||||||||
|
Probable
|
962
|
1.31
|
8.5
|
1.63
|
41
|
264
|
35
|
87.6
|
|||||||||||
|
Sub-total proven and probable
|
962
|
1.31
|
8.5
|
1.63
|
41
|
264
|
35
|
87.6
|
|||||||||||
|
Total
|
Proven & Probable
|
36,174
|
0.67
|
1.79
|
0.74
|
780
|
2,101
|
591
|
88.5
|
||||||||||
Notes to accompany mineral reserve table:
| 1. |
The Mineral Reserve estimates are current as at December 31, 2025, and are reported using the definitions in Item 1300 of Regulation S–K (17 CFR Part 229) (S-K 1300).
|
| 2. |
The Qualified Person for the estimate is Mr. Tyler Roberts, P.Eng., a Coeur employee.
|
| 3. |
Mineral Reserves are estimated using metal price assumptions of US$3.50 per pound of copper, US$1,650 per ounce of gold, and US$20 per ounce of silver, and a foreign exchange rate assumption of C$1.30 : US$1.00.
|
| 4. |
C-Zone block cave Mineral Reserves are reported at a cut-off NSR of US$24/t and East Extension Mineral Reserves are reported at a cut-off NSR of US$100/t, based on processing costs of US$9.00/t processed, G&A
costs of US$3.50/t processed, block caving costs of US$11.50/t ore mined, and stoping costs of US$87.50/t ore mined. Metallurgical recoveries vary depending on ore type and grades.
|
| 5. |
Rounding of short tonnes, grades, and troy ounces, as required by reporting guidelines, may result in apparent differences between tonnes, grades, and contained metal contents.
|
| 1.12 |
Mining Methods
|
The mineral reserve estimates are based on block caving and long-hole stoping underground mining methods. The B3 and C-Zones are mined using block caving, and the East Extension is planned to be
mined using stoping methods. Mining of the B3 block cave is expected to be completed in Q1 2026. Material is continuing to be drawn from the B3 cave; however, this material is unclassified and is not included in the mineral reserves or mine plan in
this Report. The LOM plan is based on the C-Zone block cave, and longitudinal stoping at the East Extension.
|
New Afton Operations
British Columbia
Technical Report Summary
|
Stope stability analysis for East Extension was completed using empirical design. Stopes are scheduled to be backfilled with cemented rock fill shortly after they are mined to reduce stand-up time
and overbreak. East Extension is not expected to cause additional subsidence.
The block cave mining method involves development of a footprint at the base of the cave that includes an undercut level for initiating the cave and an extraction level from which ore will be mucked
from drawpoints for the duration of the cave.
The B3 block cave extraction level is approximately 160 m below the mined-out Lift 1 and 760 m below surface. The B3 footprint measures approximately 250 x 125 m for a footprint area of approximately
31,000 m2. B3 has a total of 65 drawbells spaced at 16.5 x 27.0 m, four longitudinal strike drives, and 111 drawpoints.
The C-Zone extraction level is located approximately 390 m below the B3 extraction level and 1,150 m below surface. The footprint of C-Zone measures approximately 460 x 120 m for an area of
approximately 55,000 m2. The extraction level has seven transverse crosscuts, 91 designed drawbells spaced at 18.0 x 27.0 m, and a total of 177 drawpoints.
East Extension is located 120 m east of the C-Zone block cave, and 150 m above the C-Zone extraction level. East Extension Mineral Reserves extend approximately 200 m vertically and 140 m along
strike. The current design has 10 levels, spaced at 20 m vertical intervals, with ramp access from the east. Each level has a single or second parallel ore drive running east-west, with dimensions of 5.0 m wide x 5.0 m high. There are 114 stopes
designed in three panels to optimize scoop productivity; the panels are separated by 5 m thick sill pillars. Stopes were designed with dimensions of 14 m long x 20 m high and a width up to 20 m.
The underground mine is accessed by decline from a portal on surface located to the south of the processing plant. Emergency egress is available through a fresh-air raise equipped with an Alimak
elevator and a staging area.
The materials handling system consists of ore passes, underground crushers, a conveyor system to surface, and underground truck haulage. All concrete and shotcrete products used underground are
produced at the on-site batch plant. Shotcrete and concrete products are delivered via 4 or 6 m3 underground transmixers. Three explosives magazines are located on site: two on surface, and two underground.
The current ventilation layout is a push–pull system with six ventilation raises to surface: three intake raises and three exhaust raises. The intake raises (VR5, VR6, and VR7) are fitted with 800 hp
axial fans. The exhaust shafts (VR2, VR3, and VR4) are fitted with 600 hp axial fans. The main conveyor portal also exhausts air from the mine.
Mining of the B3 block cave is expected to be completed in Q1 2026. Material is continuing to be drawn from the B3 cave from outside the stated proven and probable reserve, the material is
unclassified and not represented in reserves. Draw will cease from the B3 cave at such a time as the observed grades become uneconomical or the approaching C-Zone cave induces safety risks.
C-Zone mining production is expected to ramp up to approximately 5.4 Mt of ore in 2026 and 5.4–6.0 Mt/a from 2026–2032. In periods when the mining
rate exceeds the processing rate, intermediate-grade ore will be stockpiled on surface until it can be processed.
|
New Afton Operations
British Columbia
Technical Report Summary
|
Development of the East Extension access ramp is scheduled to start from the top and bottom in 2028, and the first ore from East Extension is expected in 2028. From 2028–2031, the East Extension is
expected to provide approximately 500 t/d of high-grade supplementary mill feed.
With the ramping up of C-Zone block cave, the processing rate is planned to increase from an average of 13,750 t/od at the start of 2026 to full capacity of approximately 16,000 t/d by the end of
2026. These processing rates were achieved in the past during mining of the Lift 1 block caves. Feed grades are planned to increase as C-Zone caving advances into the core of the deposit, peaking in 2027 and 2028.
The current mine life forecast is seven years, to 2032.
| 1.13 |
Recovery Methods
|
The New Afton process plant has been in operation since mid‐2012. The plant is a mineral concentrator. The process flowsheet consists of conventional crushing and grinding circuits, a flotation
circuit, and a gravity circuit to produce a copper-gold concentrate.
Since initial commissioning, the process plant has undergone several major updates to increase processing capacity, maintain metallurgical recoveries, facilitate the processing of different ore
types, and produce thickened and amended tailings.
The process facility uses one source of fresh water and multiple sources of reclaimed water. Water drawn from Kamloops Lake is used for applications requiring fresh rather than reclaimed water, as
well as to make up any deficit in the site water balance.
Most of the power consumption at the mill occurs in the grinding circuit.
| 1.14 |
Infrastructure
|
The New Afton Mine is in operation and has all the required infrastructure to support the operation.
Surface infrastructure supporting the New Afton operation includes: a process facility, a thickened and amended tailings plant, maintenance workshops, warehouses, an assay laboratory, the integrated
operations center, mine dry buildings, offices, explosives magazines, a concrete batch plant, ventilation fans and heaters, and electrical and pumping facilities.
During periods when mining rates exceed processing capacity, intermediate-grade ore may be stockpiled on surface for later processing. Intermediate-grade C-Zone Mineral Reserves may also be
segregated and stockpiled on surface using a diverter on the conveyor as it exits the underground portal. All stockpile locations and volumes are permitted and approved through end of mine.
Waste rock produced by block cave mining at New Afton is deposited in the Afton Pit TSF or within designated block cave subsidence areas, both of which are classified as potentially acid generating
(PAG) storage areas.
There are four TSFs on the New Afton mine site:
| • |
The Afton Pit TSF, which is the primary facility for LOM tailings deposition;
|
|
New Afton Operations
British Columbia
Technical Report Summary
|
| • |
The New Afton TSF, which holds the Lift 1 and majority of B3 tailings ;
|
| • |
The Historical Afton TSF, which holds the tailings from the original Afton operation and has since been inactive;
|
| • |
The Pothook TSF, which acts as a site water reservoir, and currently does not receive any tailings.
|
The current LOM plan is to deposit 44 Mt in the Afton Pit TSF, which will use approximately 55–60% of the total storage capacity. Coeur has implemented a stringent subsidence monitoring and adaptive
management plan during the stabilization and mining period to effectively manage TSF risks. Subsidence models and site observations are continually reviewed and used to confirm understanding of the timing of ground movements, and to verify that
subsidence movement is projected to remain within the target stabilization areas of the affected facilities. All TSFs located on the New Afton Mine site undergo thorough review and oversight from qualified professionals.
Fresh water is drawn from Kamloops Lake and is used primarily for ore processing make-up water, as road dust suppressant, for vehicle wash-down, fire control, and drilling. The majority of mill
process water is currently reclaimed from the tailings thickener overflow. Water balance modelling is used to track the inventory of water on site, as well as water consumption and water losses. Tailings seepage water is collected surface water
management ponds, in the mine workings, or via interception wells prior to entering the underground workings. The water collected from these locations is pumped to the mill process water stream.
Currently, BC Hydro supplies the mine with 49.5 MW of electrical power via a connection located between the Savona Substation and the Douglas Substation. This connection consists of a 138 kV overhead
line terminal and approximately 1.1 km of 138 kV transmission line to the site’s substation.
| 1.15 |
Markets and Contracts
|
| 1.15.1 |
Market Studies
|
The New Afton Operations produce a high-quality clean copper concentrate with typical copper grade, high gold grades, payable silver credits, and relatively low impurity levels. The current
concentrate is readily marketable to any of several smelters or concentrate marketing firms. Smelting and refining terms are generally similar and include treatment charges and refining charges which are generally known, with penalty charges for
contaminants such as arsenic and mercury in the concentrates. Penalty terms are generally more variable than the treatment and refining terms. Concentrates are typically sold through concentrate marketing firms, with long-term contracts that cover
several years. Coeur has established contracts and buyers for the concentrate products, and has an internal marketing group that monitors markets for its key products.
|
New Afton Operations
British Columbia
Technical Report Summary
|
| 1.15.2 |
Commodity Prices
|
Coeur uses a combination of analysis of three-year rolling averages, long-term consensus pricing, and benchmarks to pricing used by industry peers over the past year, when considering long-term
commodity price forecasts.
Higher metal prices are used for the mineral resource estimates to ensure the mineral reserves are a sub-set of, and not constrained by, the mineral resources, in accordance with industry-accepted
practice.
The long-term gold and copper price forecasts are:
| • |
Mineral reserves:
|
| o |
US$1,650/oz Au; US$3.50/lb;
|
| • |
Mineral resources:
|
| o |
US$2,500/oz Au; US$4.40/lb.
|
The economic analysis in Chapter 1.19 uses a reverting price curve.
| 1.15.3 |
Contracts
|
There are numerous contracts in place at the Project to support mine operations. Currently there are contracts in place to cover maintenance services, fuel, explosives, grinding media, and milling
reagents. Coeur also has contracts in place for the transportation of concentrates, port services in Vancouver, and representation services related to concentrate analysis at delivery. The terms and rates for these contracts are within industry
norms. The contracts are periodically put up for bid or re-negotiated as required.
Coeur entered into, and maintains, a cooperation agreement with the SSN First Nation.
| 1.16 |
Environmental, Permitting and Social Considerations
|
| 1.16.1 |
Environmental Studies and Monitoring
|
The New Afton Mine was reviewed and permitted as a major mine under the BC Mines Act in 2007 and received BC Environmental Management Act permits in 2010. The M-229 permit was issued under the Mines
Act and is administered by the Ministry of Mining and Critical Minerals. The Effluent Discharge permit 100224 and Air Discharge permit 100223 were issued under the Environmental Management Act and administered by the Ministry of Environment and
Parks.
The New Afton Operations are in compliance with all current permit conditions and requirements and there are no outstanding environmental issues. Environmental monitoring for air quality, ambient
noise and vibration, geochemistry, surface water quality, groundwater quality, aquatic resources, flora and fauna, are completed regularly and reported per permit conditions.
|
New Afton Operations
British Columbia
Technical Report Summary
|
| 1.16.2 |
Closure and Reclamation Considerations
|
The most recent reclamation liability cost estimate for the New Afton Operations, as submitted to the MCM on November 1, 2024, is approximately C$70.4 million (US$ 51 million). It assumes
approximately C$30.4 million (US$ 22 million) for post-closure monitoring and maintenance over the following 100 years. Based on the standard regulatory discount rates applicable in British Columbia, the NPV of the post-closure monitoring and
maintenance costs is approximately C$8.1 million (US$ 5.9 million), while the conventional closure works cost is not subject to discount. This gives a total NPV of approximately C$48.2 million (US$ 34.9 million). Since BC regulations will not allow
discount of the total reclamation liability cost estimate below C$50 million (US$ 36.2 million); the current bonding for the site is fixed at C$50 million (US$ 36.2 million). All amounts were converted from Canadian dollars to United States dollars
at a rate of US$1 to C$1.38.
| 1.16.3 |
Permitting
|
New Afton submitted a Mines Act Permit Amendment on January 12, 2026, seeking amendment to the M-229 Mines Act Permit. This authorization is to allow the
stope mining of East Extension and includes the proposed K-Zone access ramp development. All other operations included in the LOM plan are fully permitted.
| 1.16.4 |
Social Considerations, Plans, Negotiations and Agreements
|
Coeur maintains strong relationships with Indigenous partners and collaborates with them on environmental and business matters. A Cooperation Agreement is in place with the SSN First Nation.
The mine is located approximately 10 km from the City of Kamloops, which has a growing population of approximately 97,000. New Afton employs most of its staff from the nearby communities.
| 1.17 |
Capital Cost Estimates
|
Capital cost estimates are at a minimum at a pre-feasibility level of confidence, having an accuracy level of ±25% and a contingency range not exceeding 15%.
Capital costs are based on budget estimates and supplier and contractor quotes, engineering designs, maintenance strategies, production plans, and recent operating history. In later years, capital
estimates are based on estimated annual operating requirements and are therefore classified as sustaining capital.
Total LOM capital is expected to be approximately US$212.6 million, including US$84.2 million of sustaining capital and $128.4 million of growth capital (Table 1‑3).
|
New Afton Operations
British Columbia
Technical Report Summary
|
Table 1‑3: LOM Sustaining Capital Cost Estimate
|
Category
|
2026
|
2027
|
2028
|
2029
|
2030
|
2031
|
2032
|
Total
|
|||||||||
|
Sustaining Capital
|
|||||||||||||||||
|
C-Zone
|
14.3
|
18.9
|
4.3
|
4.3
|
4.3
|
4.3
|
—
|
50.6
|
|||||||||
|
East Extension
|
—
|
—
|
1.1
|
2.0
|
—
|
—
|
—
|
3.1
|
|||||||||
|
Other
|
17.6
|
6.1
|
2.9
|
2.7
|
1.1
|
—
|
—
|
30.5
|
|||||||||
|
Total sustaining capital
|
32.0
|
25.0
|
8.4
|
9.0
|
5.4
|
4.3
|
—
|
84.2
|
|||||||||
|
Growth Capital
|
|||||||||||||||||
|
C-Zone
|
27.3
|
0.5
|
—
|
—
|
—
|
—
|
—
|
27.8
|
|||||||||
|
East Extension
|
0.4
|
1.2
|
34.0
|
—
|
—
|
—
|
—
|
35.5
|
|||||||||
|
K-Zone
|
17.6
|
21.7
|
21.2
|
—
|
—
|
—
|
—
|
60.5
|
|||||||||
|
Other
|
(0.6)
|
2.3
|
0.7
|
2.2
|
—
|
—
|
—
|
4.6
|
|||||||||
|
Total growth capital
|
44.6
|
25.8
|
55.9
|
2.2
|
—
|
—
|
—
|
128.4
|
|||||||||
|
Total Capital
|
76.6
|
50.8
|
64.2
|
11.2
|
5.4
|
4.3
|
—
|
212.6
|
|||||||||
Note: Numbers have been rounded.
| 1.18 |
Operating Cost Estimates
|
Operating cost estimates are at a minimum at a pre-feasibility level of confidence, having an accuracy level of ±25% and a contingency range not exceeding 15%.
The basis for the operating cost estimate is the budget and LOM plan. The production plan drove the calculation of the mining and processing costs, as the mining mobile equipment fleet, workforce,
contractors, power, and consumables requirements were calculated based on specific consumption rates. Consumable prices and labor rates are based on current contracts and agreements.
LOM operating costs are shown in Table 1‑4 and total US$1,085.6 M. Unit operating costs from 2026–2032 range from US$24.08–US$33.60/t.
|
New Afton Operations
British Columbia
Technical Report Summary
|
Table 1‑4: LOM Total Operating Cost Estimate
|
Units
|
2026
|
2027
|
2028
|
2029
|
2030
|
2031
|
2032
|
Total/
Average
|
|||||||||||
|
Operating Costs
|
|||||||||||||||||||
|
Mining
|
US$ M
|
65.7
|
65.2
|
58.7
|
83.7
|
75.7
|
69.8
|
11.6
|
430.3
|
||||||||||
|
Processing
|
US$ M
|
45.3
|
41.6
|
41.2
|
40.5
|
39.8
|
36.1
|
5.0
|
249.4
|
||||||||||
|
G&A
|
US$ M
|
66.1
|
62.1
|
59.9
|
46.4
|
42.6
|
38.2
|
4.2
|
319.5
|
||||||||||
|
Other
|
US$ M
|
12.4
|
13.5
|
12.8
|
18.7
|
14.5
|
13.3
|
1.2
|
86.4
|
||||||||||
|
Total
|
US$ M
|
189.5
|
182.4
|
172.6
|
189.2
|
172.5
|
157.3
|
22.0
|
1,085.6
|
||||||||||
|
Unit Operating Costs
|
|||||||||||||||||||
|
Mining
|
$/t mined
|
11.51
|
10.67
|
9.94
|
14.23
|
12.87
|
11.87
|
14.25
|
12.19
|
||||||||||
|
Processing
|
$/t milled
|
8.03
|
6.94
|
6.91
|
6.81
|
6.77
|
6.17
|
5.46
|
6.73
|
||||||||||
|
G&A
|
$/t milled
|
11.72
|
10.37
|
10.04
|
7.81
|
7.25
|
6.53
|
4.60
|
8.33
|
||||||||||
|
Other
|
$/t milled
|
2.21
|
2.26
|
2.14
|
3.14
|
2.46
|
2.27
|
1.28
|
2.25
|
||||||||||
|
Total
|
$/t milled
|
33.60
|
30.44
|
28.93
|
31.84
|
29.35
|
26.92
|
24.08
|
29.31
|
||||||||||
Note: Numbers have been rounded.
| 1.19 |
Economic Analysis
|
| 1.19.1 |
Forward-Looking Information
|
Results of the economic analysis represent forward- looking information that is subject to several known and unknown risks, uncertainties and other factors that may cause actual results to differ
materially from those presented here.
Other forward-looking statements in this Report include, but are not limited to: statements with respect to future metal prices and concentrate sales contracts; the estimation of mineral reserves and
mineral resources; the realization of mineral reserve estimates; the timing and amount of estimated future production; costs of production; capital expenditures; costs and timing of the development of new ore zones; permitting time lines;
requirements for additional capital; government regulation of mining operations; environmental risks; unanticipated reclamation expenses; title disputes or claims; and, limitations on insurance coverage.
Factors that may cause actual results to differ from forward-looking statements include: actual results of current reclamation activities; results of economic evaluations; changes in Project
parameters as mine and process plans continue to be refined, possible variations in mineral reserves, grade or recovery rates; geotechnical considerations during mining; failure of plant, equipment or processes to operate as anticipated; shipping
delays and regulations; accidents, labor disputes and other risks of the mining industry; and, delays in obtaining governmental approvals.
|
New Afton Operations
British Columbia
Technical Report Summary
|
| 1.19.2 |
Methodology and Assumptions
|
Coeur records its financial costs on an accrual basis and adheres to U.S. Generally Accepted Accounting Principles (GAAP).
The financial costs used for this analysis are based on the 2026 LOM budget model, which was built on a zero-based budgeting process that was validated through a historical cost comparison from the
previous financial year. Production figures in this Chapter are based on predicted equipment hours and manpower requirements needed to execute the mine plan using actual unit costs, labor rates and may vary from year to year depending on capital
and production needs.
Consumables are based upon market projections and contract pricing. Experts and bids are used for capital purchases to ensure that all costs are included in the project to avoid unbudgeted
expenditures.
All financial results are communicated to the site management team. This process results in refinements and agreements as to the validity of the cost, capital, and cash flow results. This is an
ongoing process throughout the budget and provides consistency of the results and acceptance of both short- and long-term goals.
Capitalized exploration is determined annually through the corporate office, is discretionary, and therefore not included in the economic analysis. Management fees assessed
through the corporate office are not included in the economic analysis.
The economic model metal price assumptions are outlined in Table 1‑5.
Royalties included in the cashflow analysis are based upon gold ounces mined or produced, depending upon the agreement. The analysis includes applicable mining-related and corporate income taxes
based on current laws and regulations, which are subject to change. Currently, Coeur pays no federal income tax due to historic net operating losses.
| 1.19.3 |
Economic Analysis
|
The NPV at 5% is $2,485 M. As the cashflow is based on existing operations, considerations of payback and internal rate of return are not relevant.
A summary of the financial results is provided in Table 1‑6.
The active mining operation ceases in 2032; however, closure costs are estimated to be paid out through 2032. For the purposes of the financial model, all costs incurred beyond 2032 are included in
the cash flow in the year 2032.
|
New Afton Operations
British Columbia
Technical Report Summary
|
Table 1‑5: Commodity Price Forecast Used in Cashflow Analysis
|
Units
|
2026
|
2027
|
2028
|
2029
|
2030
|
2031+
|
|||||||||
|
Gold
|
US$/oz
|
4,550
|
4,000
|
3,800
|
3,600
|
3,100
|
3,100
|
||||||||
|
Copper
|
US$/lb
|
5.00
|
5.00
|
5.00
|
5.00
|
4.50
|
4.50
|
Table 1‑6: Cashflow Summary Table
|
Item
|
Units
|
Value
|
||
|
Revenue
|
US$ M
|
4,837.4
|
||
|
Production costs
|
US$ M
|
1,108.9
|
||
|
Exploration
|
US$ M
|
23.3
|
||
|
Accretion liability
|
US$ M
|
18.9
|
||
|
Total cost and expenses
|
US$ M
|
1,151.2
|
||
|
Interest income
|
US$ M
|
3.4
|
||
|
Intercompany
|
US$ M
|
27.7
|
||
|
EBITDA
|
US$ M
|
3,655.1
|
||
|
Depreciation, depletion and amortization
|
US$ M
|
4,580.4
|
||
|
Income before taxes
|
US$ M
|
(925.3)
|
||
|
Income tax expense (benefit)
|
US$ M
|
731.1
|
||
|
Net income
|
US$ M
|
(1,656.4)
|
||
|
Add back amortization
|
US$ M
|
4,580.4
|
||
|
Add back accretion
|
US$ M
|
(47.3)
|
||
|
Add back other non-cash items
|
US$ M
|
54.4
|
||
|
Operating cash flow before working capital changes
|
US$ M
|
2,931.2
|
||
|
Working capital
|
US$ M
|
28.6
|
||
|
Operating cash flow
|
US$ M
|
2,959.6
|
||
|
Investing activities
|
US$ M
|
(222.4)
|
||
|
Interest received
|
US$ M
|
0.4
|
||
|
Other
|
US$ M
|
(2.8)
|
||
|
Payments on capital leases
|
US$ M
|
(0.2)
|
||
|
Total cash flow
|
US$ M
|
2,734.7
|
||
|
Free cash flow
|
US$ M
|
2,737.2
|
||
|
NPV Pre-Tax/After-Tax @ 5%
|
US$ M
|
3132/2,484.6
|
Note: EBITDA = earnings before interest, taxes, depreciation, and amortization. Numbers have been rounded.
|
New Afton Operations
British Columbia
Technical Report Summary
|
| 1.19.4 |
Sensitivity Analysis
|
The sensitivity of the Project to changes in metal prices, grade, capital costs, and operating cost assumptions was tested using a range of 30% above and below the base case values. The Project is
most sensitive to copper and gold prices and metal grades, less sensitive to operating cost increases, and least sensitive to capital expenditure changes and exchange rates.
The primary sensitivity is to the world economy and the effect this has upon copper and gold pricing. With block caving being a low operating costs per tonne mining method, the project carries less
world economy risk when compared to alternative underground mining methods.
| 1.20 |
Risks and Opportunities
|
| 1.20.1 |
Risks
|
Risks to the mineral resources and mineral reserves are discussed in Chapter 1.10.3 and Chapter 1.11.3.
The major risks to the New Afton Operations are associated with the following elements:
| • |
Negative variations to the copper and gold price assumptions;
|
| • |
Significant additional dilution or ore losses due to cave deviation or variations to the mine plan;
|
| • |
Oversized material or hung drawpoints during the early stages of C-Zone cave propagation, potentially limiting daily tonnage until additional drawpoints are blasted or drawpoints become free-flowing;
|
| • |
Significant delays to the completion of the tailings stabilization project, potentially impacting C-Zone production;
|
| • |
Changes in geotechnical conditions and modelling parameters, including but not limited to the following:
|
| o |
The extent and magnitude of subsidence affecting site infrastructure;
|
| o |
Convergence in underground production drifts exceeding expectations;
|
| o |
Cave growth deviation and induced stress from the C-Zone block cave impacting underground development and infrastructure.
|
| 1.20.2 |
Opportunities
|
The major opportunities are as follows:
| • |
Potential extension of mine life and improved production profile if mineral resources at the K-Zone, D-Zone, and HW Zone can be converted to mineral reserves with additional studies;
|
|
New Afton Operations
British Columbia
Technical Report Summary
|
| • |
Potential to expand mineralization and identify new zones with additional drilling;
|
| • |
Further improvements in metallurgical recoveries with process plant improvements;
|
| • |
Further reduction in cement consumption in the thickened and amended tailings plant with additional testing and analysis;
|
| • |
Overperformance of drawpoints in C-Zone pulling in residual grade from the B3 cave post closure;
|
| • |
Conversion of some or all of the measured and indicated mineral resources currently reported exclusive of mineral reserves to mineral reserves, with appropriate supporting studies;
|
| • |
Upgrade of some or all of the inferred mineral resources to higher-confidence categories with additional studies.
|
| 1.21 |
Conclusions
|
Under the assumptions in this Report, the operations evaluated show a positive cash flow over the remaining LOM. The mine plan is achievable under the set of assumptions and parameters used.
| 1.22 |
Recommendations
|
As New Afton is an operating mine, the QPs have no material recommendations to make.
|
New Afton Operations
British Columbia
Technical Report Summary
|
| 2.0 |
INTRODUCTION
|
| 2.1 |
Registrant
|
Mr. Tyler Roberts, P.Eng., Mr. Devin Wade, P.Geo., Ms. Jennifer Katchen, P.Eng., Mr. Vincent Nadeau-Benoit, P.Geo., Mr. Matthew Davis, P.Eng., and Ms. Emily O’Hara, P.Eng., prepared this technical
report summary (the Report) for Coeur Mining, Inc. (Coeur), on the New Afton copper–gold mine (the New Afton Operations or the Project) in British Columbia (BC) (Figure 2‑1).
Coeur acquired the New Afton Operations in March 2026 through its acquisition of New Gold Inc. (New Gold).
| 2.2 |
Terms of Reference
|
| 2.2.1 |
Report Purpose
|
The Report was prepared to be attached as an exhibit to support mineral property disclosure, including mineral resource and mineral reserve estimates in Coeur’s Current Report on Form 8-K.
Mineral resources and mineral reserves are reported for the underground cave and stope mining zones.
| 2.2.2 |
Terms of Reference
|
Unless otherwise indicated, all financial values are reported in United States (US) currency (US$) including all operating costs, capital costs, cash flows, taxes, revenues, expenses, and overhead
distributions.
Unless otherwise indicated, all financial values are reported in United States dollars (US$). The Canadian currency is the Canadian dollar (C$).
Unless otherwise noted, the Report uses metric units and US English.
Mineral resources and mineral reserves are reported using the definitions in Item 1300 of Regulation S–K (17 CFR Part 229) (S-K 1300) of the United States Securities and Exchange Commission.
|
New Afton Operations
British Columbia
Technical Report Summary
|
Figure 2‑1: Location of New Afton Mine
Note: Figure prepared by Coeur, 2026.
|
New Afton Operations
British Columbia
Technical Report Summary
|
| 2.3 |
Qualified Persons
|
The following Coeur employees serve as the Qualified Persons (QPs) for the Report:
| • |
Mr. Tyler Roberts, P.Eng. Strategic Planning Superintendent, New Afton Mine;
|
| • |
Mr. Devin Wade, P.Geo. Chief Exploration Geologist, New Afton Mine;
|
| • |
Ms. Jennifer Katchen, P.Eng. Metallurgical Superintendent, New Afton Mine;
|
| • |
Mr. Vincent Nadeau-Benoit, P.Geo., Director, Mineral Resources at Coeur ;
|
| • |
Mr. Matthew Davis, P.Eng. Tailings and Surface Superintendent, New Afton Mine;
|
| • |
Ms. Emily O’Hara, P.Eng. Manager, Water Strategy and Stewardship at Coeur.
|
The QPs are responsible for, or co-responsible for, the Report Chapters set out in Table 2‑1.
| 2.4 |
Site Visits and Scope of Personal Inspection
|
| 2.4.1 |
Mr. Tyler Roberts
|
Mr. Roberts works directly at the mine site with required inspection visits underground to review the minable reserve plan and resource shapes used for the determination of mineral resources., he
attends required meetings for reserve and life of mine strategy.
| 2.4.2 |
Mr. Devin Wade
|
Mr. Wade works directly at the mine site supervising all the exploration at New Afton. His main work at the site includes managing contractor compliance, review of the drill core, supervising New
Afton employees, regular field visits, reviewing drilling results, and monitoring drilling and other field activities.
| 2.4.3 |
Ms. Jennifer Katchen
|
Ms. Katchen works directly at the mine site, and this familiarity with the mine operations serves as her personal inspection. Her role is to inspect and oversee process plant operations. Activities
included direct oversight of plant performance, engagement with operations, metallurgical, and projects teams, and review of process control, throughput, and recovery performance in support of ongoing operational and planning objectives.
|
New Afton Operations
British Columbia
Technical Report Summary
|
Table 2‑1: QP Chapter Responsibilities
|
QP Name
|
Chapter Responsibility
|
||
|
Mr. Roberts
|
1.1, 1.2, 1.10.2, 1.10.3, 1.11.1, 1.11.1.2, 1.11.1.3, 1.11.2, 1.11.3, 1.12, 1.12.2, 1.15, 1.17, 1.18, 1.19, 1.20, 1.21, 1.22, 2.1, 2.2, 2.3, 2.4.1, 2.5, 2.6, 2.7, 7.4, 9.1, 9.2, 9.3.2, 9.4,
11.11, 11.12, 11.13, 12.1, 12.2, 12.3, 12.4, 12.5, 12.6, 12.7, 13.1, 13.2, 13.3, 13.4, 13.5, 13.6, 13.7, 13,8, 13.9, 13.10, 13.11, 16.1, 16.2, 16.3, 18.1, 18.2, 18.3, 19.1, 19.2, 19.3, 19.4, 19.5, 21, 22.1, 22.6, 22.7, 22.8, 22.9, 22.12,
22.14, 22.15, 22.16, 22.17, 22.18, 23, 24, 25.1, 25.2, 25.3
|
||
|
Mr. Wade
|
1.1, 1.2, 1.5, 1.6, 1.7, 1.8, 1.20, 1.21, 1.22, 2.1, 2.2, 2.3, 2.4.2, 2.5, 2.6, 2.7, 5.0, 6.1, 6.2, 6.3, 6.4, 7.1, 7.2, 8.1, 8.2, 8.3, 8.4, 8.5, 8.6, 8.7, 8.8, 8.9, 21, 22.1, 22.3, 22.4, 22.6,
22.17, 22.18, 23, 24, 25.1
|
||
|
Mr. Vincent Nadeau-Benoit
|
1.1, 1.2, 1.8, 1.10.1, 1.10.2, 1.10.3, 1.20, 1.21, 1.22, 2.1, 2.2, 2.3, 2.4.4, 2.5, 2.6, 2.7, 9.1, 9.2, 9.3.1, 9.4. 11.1, 11.2, 11.3, 11.4, 11.5, 11.6, 11.7, 11.8, 11.9, 11.10, 11.11, 11.12,
11.13, 21, 22.1, 22.3, 22.5, 22.7, 22.17, 22.18, 23, 24, 25.1
|
||
|
Ms. Katchen
|
1.1, 1.2, 1.9, 1.13, 1.20, 1.21, 1.22, 2.1, 2.2, 2.3, 2.4.3, 2.5, 2.6, 2.7, 10.1, 10.2, 10.3, 10.4, 10.5, 10.6, 14.1, 14.2, 14.3, 14.4, 14.5, 14.6, 21, 22.1, 22.10, 22.17, 22.18, 23, 24, 25.1
|
||
|
Mr. Davis
|
1.1, 1.2, 1.14, 1.20, 1.21, 1.22, 2.1, 2.2, 2.3, 2.4.5, 2.5, 2.6, 2.7, 14.4, 15.1, 15.2, 15.3, 15.4, 15.8, 15.9, 15.10, 21, 22.1, 22.11, 22.17, 22.18, 23, 24, 25.1
|
||
|
Ms. Emily O’Hara
|
1.1, 1.2, 1.3, 1.4, 1.16, 1.20, 1.21, 1.22, 2.1, 2.2, 2.3, 2.4.6, 2.5, 2.6, 2.7, 3.1, 3.2, 3.3, 3.4, 3.5, 3.6, 3.7, 3.8, 3.9, 4.1, 4.2, 4.3, 4.4, 5.0, 7.3, 13.11, 15.6, 15.7, 15.8, 17.1, 17.2,
17.3, 17.4, 17.5, 17.6, 20, 21, 22.1, 22.2, 22.13, 22.17, 22.18, 23, 24, 25.4, 25.1, 25.5, 25.6, 25.7
|
||
| 2.4.4 |
Mr. Vincent Nadeau-Benoit
|
Mr. Nadeau-Benoit visited the New Afton Mine on numerous occasions. The most recent site visits was from December 8 to December 11, 2025 and from February 2 to February 4, 2026 and was focused on
K-Zone. Mr. Nadeau-Benoit visited the core shack and inspected and reviewed K-Zone drill core from the 2024 and 2025 exploration programs. Drill core from other zones were also reviewed. Discussions took place with on-site geologists on the topics
of sampling and the logging procedure, and other protocols regarding the data collection for the drill hole database. Discussions and 3D review with the exploration team regarding the lithological and structural interpretation along the domaining
strategies were completed.
|
New Afton Operations
British Columbia
Technical Report Summary
|
| 2.4.5 |
Mr. Matthew Davis
|
Mr. Davis works directly at the mine site, his role is to supervise New Afton employees on any construction and maintenance of the tailing facilities, In addition, work with the New Afton Engineers
of Record for the tailings facilities on site for all long- and short-term planning.
| 2.4.6 |
Ms. Emily O’Hara
|
Ms. O’Hara has visited the New Afton mine on numerous occasions. The most recent site tour was the week of the 27th of October, 2025. This was for the Independent Tailings Review Board and
included visual inspections of all tailings and water storage facilities.
| 2.5 |
Report Date
|
Information in the Report is current as at December 31, 2025.
| 2.6 |
Information Sources and References
|
The reports and documents listed in Chapter 24 and Chapter 25 of this Report were used to support Report preparation.
| 2.7 |
Previous Technical Report Summaries
|
Coeur has not previously filed a technical report summary on the Project.
|
New Afton Operations
British Columbia
Technical Report Summary
|
| 3.0 |
PROPERTY DESCRIPTION
|
| 3.1 |
Property Location
|
The New Afton Mine is located approximately 350 km northeast of Vancouver in the south-central interior of British Columbia. The property is 10 km from the regional hub of Kamloops and is readily
accessible by the TransCanada Highway 1, a year-round paved road. The mine location and M-229 Mine Permit boundary was noted in Figure 2‑1.
The approximate center of the property is located at 50° 39' 39'' north, 120° 30' 54'' west. The nominal elevation of the property is approximately 700 meters above mean sea level (masl).
| 3.2 |
Ownership
|
Coeur wholly owns the New Afton Operations. Coeur acquired the operations as the result of an acquisition in March 2026, whereby a wholly-owned Coeur subsidiary acquired all of the issued and
outstanding New Gold shares.
| 3.3 |
Mineral Title
|
| 3.3.1 |
Tenure Holdings
|
Mineral title in British Columbia is acquired and maintained under the Mineral Tenure Act and its predecessor Acts (the Mineral Act and the Placer Mining Act). The Mineral Titles Branch administers
the legislation related to the acquisition, exploration, and development of mineral, placer mineral, and coal rights in British Columbia. In January of 2005, an internet-based Mineral Title administration system (Mineral Titles Online or MTO)
became active and online staking became the only way to acquire new mineral tenure in British Columbia. There are three types of mineral tenure in British Columbia:
| • |
Legacy claims (staked in the field prior to January 2005);
|
| • |
Cell claims (staked online post January 2025);
|
| • |
Mining lease (application to the Ministry, payment of fee, legal boundary survey, annual maintenance payment).
|
Coeur’s mineral tenures in the mine area comprise cell claims, legacy claims, and a mining lease (Table 3‑1). Mineral claims cover a total area of approximately 21,714 ha, and the mining lease covers
approximately 902 ha. A location plan showing the locations of the mineral tenures is provided in Figure 3‑1.
The Project area is defined by Coeur’s M-229 Mines Act Permit boundary; within this permit boundary, Coeur is authorized to complete approved surface works and mining operations as written in the
M-229 Permit document.
|
New Afton Operations
British Columbia
Technical Report Summary
|
|
Table 3‑1:
|
Mineral Tenure Summary Table
|
|
Title
Number
|
Claim Name
|
Owner
|
Title
Type
|
Title
Subtype
|
Map
Number
|
Expiry Date
|
Area
(ha)
|
||||||||
|
546063
|
282146 (100%)
|
Mineral
|
Lease
|
092I
|
2026/Nov/29
|
902.3
|
|||||||||
|
220090
|
Python No.16 FR.
|
282146 (100%)
|
Mineral
|
Claim
|
092I068
|
2025/Jul/15(P)
|
25
|
||||||||
|
220275
|
Line No.3
|
282146 (100%)
|
Mineral
|
Claim
|
092I068
|
2025/Jul/15(P)
|
25
|
||||||||
|
221488
|
Fay 1 FR
|
282146 (100%)
|
Mineral
|
Claim
|
092I068
|
2025/Jul/15(P)
|
25
|
||||||||
|
372644
|
Afton 8
|
282146 (100%)
|
Mineral
|
Claim
|
092I068
|
2029/Mar/08
|
25
|
||||||||
|
372645
|
Afton 9
|
282146 (100%)
|
Mineral
|
Claim
|
092I068
|
2029/Mar/08
|
25
|
||||||||
|
372646
|
Afton 10
|
282146 (100%)
|
Mineral
|
Claim
|
092I068
|
2029/Mar/08
|
25
|
||||||||
|
372647
|
Afton 11
|
282146 (100%)
|
Mineral
|
Claim
|
092I068
|
2029/Mar/08
|
25
|
||||||||
|
378688
|
Afton 8
|
282146 (100%)
|
Mineral
|
Claim
|
092I068
|
2032/Mar/08
|
500
|
||||||||
|
378918
|
Hugh 1
|
282146 (100%)
|
Mineral
|
Claim
|
092I068
|
2032/Jun/08
|
25
|
||||||||
|
378919
|
Hugh 2
|
282146 (100%)
|
Mineral
|
Claim
|
092I068
|
2032/Jun/08
|
25
|
||||||||
|
378920
|
Hugh 3
|
282146 (100%)
|
Mineral
|
Claim
|
092I068
|
2032/Jun/08
|
25
|
||||||||
|
378921
|
Hugh 4
|
282146 (100%)
|
Mineral
|
Claim
|
092I068
|
2032/Jun/08
|
25
|
||||||||
|
378922
|
Hugh 5
|
282146 (100%)
|
Mineral
|
Claim
|
092I068
|
2032/Jun/08
|
25
|
||||||||
|
379304
|
Afton 19
|
282146 (100%)
|
Mineral
|
Claim
|
092I068
|
2032/Mar/08
|
25
|
||||||||
|
406650
|
GM 69
|
282146 (100%)
|
Mineral
|
Claim
|
092I068
|
2029/Feb/01
|
500
|
||||||||
|
513980
|
282146 (100%)
|
Mineral
|
Claim
|
092I
|
2025/Jul/15(P)
|
553.2
|
|||||||||
|
514167
|
Afton
|
282146 (100%)
|
Mineral
|
Claim
|
092I
|
2032/Mar/08
|
225.1
|
||||||||
|
514194
|
282146 (100%)
|
Mineral
|
Claim
|
092I
|
2032/Mar/08
|
1,637.8
|
|
New Afton Operations
British Columbia
Technical Report Summary
|
|
Title
Number
|
Claim Name | Owner |
Title
Type
|
Title
Subtype
|
Map
Number
|
Expiry Date
|
Area
(ha)
|
||||||||
|
517047
|
Afton
|
282146 (100%)
|
Mineral
|
Claim
|
092I
|
2027/Mar/08
|
41.0
|
||||||||
|
517157
|
Afton
|
282146 (100%)
|
Mineral
|
Claim
|
092I
|
2032/Mar/08
|
204.8
|
||||||||
|
517259
|
Ajax
|
282146 (100%)
|
Mineral
|
Claim
|
092I
|
2025/Jul/15(P)
|
82.0
|
||||||||
|
517263
|
282146 (100%)
|
Mineral
|
Claim
|
092I
|
2025/Jul/15(P)
|
20.5
|
|||||||||
|
517360
|
New Afton
|
282146 (100%)
|
Mineral
|
Claim
|
092I
|
2032/Mar/08
|
20.5
|
||||||||
|
521727
|
Ajax
|
282146 (100%)
|
Mineral
|
Claim
|
092I
|
2025/Apr/30(P)
|
451.7
|
||||||||
|
521728
|
282146 (100%)
|
Mineral
|
Claim
|
092I
|
2025/Apr/30(P)
|
513.3
|
|||||||||
|
521729
|
Ajax
|
282146 (100%)
|
Mineral
|
Claim
|
092I
|
2025/Apr/30(P)
|
390.0
|
||||||||
|
524303
|
Afton Dam
|
282146 (100%)
|
Mineral
|
Claim
|
092I
|
2032/Mar/08
|
20.5
|
||||||||
|
524304
|
Afton Dam 1
|
282146 (100%)
|
Mineral
|
Claim
|
092I
|
2032/Mar/08
|
20.5
|
||||||||
|
524305
|
Afton Dam 2
|
282146 (100%)
|
Mineral
|
Claim
|
092I
|
2032/Mar/08
|
20.5
|
||||||||
|
525508
|
Afton Dam 3
|
282146 (100%)
|
Mineral
|
Claim
|
092I
|
2032/Mar/08
|
20.5
|
||||||||
|
528243
|
Smelter
|
282146 (100%)
|
Mineral
|
Claim
|
092I
|
2027/Mar/08
|
20.5
|
||||||||
|
529020
|
Copper Load
|
282146 (100%)
|
Mineral
|
Claim
|
092I
|
2032/Jan/31
|
20.5
|
||||||||
|
534787
|
AF Ext 11
|
282146 (100%)
|
Mineral
|
Claim
|
092I
|
2032/Mar/08
|
20.5
|
||||||||
|
534788
|
AF Ext 12
|
282146 (100%)
|
Mineral
|
Claim
|
092I
|
2032/Mar/08
|
20.5
|
||||||||
|
537230
|
Afton Dam 3
|
282146 (100%)
|
Mineral
|
Claim
|
092I
|
2032/Mar/08
|
41.0
|
||||||||
|
537231
|
Afton Dam 2
|
282146 (100%)
|
Mineral
|
Claim
|
092I
|
2032/Mar/08
|
41.0
|
||||||||
|
549226
|
Afton NW 5
|
282146 (100%)
|
Mineral
|
Claim
|
092I
|
2032/Mar/08
|
491.3
|
||||||||
|
549268
|
Afton NW 6
|
282146 (100%)
|
Mineral
|
Claim
|
092I
|
2032/Mar/08
|
20.5
|
|
New Afton Operations
British Columbia
Technical Report Summary
|
|
Title
Number
|
Claim Name | Owner |
Title
Type
|
Title
Subtype
|
Map
Number
|
Expiry Date |
Area
(ha)
|
||||||||
|
549270
|
Afton NW 7
|
282146 (100%)
|
Mineral
|
Claim
|
092I
|
2032/Mar/08
|
81.9
|
||||||||
|
552399
|
ML Ext 1
|
282146 (100%)
|
Mineral
|
Claim
|
092I
|
2026/Feb/20
|
20.5
|
||||||||
|
552400
|
ML Ext 2
|
282146 (100%)
|
Mineral
|
Claim
|
092I
|
2026/Feb/20
|
20.5
|
||||||||
|
594462
|
Afton EEA
|
282146 (100%)
|
Mineral
|
Claim
|
092I
|
2032/Mar/08
|
184.4
|
||||||||
|
595819
|
AJ-W
|
282146 (100%)
|
Mineral
|
Claim
|
092I
|
2025/Apr/30(P)
|
123.2
|
||||||||
|
606247
|
Afton NW 8
|
282146 (100%)
|
Mineral
|
Claim
|
092I
|
2032/Mar/08
|
81.9
|
||||||||
|
642268
|
Afton NW 9
|
282146 (100%)
|
Mineral
|
Claim
|
092I
|
2032/Mar/08
|
20.5
|
||||||||
|
650330
|
Python NW Cell
|
282146 (100%)
|
Mineral
|
Claim
|
092I
|
2025/Jul/15(P)
|
20.5
|
||||||||
|
654890
|
Iron Mask 1
|
282146 (100%)
|
Mineral
|
Claim
|
092I
|
2025/Jul/15(P)
|
20.5
|
||||||||
|
654891
|
Iron Mask 2
|
282146 (100%)
|
Mineral
|
Claim
|
092I
|
2025/Jul/15(P)
|
20.5
|
||||||||
|
765242
|
Hugh 6 Repl
|
282146 (100%)
|
Mineral
|
Claim
|
092I
|
2032/Mar/08
|
20.5
|
||||||||
|
830915
|
Afton NW 11
|
282146 (100%)
|
Mineral
|
Claim
|
092I
|
2032/Mar/08
|
20.5
|
||||||||
|
830920
|
Afton NW 12
|
282146 (100%)
|
Mineral
|
Claim
|
092I
|
2032/Mar/08
|
40.9
|
||||||||
|
830925
|
Afton NW 13
|
282146 (100%)
|
Mineral
|
Claim
|
092I
|
2032/Mar/08
|
429.2
|
||||||||
|
832096
|
Afton NW 15
|
282146 (100%)
|
Mineral
|
Claim
|
092I
|
2032/Mar/08
|
20.5
|
||||||||
|
835552
|
AJ Magnum W
|
282146 (100%)
|
Mineral
|
Claim
|
092I
|
2025/Jul/15(P)
|
41.0
|
||||||||
|
837062
|
Afton West
|
282146 (100%)
|
Mineral
|
Claim
|
092I
|
2032/Mar/08
|
430.3
|
|
855837
|
Afton NW 16
|
282146 (100%)
|
Mineral
|
Claim
|
092I
|
2032/Mar/08
|
20.5
|
||||||||
|
862155
|
Aftin NW 17
|
282146 (100%)
|
Mineral
|
Claim
|
092I
|
2032/Mar/08
|
40.9
|
||||||||
|
1011918
|
Afton NW 10
|
282146 (100%)
|
Mineral
|
Claim
|
092I
|
2032/Mar/08
|
122.8
|
|
New Afton Operations
British Columbia
Technical Report Summary
|
|
Title
Number
|
Claim Name | Owner |
Title
Type
|
Title
Subtype
|
Map
Number
|
Expiry Date |
Area
(ha)
|
||||||||
|
1016942
|
Afton NW 18
|
282146 (100%)
|
Mineral
|
Claim
|
092I
|
2032/Feb/08
|
20.4
|
||||||||
|
1023220
|
Bill1
|
282146 (100%)
|
Mineral
|
Claim
|
092I
|
2032/Mar/08
|
655.9
|
||||||||
|
1025173
|
Afton NW 19
|
282146 (100%)
|
Mineral
|
Claim
|
092I
|
2031/Jan/07
|
20.4
|
||||||||
|
1026061
|
Dorado
|
282146 (100%)
|
Mineral
|
Claim
|
092I
|
2032/Mar/08
|
102.5
|
||||||||
|
1036944
|
282146 (100%)
|
Mineral
|
Claim
|
092I
|
2025/Jul/15(P)
|
20.5
|
|||||||||
|
1038487
|
Wood Property
|
282146 (100%)
|
Mineral
|
Claim
|
092I
|
2030/Mar/27
|
1,415.4
|
||||||||
|
1038488
|
Wood Property
|
282146 (100%)
|
Mineral
|
Claim
|
092I
|
2032/Jan/08
|
451.0
|
||||||||
|
1038489
|
Wood Property
|
282146 (100%)
|
Mineral
|
Claim
|
092I
|
2032/Jan/08
|
389.5
|
||||||||
|
1042485
|
Ajax 2
|
282146 (100%)
|
Mineral
|
Claim
|
092I
|
2025/Apr/30(P)
|
389.8
|
||||||||
|
1043220
|
Nedroberts
|
282146 (100%)
|
Mineral
|
Claim
|
092I
|
2032/Mar/08
|
61.5
|
||||||||
|
1043271
|
Cherry1
|
282146 (100%)
|
Mineral
|
Claim
|
092I
|
2031/Mar/27
|
102.4
|
||||||||
|
1043793
|
282146 (100%)
|
Mineral
|
Claim
|
092I
|
2032/Mar/08
|
41.0
|
|||||||||
|
1049040
|
282146 (100%)
|
Mineral
|
Claim
|
092I
|
2032/Jan/07
|
491.4
|
|||||||||
|
1049047
|
282146 (100%)
|
Mineral
|
Claim
|
092I
|
2032/Jan/07
|
102.4
|
|||||||||
|
1050395
|
Maxine 1
|
282146 (100%)
|
Mineral
|
Claim
|
092I
|
2032/Mar/07
|
122.7
|
||||||||
|
1050396
|
Maxine 2
|
282146 (100%)
|
Mineral
|
Claim
|
092I
|
2032/Mar/07
|
327.1
|
||||||||
|
1050397
|
Copper Jack
|
282146 (100%)
|
Mineral
|
Claim
|
092I
|
2032/Mar/07
|
163.7
|
||||||||
|
1050398
|
Afton NW 1
|
282146 (100%)
|
Mineral
|
Claim
|
092I
|
2032/Mar/07
|
61.5
|
||||||||
|
1050400
|
Afton NW 2
|
282146 (100%)
|
Mineral
|
Claim
|
092I
|
2031/Mar/07
|
1125.7
|
||||||||
|
1050401
|
Afton NW 3
|
282146 (100%)
|
Mineral
|
Claim
|
092I
|
2032/Mar/07
|
1,206.8
|
|
New Afton Operations
British Columbia
Technical Report Summary
|
|
Title
Number
|
Claim Name | Owner |
Title
Type
|
Title
Subtype
|
Map
Number
|
Expiry Date |
Area
(ha)
|
||||||||
|
1050403
|
Afton NW 4
|
282146 (100%)
|
Mineral
|
Claim
|
092I
|
2031/Mar/07
|
633.9
|
||||||||
|
1050405
|
Afton NW 5
|
282146 (100%)
|
Mineral
|
Claim
|
092I
|
2032/Mar/07
|
204.6
|
||||||||
|
1055302
|
Aftom 1
|
282146 (100%)
|
Mineral
|
Claim
|
092I
|
2032/Oct/01
|
266.3
|
||||||||
|
1056644
|
Akila
|
282146 (100%)
|
Mineral
|
Claim
|
092I
|
2026/May/25
|
41.0
|
||||||||
|
1057595
|
Afton SW 1
|
282146 (100%)
|
Mineral
|
Claim
|
092I
|
2031/Jan/07
|
20.5
|
||||||||
|
1059782
|
Cherry2
|
282146 (100%)
|
Mineral
|
Claim
|
092I
|
2031/Mar/08
|
41.0
|
||||||||
|
1061368
|
282146 (100%)
|
Mineral
|
Claim
|
092I
|
2031/Jun/08
|
368.7
|
|||||||||
|
1066112
|
282146 (100%)
|
Mineral
|
Claim
|
092I
|
2027/Jan/10
|
328.2
|
|||||||||
|
1069836
|
282146 (100%)
|
Mineral
|
Claim
|
092I
|
2027/Jan/10
|
2,052.4
|
|||||||||
|
1069837
|
282146 (100%)
|
Mineral
|
Claim
|
092I
|
2027/Jan/10
|
842.0
|
|||||||||
|
1069850
|
282146 (100%)
|
Mineral
|
Claim
|
092I
|
2027/Jan/10
|
410.2
|
|||||||||
|
1071538
|
Kamloops-Beaton
|
282146 (100%)
|
Mineral
|
Claim
|
092I
|
2030/Sep/08
|
41.0
|
||||||||
|
1091113
|
282146 (100%)
|
Mineral
|
Claim
|
092I
|
2027/Jan/26
|
41.0
|
|||||||||
|
1101275
|
282146 (100%)
|
Mineral
|
Claim
|
092I
|
2027/Jan/27
|
41.0
|
|||||||||
|
1101308
|
282146 (100%)
|
Mineral
|
Claim
|
092I
|
2025/Jan/27(P)
|
61.5
|
|||||||||
|
1107397
|
282146 (100%)
|
Mineral
|
Claim
|
092I
|
2026/Sep/14
|
82.0
|
|||||||||
|
1112659
|
282146 (100%)
|
Mineral
|
Claim
|
092I
|
2026/Apr/26
|
41.0
|
|||||||||
|
1114780
|
Ajax 3
|
282146 (100%)
|
Mineral
|
Claim
|
092I
|
2025/Aug/01(P)
|
20.5
|
||||||||
|
Total area
|
21,714.2 ha
|
||||||||||||||
*(P) = Protected from expiry until March 31, 2026
|
New Afton Operations
British Columbia
Technical Report Summary
|
|
Figure 3‑1:
|
Mineral Tenure Location Plan
|
|
New Afton Operations
British Columbia
Technical Report Summary
|
The New Afton deposit is within the M-229 permit boundary. The permit area encompasses most of the mining lease area, as well as a portion of several mineral claims.
| 3.3.2 |
Tenure Maintenance Requirements
|
The New Afton Mining Lease is valid until November 2036 and is renewed annually with a cash payment due on or before the November 29 anniversary date. Work completed within the mining lease
boundary cannot be used for the annual lease renewal or on mineral claims that overlap the mining lease.
The remainder of the mineral tenure is renewed with either exploration work done on a mineral claim (including contiguous mineral claims) and submitted online in the form of a work report, or
with a ‘cash in lieu of work’ payment on the BC Mineral Titles Online website.
| 3.4 |
Surface Rights
|
Coeur holds the surface rights plus a section of Crown property (Crown land in British Columbia is land owned by the provincial government) within and adjacent to the area covered by the M-229
Permit boundary (refer to Figure 3‑1). The area held under surface rights totals 5,620.5 acres (Table 3‑2).
Most of the surface holdings were obtained from Teck Resources Limited (Teck) and its subsidiary (Afton Operating Corp.) in September 2007. Other parcels have since been added via option and
purchase agreements with several parties. The section of Crown property will revert to the Crown once Coeur’s reclamation responsibilities have been completed.
No additional rights are needed to support the life-of-mine (LOM) plan presented in this Report.
| 3.5 |
Water Rights
|
A water pipeline approximately 2.5 miles in length can deliver fresh water from Kamloops Lake to the mine site. The water pipeline and pump house facilities were purchased from Teck as part of
the purchase agreement in 2007.
Coeur has four active water licenses to withdraw water from Kamloops Lake for mining and milling operations. Section 17.4 provides additional information on permitted water use.
| 3.6 |
Royalties
|
Coeur has engaged in several royalty agreements with various third parties on relatively small parcels within the broader overall property, with one proximal to the New Afton mine.
In 2007, a Land Purchase Agreement was signed between Teck, Afton Operating Corporation, and New Gold Inc. (Coeur). Part of this agreement was a 2% net smelter royalty (NSR) on ‘the lands subject
to the agreement’ (see Figure 3‑2), which was payable to Teck or a C$12 M buyout at any time on the mineral rights. This royalty remains active, has changed hands twice, and would now be payable to Royal Gold Inc.
|
New Afton Operations
British Columbia
Technical Report Summary
|
|
Table 3‑2:
|
Surface Rights Summary Table
|
|
Property Location
|
Class
|
Parcel
Identifier
|
Account
Number/ Roll
Number
|
Name
|
Area
(ha)
|
||||||
|
Kamloops rural
|
012-988-731
|
724 000740.000
|
DL 551
|
48.6
|
|||||||
|
Kamloops rural
|
Major industry
|
013-012-541
|
724 01005.000
|
DL 893/Pot Luck Mineral Claim (surface)
|
20.9
|
||||||
|
Kamloops rural
|
Major industry
|
013-012-550
|
724 01010.000
|
DL 894/Gold Mask MC (surface)
|
20.9
|
||||||
|
Kamloops rural
|
Major industry
|
013-012-568
|
724 01015.000
|
DL 895/Midnight MC (surface)
|
9.3
|
||||||
|
Kamloops rural
|
Major industry
|
013-012-576
|
724 01020.000
|
DL 896/Bonanza MC (surface)
|
20.3
|
||||||
|
Kamloops rural
|
Major industry
|
013-012-584
|
724 01025.000
|
DL 897/Boss MC (surface)
|
20.9
|
||||||
|
Kamloops rural
|
Major industry
|
013-012-592
|
724 01030.000
|
DL 898/Nighthawk MC (surface)
|
20.0
|
||||||
|
Kamloops rural
|
Major industry
|
013-012-614
|
724 01035.000
|
DL 899/Cliff MC (surface)
|
15.4
|
||||||
|
Kamloops rural
|
Major industry
|
013-012-622
|
724 01040.000
|
DL 900/Piper MC (surface)
|
10.4
|
||||||
|
Kamloops rural
|
014-388-421
|
724 012573.005
|
50.0
|
||||||||
|
Kamloops rural
|
014-389-517
|
724 012573.010
|
14.7
|
||||||||
|
Kamloops rural
|
014-388-391
|
724 012573.020
|
64.8
|
||||||||
|
Kamloops rural
|
014-389-304
|
724 012582.055
|
15.4
|
||||||||
|
Kamloops rural
|
014-389-347
|
724 012582.060
|
12.5
|
||||||||
|
Kamloops rural
|
014-389-380
|
724 012582.065
|
9.3
|
||||||||
|
Kamloops rural
|
Business/other
|
016-315-863
|
724 02075.000
|
DL 2017
|
50.2
|
||||||
|
Kamloops rural
|
No PID
|
724 02245.000
|
DL 2172
|
1.6
|
|||||||
|
Kamloops rural
|
Major industry
|
014-421-666
|
724 12582.000
|
18.3
|
|||||||
|
Kamloops rural
|
Farm
|
014-295-857
|
724 12585.000
|
129.5
|
|||||||
|
Kamloops rural
|
Farm
|
014-295-903
|
724 12585.010
|
52.2
|
|||||||
|
Kamloops rural
|
Major industry
|
004-603-222
|
724 12585.050
|
54.1
|
|||||||
|
Kamloops rural
|
Farm
|
014-296-331
|
724 12586.000
|
129.5
|
|||||||
|
Kamloops rural
|
Farm
|
014-296-543
|
724 12586.010
|
43.4
|
|||||||
|
Kamloops rural
|
Farm
|
014-296-349
|
724 12586.020
|
64.8
|
|||||||
|
Kamloops rural
|
Farm
|
014-297-230
|
724 12587.000
|
64.8
|
|||||||
|
Kamloops rural
|
Farm
|
014-301-750
|
724 12593.000
|
129.5
|
|||||||
|
Kamloops rural
|
Farm
|
014-301-806
|
724 12594.000
|
259.0
|
|||||||
|
Kamloops rural
|
Farm
|
014-303-191
|
724 12595.000
|
64.8
|
|
New Afton Operations
British Columbia
Technical Report Summary
|
|
Property Location
|
Class |
Parcel
Identifier
|
Account
Number/ Roll
Number
|
Name |
Area
(ha)
|
||||||
|
Kamloops rural
|
Farm
|
014-308-711
|
724 12597.010
|
64.8
|
|||||||
|
Kamloops rural
|
Farm
|
014-306-221
|
724 12597.030
|
58.1
|
|||||||
|
Kamloops rural
|
Farm
|
014-314-371
|
724 12598.000
|
79.7
|
|||||||
|
Kamloops rural
|
Farm
|
014-309-149
|
724 12598.020
|
64.8
|
|||||||
|
Kamloops rural
|
Major industry
|
No PID,
new in 2009
|
724 18517.000
|
Mine Permit Area
|
2.0
|
||||||
|
Kamloops rural
|
Farm
|
014-388-251
|
724 012570.000
|
66.4
|
|||||||
|
Kamloops rural
|
Farm
|
014-388-260
|
724 012570.005
|
66.4
|
|||||||
|
Kamloops rural
|
Farm
|
014-388-278
|
724 012570.015
|
132.7
|
|||||||
|
Kamloops rural
|
Farm
|
014-388-294
|
724 012573.000
|
129.5
|
|||||||
|
Kamloops rural
|
Farm
|
014-388-316
|
724 12572.030
|
66.0
|
|||||||
|
Kamloops rural
|
Farm
|
014-388-308
|
724 12571.010
|
64.8
|
|||||||
|
Kamloops rural
|
Farm
|
014-388-324
|
724 12571.000
|
64.8
|
|||||||
|
Total area
|
2,274.54
|
Note: PID = parcel identification number
|
New Afton Operations
British Columbia
Technical Report Summary
|
|
Figure 3‑2:
|
Lands Purchase Agreement Royalty
|
|
New Afton Operations
British Columbia
Technical Report Summary
|
| 3.7 |
Agreements
|
Coeur is party to a Cooperation Agreement with the Stk'emlupsemc Te Secwepemc Nation (the SSN). The SSN consists of two First Nations communities, the Tk̓emlúps te Secwépemc and the
Skeetchestn Indian Band. The Cooperation Agreement provides that a fixed royalty amount is paid annually until the full amount is reached on January 31, 2030.
| 3.8 |
Encumbrances
|
| 3.8.1 |
Permitting Requirements
|
The New Afton Operations submitted a Mines Act Permit Amendment (MAPA) on January 12, 2026, seeking an amendment to the M-229 Mines Act Permit. This
authorization is to allow the stope mining of the East Extension area, and includes the K-Zone access development.
All other operations included in the LOM plan are fully permitted (see also discussion in Chapter 17.4).
| 3.8.2 |
Permitting Timelines
|
New Afton expects to receive authorization for mining of the East Extension and K-Zone access development in late Q3 2026.
| 3.8.3 |
Violations and Fines
|
There are no major violations or fines as understood in the mining regulatory context that have been
reported for the New Afton Operations.
| 3.9 |
Significant Factors and Risks That May Affect Access, Title or Work Programs
|
To the extent known to the QP, there are no other known significant factors and risks that may affect access, title, or the right or ability to perform work on the properties that comprise
the New Afton Operations that are not discussed in this Report.
|
New Afton Operations
British Columbia
Technical Report Summary
|
| 4.0 |
ACCESSIBILITY, CLIMATE, LOCAL RESOURCES, INFRASTRUCTURE AND PHYSIOGRAPHY
|
| 4.1 |
Physiography
|
The landscape is characterized by hilly, till-covered terrain and dispersed small alkaline water bodies. The mine site is located at about 750 m above sea level, relief adjacent to Kamloops
Lake located at 335 m above sea level. The most significant topographic features within the mining lease are the historical Afton and Pothook open pits and the reclaimed waste rock facilities (WRSFs) of the Afton Operating Corporation.
Kamloops Lake, a widening of the Thompson River, is located north of the mining lease and bisects the Afton mineral tenure.
Due to the continental semi-arid climate, vegetation consists of open grasslands and sparse pine forests. Higher elevations are more densely forested.
| 4.2 |
Accessibility
|
The New Afton Operations are located just west of the junction of the Trans-Canada Highway No. 1 with Coquihalla Highway No. 5, which both provide year-round road access. Access to the site
is by a mine road located off the Trans-Canada Highway.
The Kamloops airport is served by regular scheduled flights to Vancouver and Victoria (British Columbia), and Calgary (Alberta).
The Canadian National Railway and Canadian Pacific Railway both pass through Kamloops.
| 4.3 |
Climate
|
The Kamloops area is located in the rain shadow of the British Columbia Coast Mountains and is characterized by a semi-arid climate. Precipitation is relatively modest, averaging
approximately 257 mm annually (of which 175 mm is rainfall), with light winter snow and infrequent rain in the spring and fall. The area has warm summers, where temperatures can reach 38°C, and cool winters, during which temperatures tend
to hover around the freezing mark. During the winter, short periods of cold weather can occur where temperatures drop to as low as -29°C.
Mining operations are conducted year-round.
| 4.4 |
Infrastructure
|
The New Afton Operations are located on the south side of the Thompson River Valley, on the site of the past-producing Afton Mine.
Kamloops is a major transportation hub for highway, air, and railroad. The local economy includes healthcare, tourism, education, forestry, and mining industries. The City of Kamloops has a
population of approximately 100,000 people. The area has a ready supply of trained workers and professionals with suppliers and contractors to support heavy industry.
|
New Afton Operations
British Columbia
Technical Report Summary
|
British Columbia Hydro and Power Authority (BC Hydro) transmission lines, a FortisBC Inc. (FortisBC) natural gas pipeline, and a Pembina Pipeline Corporation (Pembina) oil pipeline
traverse the mining lease north of the historical Afton pit.
A water pipeline approximately 2.5 miles in length can deliver fresh water from Kamloops Lake to the mine site. Coeur purchased the water pipeline and pump house facilities from Teck as
part of the purchase agreement in 2007. Coeur has four active water licenses to withdraw water from Kamloops Lake for mining and milling operations.
The mine operates with a primarily employee-based workforce, supplemented by contractor support as required for project-related activities. Key socioeconomic
benefits include sustained capital and operating expenditures, positive economic impacts to external contractors and suppliers, workforce continuity supported by the extension of mine life, and ongoing benefits generated through taxes
and agreements. The New Afton Operations employ most of its staff from the nearby communities. As at December 31, 2025, the workforce totaled 652 employees, 81% of which (527 employees) were from the Kamloops region. A total of 169 of
New Afton employees identify as Indigenous (26% of the workforce) and 38 are SSN members (6% of the workforce).
The New Afton Operations have all infrastructure in place to support mining and processing activities over the planned LOM. Supporting details, including water supply, electrical power,
workforce, and consumables, are described in Chapters 13, 14, and 15 of this Report.
|
New Afton Operations
British Columbia
Technical Report Summary
|
| 5.0 |
HISTORY
|
Prior to Coeur’s Project interest, a number of companies had completed exploration and development activities.
Exploration in the area of the New Afton Mine began in the mid-1800s, as prospectors pushed into the interior of British Columbia following the Fraser and Caribou gold rushes. The Iron
Mask property, staked in 1896, was the first in the Kamloops district. A 100 ft shaft was sunk on the Pothook deposit in 1898. Mining was carried out from the turn of the 20th century through until 1927 at several gold,
copper, and silver mines including the Pothook, Iron King, Copper King, and Iron Mask. The Afton property claims were staked over the Pothook workings in 1949 by Mr. Axel Bergland. This was followed by sporadic, and largely
unsuccessful, exploration work by a number of parties through the 1950s and 1960s. Mr. Chester Millar acquired the property in the mid-1960s and formed a private company called Afton Mines Ltd. (Afton Mines) to carry out exploration
work.
The first significant mining-related activity in the Afton area commenced in 1970, when drilling by Afton Mines anomalous copper values in what ultimately became the Afton deposit. Over
45,700 m of drilling was carried out by a number of operators over the following three years.
Teck and Iso Mines Ltd. (Iso) acquired the Afton property in 1973 and initiated engineering and metallurgical studies. Commercial production commenced at the Afton open pit mine in late
1977. Mining took place at the Afton, Crescent, Pothook, and Ajax open pits. The operations closed in 1991, re-opened in 1994, closing finally in 1997.
In 1999, the Afton mining leases expired, and the ground was staked by Westridge Ltd. and Indogold Development Ltd. DRC Resources Corporation (DRC) acquired an option on the property,
staked additional claims, and in 2000 began a concerted exploration program to test the potential for additional mineralization extending beyond the Afton open pit.
From late 2004 to September 2005, following several positive technical studies and further exploration drilling conducted by DRC, an exploration decline was developed from the south
wall of the Afton pit to provide access for infill drilling, exploration drilling, and bulk sampling of the deposit. In May 2005, DRC changed its company name to New Gold Inc.
From 2005 to 2007, Hatch Ltd. (Hatch) completed a feasibility study (as defined in Canada) for a block cave mine (including East Cave, West Cave, and B3 Cave) and conventional
grinding–flotation mill operation (Hatch, 2007), New Gold approved the project and commenced underground development in 2007.
During construction, exploration drilling extended the mineralization at depth to identify what is now referred to the C-Zone. Additional drilling conducted from 2012–2016 confirmed and
delineated the zone, and the C-Zone feasibility study (as defined in Canada) was completed by New Gold in January 2015.
Since most of the significant and relevant exploration was conducted by New Gold or its predecessor, DRC, this work is described in Section 9. Table 5‑1 provides an exploration and
development history summary.
|
New Afton Operations
British Columbia
Technical Report Summary
|
|
Table 5‑1:
|
Exploration and Development History Summary Table
|
|
Year
|
Operator
|
Comment
|
||||
|
1896–1927
|
Staking of the Iron Mask property in the Kamloops area in 1896. A 30 m shaft was sunk on the Pothook deposit in 1898. Mining was carried out from the turn of the 20th century through
until 1927 at several gold, copper, and silver mines including the Pothook, Iron King, Copper King, and Iron Mask
|
|||||
|
1949–mid-1960s
|
The Afton property claims were staked over the Pothook workings in 1949 by Mr. Axel Bergland. This was followed by sporadic, and largely unsuccessful, exploration work by a number of parties
through the 1950s and 1960s.
|
|||||
|
Mid-1960s–1973
|
Mr. Chester Millar acquired the property in the mid-1960s and formed a private company called Afton Mines Ltd. (Afton Mines) to carry out exploration work. The first significant mining-related
activity in the Afton area commenced in 1970
|
|||||
|
1973–1997
|
Teck Corporation (Teck); Iso Mines Ltd. (Iso)
|
Teck and Iso acquired the Afton property in 1973 and initiated engineering and metallurgical studies. Commercial production commenced at the Afton open pit mine in late 1977. Mining took place at
the Afton, Crescent, Pothook, and Ajax pits. The mine closed in 1991, re-opened in 1994, closing finally in 1997. The Afton open pit mine processed approximately 23.0 Mt from 1977–1997 at average grades of 0.85% Cu and 0.52
g/t Au.
|
||||
|
1999–2000
|
Westridge Ltd. (Westridge), Indogold Development Ltd. (Indogold), DRC Resources Corporation (DRC)
|
In 1999, the Afton mining leases expired and the ground was staked by Westridge and Indogold. DRC acquired an option on the property, staked additional claims, and in 2000 began a concerted
exploration program to test the potential for additional mineralization extending beyond the Afton open pit.
|
||||
|
2004–2005
|
DRC
|
An exploration decline was developed from the south wall of the Afton pit to provide access for infill drilling, exploration drilling, and bulk sampling of the deposit. In May 2005, DRC changed its
company name to New Gold Inc. (New Gold).
|
||||
|
2005–2007
|
New Gold
|
Feasibility study into block caving operation including East Cave, West Cave, and B3 Cave) to feed a conventional grinding–flotation mill operation.
|
||||
|
2012
|
New Gold
|
Achieves commercial production in July 2012
|
||||
|
2012–2016
|
New Gold
|
Addition drilling identifies the C-Zone, subject to a feasibility study in 2015. A mill expansion was completed in 2015.
|
||||
|
2012–2022
|
New Gold
|
The East and West block caves, referred to as Lift 1, were mined from 2012 to 2022 and are depleted. The B3 block cave commenced in 2021 and is currently in full production.
|
||||
|
2024–2025
|
New Gold
|
The C-Zone achieved commercial production in October 2024.
K-Zone definition drilling started.
|
||||
|
2026
|
Coeur
|
Coeur acquired the operations as the result of a takeover in March 2026, whereby a wholly-owned Coeur subsidiary acquired all of the issued and outstanding New Gold shares.
|
The bulk of exploration work undertaken at New Afton by New Gold consisted of diamond drilling of the New Afton underground deposit and, to a lesser extent, other targets on the New
Afton land package.
|
New Afton Operations
British Columbia
Technical Report Summary
|
| 6.0 |
GEOLOGICAL SETTING, MINERALIZATION, AND DEPOSIT
|
| 6.1 |
Deposit Type
|
The New Afton deposit is considered to be an example of an alkalic copper–gold porphyry deposit.
Porphyry deposits are subdivided into alkalic and calc-alkalic types based on the geochemical nature of the magma and the differences in rock chemistry and styles of alteration and
mineralization. Geochemical characteristics of alkalic porphyry deposits may include the following features:
| • |
High contents of alkali metal oxides, such as sodium and potassium, relative to silica content;
|
| • |
Complex alteration paragenesis including sodic, potassic, and calc-potassic alteration;
|
| • |
Association with highly oxidized hydrothermal fluids, a magnetite-rich core, and distal hematite;
|
| • |
Locally enriched in gold and platinum-group elements.
|
| 6.2 |
Regional Geology
|
The geological history of the Canadian Cordillera has largely been shaped by collisional plate tectonics which resulted in the accretion of allochthonous terranes onto the North
American plate. The New Afton Operations are hosted within Mesozoic rocks of the Quesnel Terrane, an island-arc assemblage that was accreted onto the continental margin of North America during the Late Triassic to Early Jurassic
periods. The Quesnel Terrane forms part of the Intermontane Belt which extends from the United States border into the Yukon Territory (Figure 6‑1).
Bounded on both sides by Paleozoic to Mesozoic rocks—the Cache Creek Complex to the west and of the Kootenay Terrane to the east—the Quesnel Terrane records Late Triassic
arc-related volcanism and magmatism followed by Early to Middle Jurassic thrusting and folding associated with docking of the island-arc complex onto the North American plate. Porphyry-related mineralization occurred mainly at the
culmination stage of the island arc. Rocks of the Quesnel terrane were subsequently affected by episodic compressional events until the Cretaceous, and later by extensional deformation in the Eocene that resulted in the deposition
of Tertiary sedimentary and volcanic rocks that unconformably overlie rocks of the Quesnel Terrane.
The Quesnel Terrane hosts several other porphyry-related producing mines, such as Copper Mountain, Highland Valley Copper, Mount Polley, and Mount Milligan.
|
New Afton Operations
British Columbia
Technical Report Summary
|
|
Figure 6‑1:
|
Regional Geology Map
|
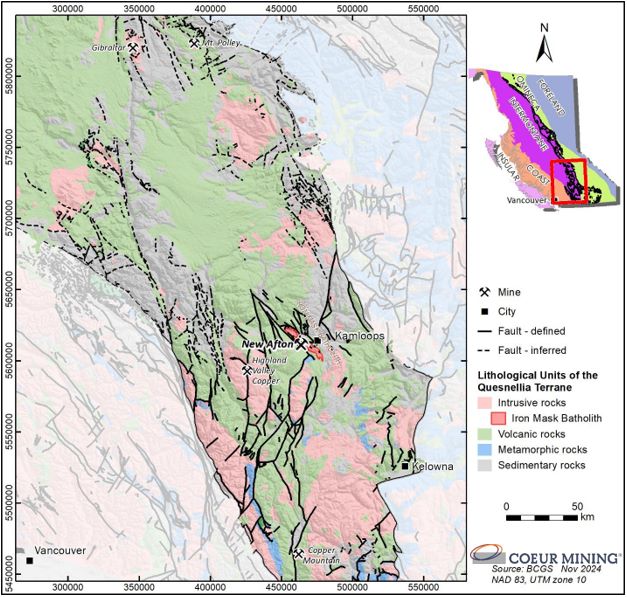
Note: Figure modified by Coeur from British Columbia Geological Survey MapPlace, 2024
|
New Afton Operations
British Columbia
Technical Report Summary
|
| 6.3 |
Local Geology
|
| 6.3.1 |
Lithological Units
|
The New Afton deposit occurs within the Quesnel Terrane at the contact between volcanic rocks of the Nicola Group and alkaline intrusions of the Iron Mask Batholith seen in
Figure 6‑2. A stratigraphic column is provided in Figure 6‑3 and the stratigraphic sequence is summarized in Table 6‑1.
| 6.3.2 |
Structure
|
Typically, no penetrative tectonic foliation is observed within the Nicola Group and Iron Mask Batholith, although rocks are generally folded and faulted. They were affected by
several generations of deformation, including faulting during compression along northwest-trending shear zones related to the island arc subduction and subsequent accretion, and extensional and strike-slip faults associated
with later crustal relaxation during the Eocene.
| 6.3.3 |
Metamorphism
|
Throughout the district, Nicola Group rocks are regionally metamorphosed to greenschist facies and locally metamorphosed to hornfels where in proximity to batholith-related
intrusions.
| 6.3.4 |
Mineralization
|
Three styles of mineralization have been identified on the New Afton deposit:
| • |
Primary hypogene mineralization characterized by chalcopyrite ± bornite as disseminations, stringers, and matrix-fill to breccias along the edge of the monzonite intrusion;
|
| • |
Late hypogene mineralization overprinting the primary hypogene in narrow and discontinuous lenses along faults, characterized by tennantite-enargite ± tetrahedrite and traces of bornite and
chalcocite;
|
| • |
Supergene native copper and lesser chalcocite formed by oxidation of the primary sulfides within upper portion of the deposit and along fault zones to about 500 m below the historic Afton
open pit.
|
Copper–gold mineralization typically occurs as east–west subvertical tabular zones of disseminations, stringers, and fracture-filling sulfides within volcanic rocks of the
Nicola Group and Pothook diorite. Host rocks have been altered and mineralized by multiple phases of monzodiorite and monzonite intrusions believed to be of Cherry Creek affinity. The monzonite intrusions are spatially
associated with mineralization, although are not generally mineralized themselves whereas the monzodiorite dykes are often well mineralized.
|
New Afton Operations
British Columbia
Technical Report Summary
|
|
Figure 6‑2:
|
Local Geology Map
|
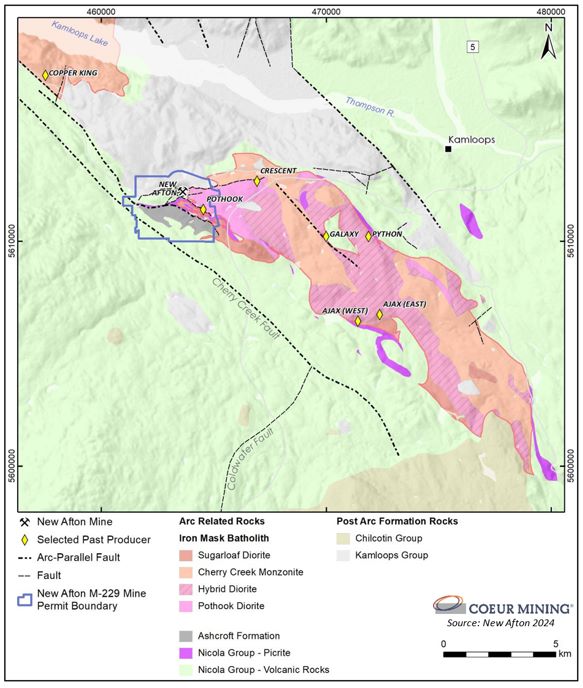
Note: Figure modified by Coeur, 2026.
|
New Afton Operations
British Columbia
Technical Report Summary
|
|
Figure 6‑3:
|
Stratigraphic Column, New Afton Deposit Area
|
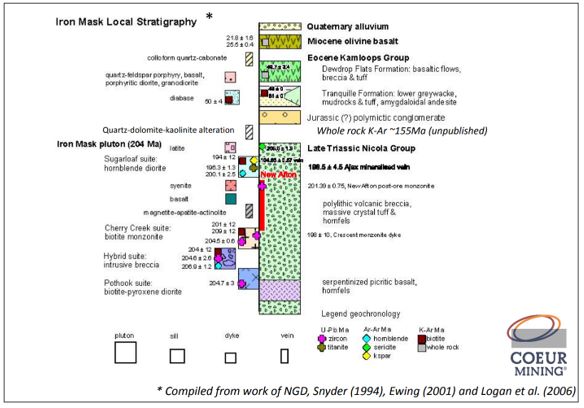
Note: Figure modified by Coeur, 2026.
|
New Afton Operations
British Columbia
Technical Report Summary
|
|
Table 6‑1:
|
Stratigraphic Table
|
|
Unit
|
Subunit
|
Description
|
||||
|
Chilcotin
Group
|
Miocene alkaline flood basalts and Miocene-Pleistocene basalt.
|
|||||
|
Kamloops
Group
|
Tranquille
Formation;
Dewdrop Flats
Formation
|
Pale to medium grey–brown. Vary in composition from mudstone to conglomerate. Pebble conglomerates are moderately sorted, clast- or matrix-supported, with rounded to subangular clasts. Pebbles
consist of chert, mudstone, and interbedded volcanic and sedimentary rocks. Bedded siltstone, mudstone, and sandstone are locally interbedded with juvenile coal seams. The sedimentary rocks are likely derived from a
proximal volcanic protolith of Eocene age. Unconformably overlie the Nicola Group and the Iron Mask Batholith.
|
||||
|
Ashcroft
Formation
|
Post-mineral Jurassic sedimentary units, interpreted to have been deposited in deep basins of the island-arc. Unconformably overlie the Nicola Group and the Iron Mask Batholith.
|
|||||
|
Latite
|
A late intrusive unit which crosscuts all mineralized intrusive and volcanic units. When fresh, the latite is a pale pinkish-beige though it is often altered to a pale grey or greenish-grey,
and sometimes colored with the distinct bright blue-green of fuchsite. The Latite unit is fine grained distinguished by the abundance of very fine needles <1mm of plagioclase, though alteration will often obscure
these; the unit also contains 5–10% anhedral mafic minerals up to 1 mm, which stand out against the often pale grey-green alteration. Geochemistry indicates the latite is fairly primitive and evolved in an anhydrous
environment which was unrelated to mineralization and earlier intrusive and volcanic units. Xenoliths of high-grade metamorphic rocks are occasionally observed which are otherwise unknown within the region.
|
|||||
|
Iron Mask
Batholith
|
Sugarloaf Diorite
|
Dykes and sills of the Sugarloaf Diorite are common towards and within the Pothook pit. This brown-grey diorite is fine- to medium-grained with 1–1.5 mm hornblende and plagioclase phenocrysts
in a fine-grained groundmass of feldspar and magnetite. Regionally, this unit has considerable textural variation and is associated with albite alteration. Primarily found south of the New Afton deposit.
|
||||
|
Lamprophyre
|
A dark, mafic intrusive unit which is late-to-post mineralization. This unit is frequently associated with strong carbonate veining and is often altered to chlorite and seen in and around major
lithological contacts and faults. Petrographic analysis indicates this unit is predominantly fibrous amphibole, often altered to chlorite, with accessory magnetite and pyrite.
|
|||||
|
Cherry Creek
Monzonite
|
in contact to the west and southwest with Nicola Group volcanic rocks and to the east and southeast with the Pothook diorite. The intrusion appears to narrow down plunge to the southwest and
splits into several thinner dikes near surface. It is partially fault-bounded and trending east- northeast through the deposit area, bending on the east side of the property to a more southeasterly trend. The principal
phase of the Cherry Creek monzonite is composed of subhedral to euhedral orthoclase, plagioclase, and biotite with accessory magnetite, hornblende, apatite, titanite, and rare zircon. Textures vary from porphyritic to
fine-grained equigranular to trachytic. It is variably altered by K-feldspar, epidote, and magnetite ± actinolite alteration.
|
|
New Afton Operations
British Columbia
Technical Report Summary
|
|
Unit
|
Subunit | Description | ||||
|
Monzodiorite
|
Light to dark orange–pink and mottled brown, porphyritic to sub-trachytic, and is primarily composed of subhedral to euhedral K-feldspar, white plagioclase laths, biotite, and hornblende, often
with accessory leucoxene. It is strongly altered to pervasive or patchy K-feldspar and biotite, and patchy to fracture-controlled black biotite-chlorite-specularite. Interpreted to be the causative intrusive phase of
high-grade bornite mineralization.
|
|||||
|
Pothook diorite
|
Grey–green, fine- to medium-grained, with crystal texture ranging from equigranular “salt and pepper” to seriate. It is primarily composed of subhedral to euhedral plagioclase, biotite, and
pyroxene. Poikilitic biotite is diagnostic, although challenging to recognize when the diorite is moderately to strongly altered.
|
|||||
|
Nicola Group
|
Picrite unit
|
the picrite unit dips steeply to the north and is typically well foliated and with sheared contacts. It is dark blue-green to black, strongly magnetic and is composed of fine- to
coarse-grained, subhedral to euhedral altered olivine crystals within moderate to strong chlorite-talc- tremolite-magnetite hornfels, with local porphyroblastic olivine ± scapolite and local zeolite-filled vesicles.
Orthocumulate, autoclastic breccia, and peperite-like textures are common.
|
||||
|
Non-fragmental
rocks
|
Non-fragmental and mostly coherent crystal tuffs and andesite flows are dominated by very fine- and fine- to medium-grained subhedral to anhedral, broken and/or embayed phenocrysts of
plagioclase ± pyroxene ± hornblende. They typically contain less than five percent by volume of coarse ash to lapilli lithic fragments within a variably altered fine-grained matrix.
|
|||||
|
Fragmental
volcanic breccias
|
Fragmental volcanic breccias comprise poorly sorted, variably colored, massive to phyric, angular to sub-rounded, lapilli- to block-sized clasts hosted in a dark chloritic volcanic matrix.
Breccias are monomictic to polymictic and contain clasts of porphyritic diorite, andesite, basalt, picrite, and aphyric volcanic rock, all enclosed within a coarse-grained crystal-rich matrix.
|
|||||
|
Nicola Group volcanic rocks dip moderately to steeply to the north; facies comprise polylithic and monolithic breccias, crystalline tuffs, and andesitic to basaltic flows. The unit can be
subdivided into a fragmental and a non-fragmental subtype.
|
|
New Afton Operations
British Columbia
Technical Report Summary
|
| 6.4 |
Property Geology
|
| 6.4.1 |
Deposit Dimensions
|
The Main Zone of the New Afton deposit occurs as a tabular, nearly vertical, southwest-plunging body measuring at least 1.4 km along strike by approximately 100 m wide, with a
down-plunge extent of over 1.5 km. The deposit remains open to the west, to the east, and at depth.
| 6.4.2 |
Lithological Units
|
The New Afton deposit is located at the northwest end of the southern pluton of the Iron Mask batholith; it straddles the contact between the Pothook diorite and volcanic rocks of
the Nicola Group (Figure 6‑4 and Figure 6‑5) The deposit is bounded to the south by a picrite unit, which is itself intruded by dikes of the Sugarloaf diorite.
Host rocks have been altered and mineralized by multiple phases of monzodiorite and monzonite intrusions believed to be of Cherry Creek affinity. The monzodiorite and monzonite
intrusions are spatially associated with mineralization, although the monzonite is not generally mineralized themselves. The monzodiorite dykes are often well mineralized.
| 6.4.3 |
Structure
|
The New Afton mine area is crosscut by a series of arc-related regional-scale brittle–ductile shear zones of various orientations including northwest-, east-, and
northeast-trending. The shear zones are commonly developed along the margins of intrusive bodies, and are interpreted to control the emplacement of the Iron Mask Batholith and related hydrothermal alteration and mineralization.
They host copper sulfide disseminations, fracture filling, and stringer veinlets along volcanic and intrusive contacts.
Later episodes of post-mineral extension reactivated these structures, leading to dextral brittle faulting along pre-existing northeast-trending shear zones and to normal movement
along pre-existing northwest-trending shear zones.
Narrow secondary structures were mineralized by an overprint of hypogene tennantite-tetrahedrite mineralization. The faulting and associated fracturing also provided conduits for
meteoric waters, which gave rise to weathering and produced the supergene alteration of the primary sulfide mineralization.
| 6.4.4 |
Alteration
|
The alteration paragenesis consists of a complex sequence of potassic to calc-potassic and propylitic alteration, in turn overprinted by fault-controlled phyllic assemblages,
followed by localized argillic alteration.
|
New Afton Operations
British Columbia
Technical Report Summary
|
|
Figure 6‑4:
|
Geology Map, New Afton Deposit
|
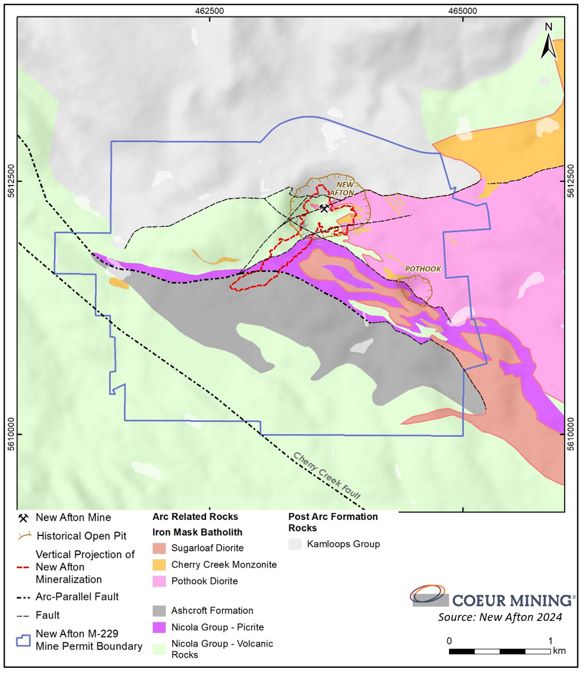
|
New Afton Operations
British Columbia
Technical Report Summary
|
|
Figure 6‑5:
|
Mineralized Zones Relative to Lithological Units
|
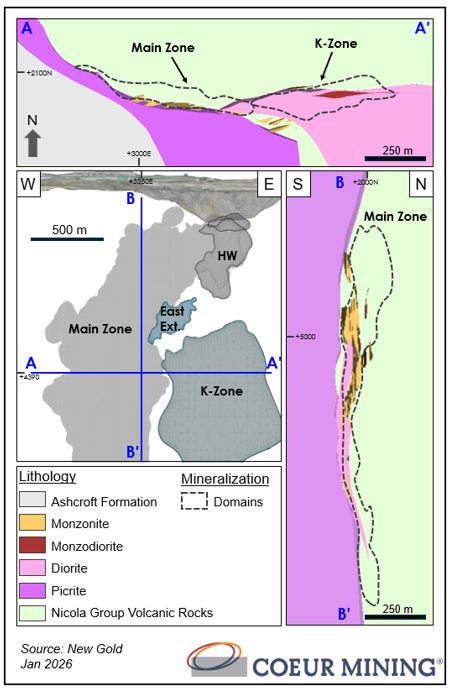
Note: Top: Horizontal section at 4390 m elevation mine grid. Left: longitudinal section looking north. Right: cross-section looking west, at 3350 mE, mine grid.
|
New Afton Operations
British Columbia
Technical Report Summary
|
Copper–gold mineralization is directly related to biotite-dominant potassic/calc–potassic alteration in the central core of the system. Alteration assemblages are categorized and
modelled into six principal alteration domains, as summarized in Table 6‑2
| 6.4.5 |
Mineralization
|
New Afton mineralized zones can be broadly categorized into three main areas: the Main Zone, Hanging wall (HW) zones, and Eastern zones (Table 6‑3 and refer to locations shown on
Figure 6‑5).
The Main Zone is a southwest-plunging tabular zone located on the western edge of the Pothook diorite; the zone extends for over 550 m along strike and over 1.5 km down-plunge. It
begins on surface as the Afton Pit and continues underground subdivided into Lift 1 East, Lift 1 West, B3, C-Zone, and D-Zone mining zones. The C-Zone mining zone of the Main Zone is the only zone currently being mined.
The HW zones are smaller satellite zones located along the southern margin of the Pothook diorite. They are roughly tabular and extend 325 m along strike and 800 m at depth.
The Eastern zones include East Extension, Upper K-Zone, and K-Zone Footwall, all located along the northern margin of the Pothook diorite. The East Extension is a tabular,
southwest-plunging zone, that extends approximately 300 m along strike and 300 m at depth. Upper K-Zone has a similar style of mineralization as East Extension and connects with the K-Zone Footwall at depth which is currently
being explored, and its absolute dimensions are not known. Its geometry follows a flower structure pattern where higher-grade lenses of hypogene mineralization are associated with focused sub-vertical fluid upflow pathways along
structures and contrasting rheological boundaries. Currently K-Zone extends for over 650 m along strike, is greater than 250 m wide and over 900 m at depth.
The mineralized zones are grouped into three broad mineralization styles: hypogene, secondary hypogene (or mesogene), and supergene (Figure 6‑6).
Hypogene refers to primary sulfide mineralization which is characterized by the presence of chalcopyrite and bornite. Hypogene mineralization is defined for core logging purposes
as containing >1% chalcopyrite or >0.5% bornite and is mainly associated with biotite alteration. Throughout the New Afton footprint, hypogene mineralization is subdivided in three distinctive styles:
| • |
Chalcopyrite-dominant mineralization hosted in Nicola Group volcanic rocks along the margins of the monzonite stocks (Main Zone and HW zones);
|
| • |
Bornite-dominant mineralization hosted in monzodiorite dikes, diorite, and volcanic rocks, located along the margins of the Pothook diorite. Monzodiorite is interpreted as causative intrusion
phase for this style of mineralization (East Extension and Upper K-Zone);
|
| • |
Chalcopyrite-dominant mineralization hosted in Nicola volcanic rocks without identification of a neighboring causative intrusion (K-Zone Footwall).
|
|
New Afton Operations
British Columbia
Technical Report Summary
|
|
Table 6‑2:
|
Alteration Types
|
|
Alteration
Type
|
Description
|
|||
|
Argillic
|
This alteration is characterized by narrow, discontinuous, buff-colored lenses of kaolinite, dolomite, and sericite that occur along faults that cut the ore body. Secondary hypogene
mineralization is associated with this post-mineral style of alteration.
|
|||
|
Phyllic
|
The phyllic alteration assemblage consists of dominantly patchy to pervasive sericite ± dolomite ± ankerite ± anhydrite ± albite, pyrite, tourmaline, and quartz. Phyllic alteration overprints
earlier potassic and propylitic alteration at the periphery of the mineralized zones and flares outward and upward. At K-Zone Footwall significant densities of quartz, anhydrite, and
carbonate veins infilling faults, breccias, and fractures constitute wide alteration envelopes surrounding major faults cross-cut earlier potassic alteration throughout the mineralized zone.
Sericite-albite-quartz-pyrite also locally overprint potassic alteration locally destroying mineralization throughout the K-Zone Footwall area.
|
|||
|
Propylitic
|
This alteration is characterized by pervasive and selective chlorite; patchy, selective to fracture- controlled epidote ± calcite replacing mafic crystals; and pyrite and magnetite throughout.
It is common in fragmental and crystalline Nicola Group volcanic rocks where epidote selectively replaces fragments and crystals. Propylitic alteration forms the outer periphery of the potassic domain. The outer limit of
this alteration is unknown.
|
|||
|
K-feldspar-
dominant
potassic
|
K-feldspar alteration occurs mainly in vein selvages as pervasive and texture- destructive alteration containing accessory biotite ± magnetite. It is hosted in all rock types except picrite and
late dykes. Commonly seen along selvages of specularite ± epidote veins, potassium feldspar alteration intensity increases with proximity to the monzonite contacts and is strongest within the monzonite. Weakly anomalous
copper grades are common but not always present within the K-feldspar alteration envelope. Bornite and elevated copper grades occur within patchy K-feldspar-altered Nicola Group volcanic rocks throughout the mineralized
zones.
|
|||
|
Biotite-
dominant
potassic
|
Biotite textures range from selective mafic mineral replacement to pervasive and texturally destructive. Biotite alteration contains accessory K-feldspar ± magnetite, and can be hosted in all
rock types except for post mineral dykes. It is most commonly hosted within Nicola volcanic rocks, diorite and monzodiorite units and is intimately associated with hypogene mineralization. Biotite alteration is present
in the monzonite but is strongest immediately adjacent to its contacts. Biotite is variably overprinted by chlorite or propylitic alteration.
|
|||
|
Calcic
|
The calcic alteration assemblage is characterized by early magnetite veins with epidote, and typically occurs within the Pothook diorite and Cherry Creek monzonite phases. Accessory minerals
include apatite, actinolite, and traces of pyrite and chalcopyrite.
|
|
New Afton Operations
British Columbia
Technical Report Summary
|
|
Table 6‑3:
|
Mineralized Zone Characteristics
|
|
Resource
Areas
|
Zone
|
Dominant Host
Lithology
|
Causative
Intrusion
|
Dominant
Alteration
|
Dominant
Mineralization
|
||||||
|
Main Zone
|
Lift 1 East
|
Diorite
|
Cherry Creek Monzonite
|
Oxidized, calc, potassic
|
Supergene
|
||||||
|
Lift 1 West
|
Nicola Group volcanic rocks
|
Cherry Creek Monzonite
|
Potassic
|
Chalcopyrite–hypogene
|
|||||||
|
B3
|
Nicola Group volcanic rocks
|
Cherry Creek Monzonite
|
Potassic
|
Chalcopyrite–hypogene
|
|||||||
|
C-Zone
|
Nicola Group volcanic rocks
|
Cherry Creek Monzonite
|
Potassic
|
Chalcopyrite–hypogene
|
|||||||
|
D-Zone
|
Nicola Group volcanic rocks
|
Cherry Creek Monzonite
|
Potassic
|
Chalcopyrite–hypogene
|
|||||||
|
Hanging wall
Zones
|
HW 1
|
Nicola Group volcanic rocks
|
Cherry Creek Monzonite
|
Calc–potassic
|
Chalcopyrite–hypogene
|
||||||
|
HW 2
|
Nicola Group volcanic rocks
|
Cherry Creek Monzonite
|
Calc–potassic
|
Chalcopyrite–hypogene
|
|||||||
|
Eastern Zones
|
East
Extension
|
Diorite
|
Monzodiorite
|
Potassic
|
Bornite–hypogene
|
||||||
|
Upper K-
Zone
|
Diorite and monzodiorite
|
Monzodiorite
|
Potassic
|
Bornite–hypogene
|
|||||||
|
K-Zone
Footwall
|
Nicola Group volcanic rocks
|
Unknown
|
Potassic and Calc-potassic
|
Chalcopyrite-hypogene
|
|
New Afton Operations
British Columbia
Technical Report Summary
|
|
Figure 6‑6:
|
Mineralization Domains within the New Afton Geological Model
|
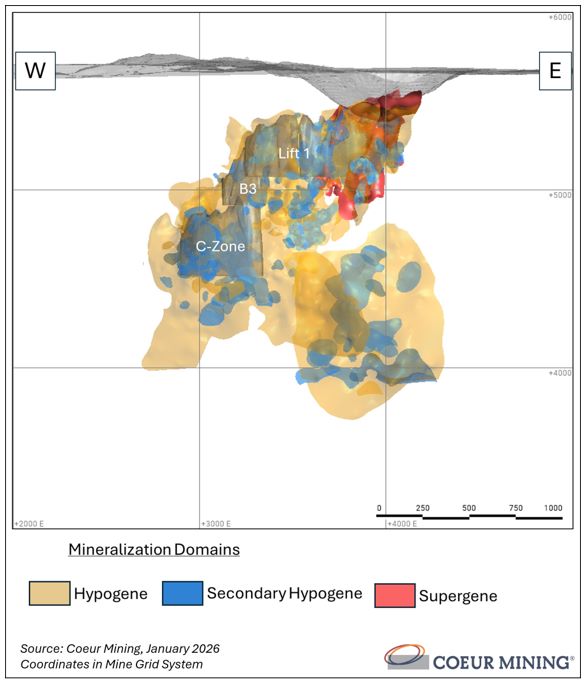
|
New Afton Operations
British Columbia
Technical Report Summary
|
Secondary hypogene mineralization is narrow, discontinuous, and commonly restricted to brittle faults. It is formed as a later overprint of tennantite–enargite + tetrahedrite,
with bornite and chalcocite rimming primary sulfide mineralization.
Supergene mineralization consists of native copper and chalcocite that formed through oxidation of primary sulfides within the uppermost portions of the deposit that were
exposed to weathering and erosion. It is defined for core logging purposes as containing 0.5% or more native copper, or, in the absence of native copper, intervals of strong oxidation (hematite and clay) with a threshold assay
of 0.2% Cu. The supergene domain is roughly conical in shape and centered below the historical Afton pit.
|
New Afton Operations
British Columbia
Technical Report Summary
|
| 7.0 |
EXPLORATION
|
| 7.1 |
Exploration
|
| 7.1.1 |
Grids and Surveys
|
Mine coordinates use a local mine grid coordinate system, in which mine grid north is rotated 50º west of UTM north (NAD83 Zone 10) and mine grid elevation (denoted by the
abbreviation “MG”) adds 5000 m to the surface elevation in UTM.
| 7.1.2 |
Geological Mapping
|
Mapping of the open pit and available outcrops surrounding the pit was conducted from 2000 onwards at various scales on the order of 1:1,000 in areas of interest to broad
regional mapping at a 1:10,000 scale. Mapping data was used to update the geological model and the district geology maps shown in Figure 7‑1 and Figure 7‑2.
Surface mapping and re-logging of core were conducted from 2012–2013 in support of the new geological model developed for the mineral resource estimate.
Detailed surface mapping in 2016 was also conducted to help inform updates to the geological model.
| 7.1.3 |
Geochemistry
|
Early-stage geochemical sampling data were superseded by drill data.
Current geochemical programs primarily relate to age dating:
In 2014 geochronology samples were submitted to Dr. Yakov Kaputsta of Actlabs in Ancaster, ON, for potassium–argon (K–Ar) dating of sericite from various lithological units
affected by post-mineral faulting. Results returned values suggesting that hydrothermal fluid flow along post- mineral faults was much younger than the precipitation of porphyry-related mineralization.
In 2023, four samples were chosen for uranium–lead (U–Pb) geochronology analysis to discern absolute ages of pre-, syn-, and post-mineral intrusive rocks in East Extension and
K-Zone. The samples were taken by the British Columbia Geological Survey whereby insufficient zircons were recovered making age dating not possible.
| 7.1.4 |
Geophysics
|
Airborne and ground-based geophysical surveys commenced in 2000. The details of these surveys are listed in Table 7‑1, and survey boundary locations are shown in Figure 7‑1.
|
New Afton Operations
British Columbia
Technical Report Summary
|
|
Table 7‑1:
|
Geophysical Surveys
|
|
Year
|
Company
|
Type
|
Line- km
|
Comments
|
|||||
|
2003
|
Peter Walcott & Associates Ltd.
|
Induced polarization
|
18 (ground)
|
Measurements made along one long southeasterly traverse over New Afton and two northwesterly traverses over Pothook
|
|||||
|
2005
|
Fugro Airborne Surveys Corp.
|
DIGHEM
|
1,323 (airborne)
|
Northwest–southeast direction extending from Copper King through New Afton and towards Ajax
|
|||||
|
2008
|
Quantec Geoscience Ltd.
|
Magnetotelluric
direct current resistivity and induced polarization
|
34.5 (airborne)
|
Oriented northwest over New Afton and extending into northlands (9 lines)
|
|||||
|
2011
|
Fugro Airborne Surveys Corp.
|
DIGHEM, magnetometer, and radiometric surveys
|
1,905 (airborne)
|
Flown over large northwest–southeast-oriented area including across Kamloops Lake, Copper King, Afton. Overlaps somewhat with 2005 survey
|
|||||
|
2016
|
Peter Walcott & Associates Ltd.
|
Magnetic and gravity
|
50.5 (ground)
22.5 (airborne)
|
Ground magnetics and gravity over Pothook and Williams Creek area
|
|||||
|
SJ Geophysics
|
Volterra 3d induced polarization and borehole IP
|
22.5 (ground)
|
Three grids south and east of New Afton pit. Borehole induced polarization survey at 124 m depth in Pothook drill hole
|
||||||
|
2019
|
Dias Geophysics
|
Induced polarization
|
108.1 (ground)
|
Completed on west of New Afton mine at Cherry Creek
|
|||||
|
SJ Geophysics
|
Induced polarization and electromagnetics
|
N/A
|
Completed on 977 m of a single borehole located underground with a surface electromagnetic loop located on the historical Afton TSF
|
||||||
| 2021 |
Simcoe Geoscience
|
Induced polarization
|
6.7 (ground)
|
Three lines across Cherry Creek, Northlands, and New Afton
|
|
New Afton Operations
British Columbia
Technical Report Summary
|
| Year | Company | Type |
Line- km
|
Comments | |||||
|
SJ Geophysics
|
Induced polarization
|
36.7 (ground)
|
Completed at Golden Corral. About 12 km southwest of New Afton mine
|
||||||
|
2023
|
SJ Geophysics
|
Induced polarization and electromagnetics
|
N/A
|
Downhole Volterra borehole electromagnetic and induced polarization survey was completed on a 1,250 m drill hole
|
|
New Afton Operations
British Columbia
Technical Report Summary
|
|
Figure 7‑1:
|
Map of Geophysical Surveys
|
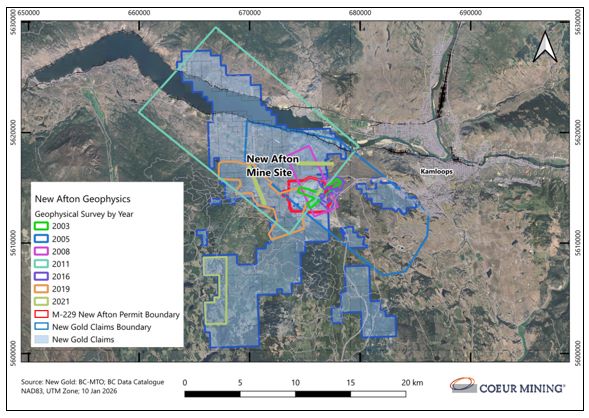
|
New Afton Operations
British Columbia
Technical Report Summary
|
| 7.1.5 |
Exploration Drifts
|
Starting in November 2004, an exploration decline was developed from the south wall of the Afton open pit to provide access for underground bulk sampling and infill
drilling, and for further exploration drilling needed determine the full extent of the mineralization. Since that time, several other exploration drifts have been developed to provide access for core drilling.
In 2022, an 85 m exploration drift was developed from the B3 level infrastructure (at mine grid elevation 4,800 m) and was used for Eastern Extension diamond drilling.
Early in 2024, a 407 m exploration drift was developed from the 5,000 m mine grid elevation to facilitate exploration drilling of the K-Zone and HW Zone. An additional 579
m exploration drift extending east from C-Zone development (4500m elevation; mine grid) began in November of 2024 and finished in May 2025, which was developed to facilitate diamond drilling east and at depth for K-Zone.
| 7.1.6 |
Other Studies
|
A number of petrographic and other studies were completed, as summarized in Table 7‑2.
| 7.1.7 |
Qualified Person’s Interpretation of the Exploration Information
|
The New Afton Operations area has been the subject of exploration and development activities since the mid-1970s, and a considerable
information database developed as a result of both exploration and mining activities. Procedures are consistent with industry-standard practices at the time the work was performed.
| 7.1.8 |
Exploration Potential
|
There is strong exploration potential down dip and down plunge of the known mineralization as well as along lithological contacts between the Nicola Group volcanic rocks
and intrusive phases of the Iron Mask Batholith (Pothook diorite and Cherry Creek monzonite).
Several of the targets proximal and laterally adjacent to the Main Zone mineralization (East Extension, K-Zone, etc.) are strongly structurally controlled by syn-mineral
faults that are likely long-lived and have been reactivated with post-mineral fault displacement.
More work is needed to unravel the structural architecture of the near-mine geological environment and post-mineral structural framework, to quantify the amount of
vertical and horizontal displacement, and to follow up on mineralization offset and displacement by post-mineral faults.
|
New Afton Operations
British Columbia
Technical Report Summary
|
|
Table 7‑2:
|
Petrographic and Other Studies Completed
|
|
Year
|
Consultant
|
Note
|
||||
|
2006
|
Vancouver
Petrographics
Limited
|
70 sample petrographic study on samples representing various mineralization and alteration styles from the 2005 core drilling program.
|
||||
|
2013
|
Vancouver
Petrographics
Limited
|
34 sample petrographic study in May; 22 sample petrographic study in December. Samples were collected from the 2012 drilling program; the majority showed strong K-feldspar alteration.
|
||||
|
Unknown
|
A 51 sample feldspar staining study was carried out during the 2013 drilling campaign. Samples selected for the study were stained by sodium cobalt nitrate and amaranth to determine if
the samples had been altered by secondary potassium feldspar. Some samples were also submitted during the 2014 drilling program. The majority showed strong K-feldspar alteration.
|
|||||
|
2016–
2019
|
Actlabs
|
Sulphur-isotope analysis on 112 hand-picked samples with sulfide-bearing minerals. Values for δ34S ranged from -26.3–33.3 per mil (isotopic unit of measurement) and
demonstrated a general zonation from depleted values proximal to mineralization to higher values with increasing distance from known mineralization
|
||||
|
2020
|
Minerva Driver
|
Artificial intelligence study completed to gain a better understanding of the New Afton deposit and to provide vectors for further underground exploration. This model, in combination
with a geochemical principal component analysis, was used to identify three broad target zones for additional investigation: the West Zone, the SE Zone, and the North Zone.
|
||||
|
2023
|
Vancouver
Petrographics
Limited
|
22 sample petrographic study on samples collected from 2022–2023 core drilling at East Extension representing various lithological units, mineralization, and alteration styles
|
||||
|
2024
|
Actlabs
|
24 samples of disseminated pyrite and anhydrite from underground drill core were collected within the haloes of phyllic-altered domains around porphyry copper–gold mineralization and
processed and analyzed for sulphur isotopes. Twenty-four handpicked sulfide and sulphate samples returned δ34S values consistent with other studies, showing a depletion towards mineralization. This
feature is being used as an exploration vector
|
||||
|
2025
|
Vancouver
Petrographics
Limited
|
15 sample petrography study on samples derived from mainly higher levels of the deposit, where the study was conducted to differentiate moderately-strongly altered intrusive phases of
monzonite-diorite.
|
|
New Afton Operations
British Columbia
Technical Report Summary
|
| 7.2 |
Drilling
|
| 7.2.1 |
Overview
|
A total of 1,712 core, reverse circulation, piezo cone penetration, vertical seismic profiling, Odex, and sonic
drill holes (601,145.21 m) have been completed in the Project area from 2000–2025. No drilling was conducted in 2004. Drilling includes drill holes completed for geotechnical, hydrogeological, metallurgical and
exploration purposes. Drill holes are both surface and underground. A summary of this drilling is included in Table 7‑3 and includes all drilling completed on the Project with exception of service holes drilled for
infrastructure. A drill collar location map for the Project area is included in Figure 7‑2.
Core drilling that supports mineral resource estimation is summarized in Table 7‑4. A collar location map and a cross section of drilling used for resource estimation can
be found in Figure 7‑3 and Figure 7‑4, respectively.
Drilling has occurred on the Project prior to 2000 but is considered historic where records are incomplete and are not reported on, and are not used in the resource
estimate. Only diamond drill holes are used for the purposes of mineral resource estimation. Distal exploration drill holes and geotechnical drill holes are also not used in estimation.
| 7.2.2 |
Drill Methods
|
Where known, drill contractors included Atlas Drilling Company (Atlas) based in Kamloops, Boisvenu Drilling Ltd. (Boisvenu) in Vancouver; Western Exploration Drilling Ltd.
(Western) in Kamloops; FORACO Drilling Ltd. (FORACO) in Kamloops; and Connors Drilling Ltd. (Connors) in Kamloops.
Core sizes included PQ (85.0 mm), HQ (63.5 mm core diameter) NQ2 (50.6 mm), NA (47.63 mm), and BQ (36.4 mm).
Geotechnical and hydrogeological core, RC, piezo cone penetration, vertical seismic profiling, Odex, and sonic drilling were completed by Geotech Drilling Services Ltd.
(Geotech) and Foraco Drilling Ltd.
| 7.2.3 |
Logging
|
Core boxes are transported to the logging building, laid out on racks, and washed with water to remove drilling mud. The core is pieced together to consolidate it, and
footage markers are converted to meters. Core lengths are measured forward and backward from each block to check for missing intervals. Boxes are then marked with hole ID, box number, and “from” and “to” depths. The
wet core is photographed while on the logging benches, with the boxes arranged in groups of four per image. Sample intervals are marked on the core using colored pencils, with sample tags stapled in the box alongside.
Core was logged into laptop computers using Maxwell Geoservices LogChief software until 2023. Subsequently, core logging information was recorded into Seequents’ MX
Deposit software.
|
New Afton Operations
British Columbia
Technical Report Summary
|
| Table 7‑3: |
Property Drill Summary Table
|
|
Year/Program
|
Collar Location
|
Drill Type
|
No. Holes
|
Meters
|
|||||
|
2000–2003
|
Surface
|
DDH
|
107
|
53,813.57
|
|||||
|
2005–2006
|
Surface
|
DDH
|
49
|
25,778.39
|
|||||
|
ODEX
|
24
|
680.55
|
|||||||
|
Underground
|
DDH
|
105
|
43,969.76
|
||||||
|
2007–2008
|
Surface
|
DDH
|
46
|
24,655.76
|
|||||
|
Underground
|
DDH
|
23
|
4,981.65
|
||||||
|
2009–2011
|
Surface
|
DDH
|
28
|
10,394.17
|
|||||
|
Underground
|
DDH
|
58
|
8,677.24
|
||||||
|
2012–2014
|
Surface
|
DDH
|
41
|
11,081.56
|
|||||
|
RC
|
50
|
3,134.93
|
|||||||
|
SONIC
|
23
|
840.45
|
|||||||
|
PCPT
|
18
|
694.10
|
|||||||
|
Underground
|
DDH
|
187
|
98,630.80
|
||||||
|
2015–2018
|
Surface
|
DDH
|
51
|
17,523.65
|
|||||
|
RC
|
50
|
4,607.22
|
|||||||
|
SONIC
|
10
|
302.74
|
|||||||
|
PCPT
|
1
|
59.85
|
|||||||
|
VSP
|
50
|
1,000.00
|
|||||||
|
Underground
|
DDH
|
56
|
26,368.87
|
||||||
|
2019–2022
|
Surface
|
DDH
|
91
|
40,242.89
|
|||||
|
RC
|
47
|
2,875.19
|
|||||||
|
SONIC
|
36
|
1,766.25
|
|||||||
|
ODEX
|
3
|
60.96
|
|||||||
|
PCPT
|
3
|
116.26
|
|||||||
|
Underground
|
DDH
|
270
|
86,934.00
|
||||||
|
2023–2025
|
Surface
|
DDH
|
49
|
22,162.65
|
|||||
|
Underground
|
DDH
|
236
|
109,791.75
|
||||||
|
Totals
|
1,712
|
601,145.21
|
|||||||
Note: DDH = diamond drill hole; RC = reverse circulation ; SONIC = sonic drilling , PCPT = piezo cone penetration testing ; VSP = vertical seismic profiling; ODEX = Odex
drilling method
|
New Afton Operations
British Columbia
Technical Report Summary
|
|
Figure 7‑2:
|
Drill Collar Location Plan, Project Area
|
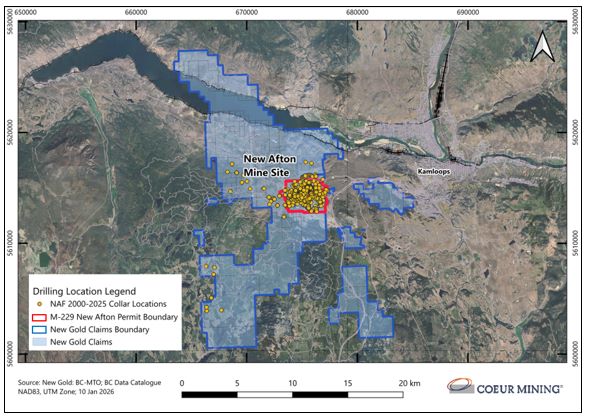
|
New Afton Operations
British Columbia
Technical Report Summary
|
|
Table 7‑4:
|
Drilling Used for Mineral Resource Estimation
|
|
Year/Program
|
Collar Location
|
Drill Type
|
No. Holes
|
Meters
|
|||||
|
2000–2003
|
Surface
|
DDH
|
93
|
47,066.38
|
|||||
|
2005–2006
|
Surface
|
DDH
|
14
|
11,160.51
|
|||||
|
Underground
|
DDH
|
105
|
44,017.00
|
||||||
|
2007–2008
|
Surface
|
DDH
|
43
|
23,081.46
|
|||||
|
Underground
|
DDH
|
23
|
4,981.65
|
||||||
|
2009–2011
|
Surface
|
DDH
|
23
|
7,746.13
|
|||||
|
Underground
|
DDH
|
52
|
8,424.18
|
||||||
|
2012–2014
|
Surface
|
DDH
|
41
|
11,081.56
|
|||||
|
Underground
|
DDH
|
183
|
98,469.20
|
||||||
|
2015–2018
|
Surface
|
DDH
|
8
|
3,491.34
|
|||||
|
Underground
|
DDH
|
51
|
24,818.85
|
||||||
|
2019–2022
|
Surface
|
DDH
|
8
|
3,043.43
|
|||||
|
Underground
|
DDH
|
272
|
86,803.85
|
||||||
|
2023–2025
|
Surface
|
DDH
|
19
|
11,062.05
|
|||||
|
Underground
|
DDH
|
230
|
106,284.20
|
||||||
|
Totals
|
1,165
|
491,531.79
|
|||||||
|
New Afton Operations
British Columbia
Technical Report Summary
|
|
Figure 7‑3:
|
Collar Locations of Drilling used for Mineral Resource Estimation
|
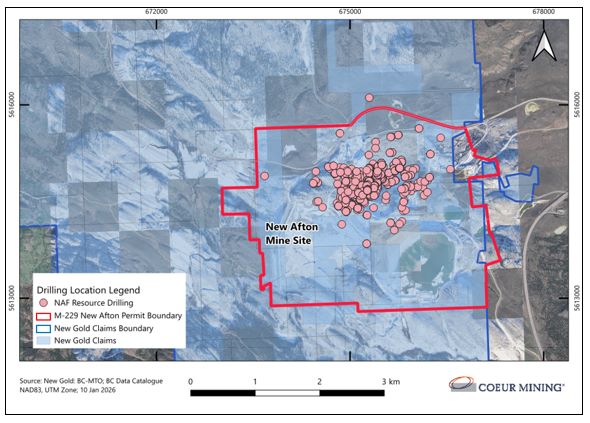
|
New Afton Operations
British Columbia
Technical Report Summary
|
|
Figure 7‑4:
|
Example Drill Section, Drilling Used In Mineral Resource Estimates
|
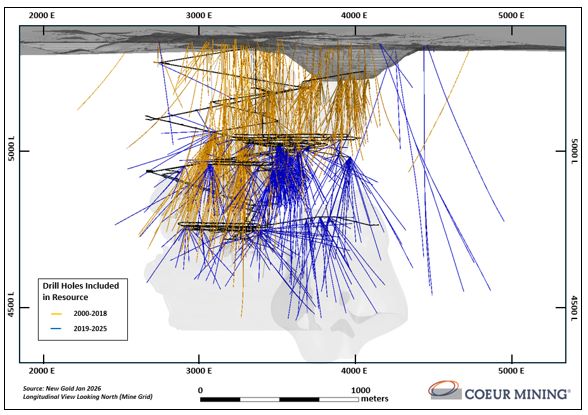
|
New Afton Operations
British Columbia
Technical Report Summary
|
Core is geologically logged for lithology, texture, alteration, and mineralogy along with structural parameters using pre-set logging templates. Geotechnical logging
includes magnetic susceptibility, specific gravity, rock quality designation (RQD), recovery, total number of joints, rock strength, joint filling, joint set angle, joint alteration, number of joint sets, joint
aperture (gap separation), and joint roughness. For oriented core, a Boart Longyear TruCore and Axis orientation system have been used, and the core is assembled in a tray and aligned with the orientation marks.
Structural orientation measurements are collected.
Magnetic susceptibility is read directly into MX Deposit via a hand-held sensor. Five measurements are taken every 30–50 cm along the core between the wooden depth
markers. These values are then averaged for the block-to-block interval.
Once in every 50 m of core, a representative core specimen is taken for point load testing. The tests are conducted using a hand-operated PIL-7 point load tester.
Pieces of broken core are collected after the test and returned to the core box.
Hyperspectral analysis of drill core began in 2019, using a Spectral Evolution OreXpress portable spectrometer that operates in the wavelength ranges of 350–2,500
nm. A white reflectance plate designed to be used as reference material is scanned every 10 samples, and at the beginning of the sample run. A hyperspectral sample is generally collected for every sample sent for
assay (every 2 m); a total of 64,498 samples have been collected to date.
| 7.2.4 |
Recovery
|
Drill holes used in the resource contained a total of 15,730 runs of core with a recovery of 98.5%.
| 7.2.5 |
Collar Surveys
|
Before 2019, drill hole collar locations were surveyed by the mine survey team prior to drilling and re-surveyed by collecting the easting, northing, elevation,
azimuth, and dip after drill hole completion. Since 2019, the orientation of the drill head is measured using a north-seeking rig alignment system such as an Imdex DeviAligner or a Reflex TN14 gyrocompass operated
by the drill operator. After the rig is aligned the mine surveyor will survey for the easting, northing, and elevation, and azimuth and dip to confirm the rig alignment tool.
| 7.2.6 |
Down Hole Surveys
|
Downhole dip and azimuth data were also measured for core drill holes by the drill contractor using a DeviGyro Overshot Xpress (OX) downhole tool.
| 7.2.7 |
Drilling Since Database Close-out Date
|
Drilling was ongoing at the Report date, with five underground diamond drill holes totaling 1,1578 m completed since the database closeout date of January 8, 2026.
The closing of the database was after the calendar year cut-off to allow all assay results from specific K-Zone exploration holes to be finalized. The post-close-out drilling was completed outside of the 2025
mineral resource constraining shapes and will have no impact on the grade or volume of the reported mineral resources.
|
New Afton Operations
British Columbia
Technical Report Summary
|
| 7.2.8 |
Comment on Material Results and Interpretation
|
Drill holes are designed to intersect mineralization as perpendicular as possible. Since drilling is limited to underground drill bays a wide range of intercept
angles are required to test the mineralization domains (intercept angles with mineralization range from 15–90º). Drill holes at low angles (below than 30º intersection with mineralization) were included in the
mineral resource estimation process but had to be supported by additional drilling closer to perpendicular angle (or at least supported by crossing holes) to support the 3D interpretation, block modelling and
final resource classification. Otherwise, classification was locally adjusted to reflect lower confidence.
Mineralized zones in the New Afton Operations are generally sub-vertical and can be adequately drilled with angled drill holes. A sufficient number of steep,
shallow, and angled drill holes have been completed to test for vertical and horizontal controls on the mineralization.
Drilling and surveying were conducted in accordance with industry standard practices at the time, and provide suitable coverage of
the mineralization. The collar and downhole survey methods used provide reliable sample locations. Logging procedures provide consistency in descriptions.
These data are considered to be suitable for mineral resource and mineral reserve estimation. There are no drilling factors known to
the QP that could materially impact the accuracy and reliability of the results.
| 7.3 |
Hydrogeology
|
| 7.3.1 |
Sampling Methods and Laboratory Determinations
|
Prior to the start of mining operations, baseline groundwater quality measurements were derived from 11 groundwater samples collected in April 2006 and June
2006. Results indicated naturally elevated concentrations of sulphate, sodium, iron, arsenic, selenium, lead, molybdenum, and zinc which exceeded thresholds in the BC Approved Water Quality Guidelines for the
Protection of Freshwater Aquatic Life. For most of the groundwater samples, pH values were consistently alkaline, indicating neutrality of groundwater near the mine site. This can be attributed to interactions
between groundwater and the sedimentary rocks/overburden, or to high carbonate content of volcanic rocks, which has the effect of developing alkaline groundwater.
| 7.3.2 |
Comment on Results
|
The requirements for groundwater and surface water are well understood, and the monitoring program is sufficient to support the LOM plan.
 |
New Afton Operations
British Columbia
Technical Report Summary
|
| 7.3.3 |
Surface Water
|
The operations do not discharge operational contact water (effluent) from the active operations. Surface water runoff and groundwater seepage from the New Afton
TSF, the Pothook TSF, and the concentrator building are captured in water management ponds, containment ponds, or the Afton Pit TSF capture zone via natural flow paths or engineered works designed to capture
and transport water to these facilities.
Some off-site flow from the historical Afton operation areas includes seasonal surface water flow from East Slough to the northeast, seepage water from the
northwestern portion of the historical Afton TSF to the Northwest Water Management Pond, and seasonal runoff from the historical northwest waste rock pile.
Surface water quality monitoring is conducted within and proximal to the mining operations as required by Permit 100224 and Permit M-229; it is summarized in
Coeur’s annual reports to The BC Ministry of Environment and Parks and in the Annual Reclamation Report to the BC Ministry of Mining and Critical Minerals.
In accordance with surface water monitoring procedures, water samples are analyzed for general chemical parameters, anions, nutrients, and total and dissolved
metals. ALS Environmental Services, a laboratory accredited by the Canadian Association for Laboratory Accreditation Inc., are contracted for all analytical work. Field blanks and duplicate samples are
collected as part of the QA/QC program.
As there are no permit limits identified for water quality, surface water quality results are compared against the BC Approved Water Quality Guidelines for the
Protection of Freshwater Aquatic Life as a point of reference. If an approved guideline is not available, the BC Working Water Quality Guidelines or Contaminated Sites Schedule 3.2 Generic Numerical Standards
are used as a reference, where applicable.
Regional surface water quality is classified as basic circumneutral, beyond very hard, and high in sulphate. Generally, water quality on site and in the
receiving environment reflects the regional water quality conditions. Some samples have yielded sulphate and selenium values exceeding thresholds set in the BC Approved Water Quality Guidelines for the
Protection of Freshwater Aquatic Life.
| 7.3.4 |
Groundwater
|
The Afton open pit is identified as a groundwater sink, with groundwater flow vectors converging on the pit. The entire mine infrastructure is within this
capture zone, with the exception of the western half of the inactive historical Afton TSF and the northwest waste rock storage location. The natural direction of groundwater flow at site is to the northwest.
Groundwater monitoring wells have been installed in overburden and bedrock horizons within the mine site at various periods prior to and during Coeur’s
operations. Currently, groundwater quality monitoring is conducted as required by Permit 100224 and is summarized in annual reports to the BC Ministry of Environment and Parks.
|
New Afton Operations
British Columbia
Technical Report Summary
|
Groundwater samples are collected as grab samples and then submitted to ALS Environmental Services for analysis. The Groundwater Management Plan includes 40
stations which are sampled quarterly or annually.
Regionally, groundwater is characterized as basic to circumneutral, beyond very hard, and high in sulphate. Groundwater water levels are generally stable with
some decreasing water table elevations. There is no indication of mine-related influence on residential wells as measured at the Cherry Creek Estates treatment plant. Groundwater concentrations are compared to
values presented in the Contaminated Sites Regulation; during sampling in 2023 values greater than regulated thresholds were identified in 34 wells as follows: sulphate (20 samples), molybdenum (18), fluoride
(13), manganese (10), chloride (7), uranium (7), selenium (2), arsenic (1), chromium (1), and zinc (1). No remedial or mitigation actions were needed based on these results.
The local hydrostratigraphy includes natural unconsolidated (i.e. overburden) and bedrock formations and structures, and anthropogenic units such as waste rock,
fills, and mine facility engineered structures. The interpreted groundwater seepage pattern is generally radial from the north, east, and south and converges toward the Afton Pit TSF, which is a groundwater
sink. Most of the groundwater flow occurs within the unconsolidated materials, with the most significant flows occurring above the bedrock contact in paleochannels which have been infilled with coarse
sediments. The primary source of groundwater to deeper bedrock which hosts the underground mine is regional groundwater flow. Due to the low porosity and permeability, significant water sources have not been
identified in the bedrock unit.
| 7.4 |
Geotechnical
|
Geotechnical properties used for underground design are collected using laboratory testing, geotechnical core logging, and face mapping of the development
rounds. The rock mass quality is classified using the following scales:
| • |
Rock quality designation (RQD);
|
| • |
Q’, after Barton et al. (1974);
|
| • |
Rock mass rating (RMR89), after Bieniawski (1989);
|
| • |
R Grade, after the International Society of Rock Mechanics (ISRM), using a dataset of unconfined compression strengths and point load testing.
|
Typical rock mass properties are shown with Q1 (25th percentile), Q3 (75th percentile) and median values per mining zone in Table 7‑5 and per lithology in Table 7‑6.
Median RMR89 values within the mineralized zones range from 61–63, indicating “good” rock quality. Q’ and RMR89 values are relatively consistent across the three
mining zones included in the Mineral Reserve estimate. R Grade values of 3–4 indicate intact rock strengths of 25–100 MPa.
The Ashcroft Formation sedimentary and picrite units are classified as “Poor” and “Fair” quality,
|
New Afton Operations
British Columbia
Technical Report Summary
|
|
Table 7‑5:
|
Geotechnical Properties By Mining Zone |
| Mining Zone |
RQD
(%)
|
Q’ |
RMR89 |
R Grade
(intact strength
estimates)
|
|||||||||||||||||||||
| Q1 | Q3 | Median | Q1 | Q3 | Median | Q1 | Q3 | Median |
Q1
|
Q3 | Median | ||||||||||||||
|
B3 Cave
|
54
|
85
|
72
|
3.9
|
40.7
|
13.7
|
54
|
65
|
63
|
R3
|
R4
|
R3
|
|||||||||||||
|
C-Zone Cave
|
68
|
94
|
85
|
6.2
|
27.0
|
14.0
|
58
|
69
|
63
|
R3
|
R4
|
R3
|
|||||||||||||
|
East Extension
|
65
|
89
|
79
|
7.7
|
33.4
|
16.4
|
56
|
66
|
61
|
R3
|
R4
|
R3
|
|||||||||||||
|
Table 7‑6:
|
Geotechnical Properties By Lithology
|
| Lithology |
RQD
(%)
|
Q’ | RMR89 |
R Grade
(intact strength
estimates)
|
|||||||||||||||||||||
| Q1 | Q3 | Median | Q1 | Q3 | Median | Q1 | Q3 | Median | Q1 | Q3 | Median | ||||||||||||||
|
Nicola Group
volcanic rocks
|
61.8
|
90.8
|
83.2
|
6.3
|
24.9
|
12.6
|
57
|
71
|
65
|
R3
|
R4
|
R3
|
|||||||||||||
|
Diorite
|
57.9
|
87.5
|
75.4
|
6.2
|
32.6
|
14.0
|
55
|
69
|
63
|
R3
|
R4
|
R3
|
|||||||||||||
|
Fault
|
30.5
|
78.3
|
58.9
|
2.3
|
11.7
|
5.45
|
38
|
59
|
50
|
R1
|
R3
|
R2
|
|||||||||||||
|
Monzonite
|
53.8
|
84.9
|
71.1
|
4.6
|
16.6
|
8.2
|
55
|
68
|
62
|
R3
|
R4
|
R3
|
|||||||||||||
|
Picrite
|
55.6
|
89.2
|
76.7
|
4.8
|
23.3
|
11.25
|
48
|
68
|
59
|
R2
|
R3
|
R3
|
|||||||||||||
|
Ashcroft
Formation
sedimentary rocks
|
15.2
|
65.1
|
45.4
|
0.05
|
5.0
|
2.0
|
21
|
51
|
40
|
R1
|
R3
|
R2
|
|||||||||||||
respectively. They are located on the southern boundaries of the orebody, with rare occurrences of minor picrite rafts within the Nicola Group volcanic rock
unit. The lithology of these units is of importance for cave growth and subsidence modelling due to their weaker rock mass properties and risk for ore dilution and changes to subsidence trends.
| 7.4.1 |
Sampling Methods and Laboratory Determinations
|
Laboratory rock testing including 228 unconfined compressive strength (UCS) tests were conducted on selected drill core samples to characterize the rock type
intact strength properties.
In addition, point load tests provide an index for strength classification of rock material and thus provide a relative indication of intact rock strength.
Point load testing is regularly conducted on drill core by the Exploration group totaling 14,035 tests. Is50 (point load index) calculated from the tests can be used to understand the spatial variability in
the intact strength properties. The Is50 index may also be used to estimate the uniaxial compressive strength.
|
New Afton Operations
British Columbia
Technical Report Summary
|
To support K-Zone characterization an WSP Canada was requested to perform 250 uniaxial compressive strength (with strain), 35 triaxial compression and 75
Brazilian tests with results expected Q22026.
| 7.4.2 |
In Situ Rock Mass Stress
|
The in-situ rock mass stresses were determined using two methods: the Hollow Inclusions Cells (HI-Cells) from the Commonwealth Scientific and Industrial
Research Organization (CSIRO) and in-situ stress testing rock stress borehole testing from Sigra Pty. Ltd. The stress data are used for underground and surface numerical modelling work. Stress values,
horizontal stress on the northeast–southwest axis (SH), horizontal stress on the northwest–southeast axis (Sh), and vertical stress (Sv), are modelled using the following formulas, using the mine grid and
depth as the depth below surface in meters:
| • |
SH = 12.8 + 0.029 × depth;
|
| • |
Sh = 7.5 + 0.017 × depth;
|
| • |
Sv = 0.0265 × depth.
|
To support K-Zone characterization a downhole 3D stress measurement program is scheduled to be completed during 2026.
| 7.4.3 |
Comment on Results
|
A combination of historical and current geotechnical data, together with mining experience, is used in the operations. Face mapping and subsidence monitoring
reviews also provide additional input to the rockmass and surface behavior.
This data along with the structural model has generated as a three-dimensional (3D) wireframe model containing the major structures that impact the mine. The
model is updated regularly for exploration and geotechnical purposes by reviewing the structural data obtained from core logging, underground mapping, and light detection and ranging (LiDAR) scans. The
structural model, along with the lithological model, is used in numerical models to refine the status of underground and surface geotechnical stability, cave growth, and subsidence.
|
New Afton Operations
British Columbia
Technical Report Summary
|
| 8.0 |
SAMPLE PREPARATION, ANALYSES, AND SECURITY
|
| 8.1 |
Sampling Methods
|
Core samples were collected at intervals of 2–6 m, with additional samples taken at lithology breaks, from 2000 to 2003. From 2005
to 2011, samples were collected at intervals of 2 m. Trained staff cut all core samples in half with a manual saw from 2000 to 2011.
From 2012 onwards, core samples were selected at 2 m intervals and, starting in spring 2024, at lithology breaks as well. Core cutters used an Almonte
automatic core saw to split samples in half.
| 8.2 |
Sample Security Methods
|
Sample collection from drill point to laboratory relied upon the fact that samples were either always attended to, or stored in the locked on-site preparation
facility, or stored in a secure area prior to laboratory shipment. From 2012 onwards, transport of the samples from the site to the laboratory was done on a frequent basis and in a secure manner, either
delivered to the laboratory by operations staff or picked up by Activation Laboratories Limited (Actlabs) staff.
Chain-of-custody procedures consist of sample submittal forms to be sent to the laboratory with sample shipments to ensure that all samples are received by the
laboratory. In 2024, a chain of custody document was implemented to track sample transfers from the New Afton site to Actlabs staff.
Drill core is stored in core racks at New Afton Exploration site. Prior to 2012, rejects were kept at the Eco Tech Laboratories Limited (Eco Tech) office in
Kamloops, British Columbia, and pulps were securely stored at the field office. Since 2012 pulps and coarse rejects are returned to the New Afton mine site periodically and stored in secure storage containers
and crates, respectively.
| 8.3 |
Density Determinations
|
Selected samples from 2005–2011 were sent to Eco Tech for bulk density measurements using the water displacement method.
Selected samples from 2012–2014 and 2019–2022 drill campaigns were sent to Actlabs in Kamloops, British Columbia for specific gravity using wet immersion
followed by wax immersion. No bulk density measurements were performed between 2015–2018. Laboratory measurements were conducted on a total of 1,829 drill core samples.
Beginning in 2023, specific gravity determinations were completed in-house every 50 m using a water bath and calculated according to Archimedes’ Principle, by
weighing the sample when dry and then weighing it in water.
Specimens for bulk density measurements are collected every 10 m through the mineralized zones, starting at 50 m above the start of the zone. The samples
consist of intact pieces of core measuring 10–15 cm in length. Bulk density measurements were conducted on a total of 2,642 drill core samples.
|
New Afton Operations
British Columbia
Technical Report Summary
|
In 2025, a randomized 2% (50 samples) of in-house measured bulk density samples collected since 2023 were selected to verify in-house measurement accuracy. The
remaining half core was sent to Actlabs to measure using the RX16-W specific gravity (wax) on friable samples method.
| 8.4 |
Analytical and Test Laboratories
|
Eco Tech was used as the primary laboratory for the 2000–2011 drill programs. Accreditations at the time are not recorded in the database. The laboratory was
and is independent of New Afton and Coeur. Umpire laboratories used from 2000–2003 included Cominco Assay Laboratories (Cominco) and Acme Analytical Laboratories (Acme), both in Vancouver. Both laboratories
were and are independent of New Gold and Coeur. Accreditation(s) at the time of the 2000–2003 programs are not known.
From 2012–2025, Actlabs in Kamloops, British Columbia (Actlabs Kamloops) is the primary laboratory used for sample preparation and analysis. The Actlabs
Kamloops facility has ISO/IEC 17025:2017 accreditation and is independent of New Gold and Coeur. During 2024, while a new Kamloops facility was constructed, Actlabs Kamloops was responsible for sample
preparation, and analysis was performed at the Actlabs laboratory in Ancaster, Ontario (Actlabs Ancaster). The Actlabs Ancaster facility has ISO/IEC 17025:2017 accreditation and is independent of New Gold and
Coeur. The umpire laboratory is SGS Canada Incorporated, in Burnaby, British Columbia (SGS Burnaby). This laboratory is independent of Coeur, and holds ISO/IEC 17025 accreditations.
| 8.5 |
Sample Preparation
|
The 2000–2011 drill program samples sorted, documented, dried (if necessary), roll crushed to ‑10 mesh, split into 250 g sub-samples, and pulverized to 95%
-140 mesh.
From 2012 onward, samples are dried, crushed to 80% passing 2 mm, riffle split to ~1 kg and pulverized to 95% passing 105 µm.
| 8.6 |
Analysis
|
For the 2000–2003 drill programs, samples for copper metallics assay were split and pulverized into additional 250 g sub-samples of -10 mesh material. Gold and
palladium were sub-sampled to 30 g aliquots and analyzed by conventional fire assay using atomic absorption (AA) and/or inductively coupled plasma (ICP) finish. Minimum reported detection for gold and
palladium was 0.005 g/t. Copper and silver content was determined by AA using aqua regia digestion. Metallic copper (when required) included two copper assays per sample.
From 2005–2011, all samples analyzed for copper, gold, silver and palladium. If native copper was reported on the sample sheets, a metallic screen analysis was
run in addition to the regular assay. Pulps for one-in-five samples over selected intervals were run using aqua regia digestion with ICP mass spectrometer finish (ICP–MS) for 29 elements in 2005, 30 elements
in 2006, and 35 elements for the 2007–2009 programs. In 2010 and 2011, a 45-element ICP–MS was performed on all samples.
|
New Afton Operations
British Columbia
Technical Report Summary
|
From 2012 onward, a 50 g pulp sample is analyzed for gold, platinum, and palladium by fire assay with an ICP optical emission spectroscopy (OES) finish with a
lower detection limit of 2 ppb for gold and 5 ppb for platinum and palladium. When coarser gold is encountered and metallic screen is required, a representative 500 g split (from 1,000 g) is sieved at 100
mesh (149 µm). Fire assay with a gravimetric finish is performed on the entire +100 mesh and two splits on the -100-mesh fraction. The total amount of sample and the +100 mesh and -100 mesh fraction is
weighed for assay reconciliation. When native copper is observed and metallic screen requested, a representative 100 g split is used following the same metallic screen preparation and analysis as described
for gold. A 0.5 g sample is analyzed for 36 elements by four-acid digestion with an ICP–OES finish. If the copper assay value from 4A-ICPOES is >5,000 ppm, the sample is rerun using four-acid digestion and
ore grade ICP–OES for a more accurate result. From 2012–present, mercury is analyzed by cold vapor flow injection mercury system. Mercury was removed from the 4A-ICPES analytical suite, and selenium was
added, in July 2021.
| 8.7 |
Quality Assurance and Quality Control
|
From 2000 to 2003, one standard or certified reference material (standard) for copper, gold, silver, and palladium) and one blank were inserted into the sample
stream approximately every 22–23 samples. There is no information on the sources of the blanks and standards. One in nine pulp samples were re-assayed as repeats and one in 25 reject samples were re-split and
re-assayed by Eco Tech. Pulp duplicate external check samples were randomly selected and sent to Cominco and Acme.
From 2005–2011, a blank, standard, and duplicate were inserted into the sample stream every eight samples. Blanks were barren intersections of Nicola Group
lithologies. Internal Eco Tech laboratory checks consisted of at least two repeats, one blank, two re-splits, and two or three reference standards, one for copper, one for silver, or one combined
copper/silver and one for gold/palladium. Assay results and internal check results were reviewed and batches rerun if problems were observed.
Assay QA/QC measures from 2012 onward consisted of the insertion of standards for gold and copper and blanks into the sample stream at a rate of every 40
samples, together with duplicates of both pulp and coarse reject material every 20 samples. In spring 2024, the insertion rate was adjusted to include one of each QC sample type for every 30 samples, ensuring
that a minimum of one standard is present in each batch of 35 fire assay samples. In addition, Actlabs inserts a cleaning blank every 50th sample and several certified standards to verify all elements analyzed. Approximately every 50th pulp is
sent to SGS Burnaby for an external pulp duplicate check assay.
Standards for gold were primarily supplied by Geostats in Australia, and standards for copper were supplied by both Geostats (historically) and CDN
Laboratories in British Columbia (CDN). Since 2024, as Geostats standards are depleted, they are replaced by CDN standards certified for both gold and copper. Coarse blanks are unmineralized material. Pulp
preparation blanks are sourced from CDN. Both pulp and coarse blanks are added to the sample stream immediately following a high-grade core interval and at a rate of every 30 samples within larger zones.
|
New Afton Operations
British Columbia
Technical Report Summary
|
Standard and blank results are plotted against the confidence limits which are defined as three standard deviations from the certified expected value. If one
standard sample plots between 2–3 standard deviations, it is flagged and closely monitored moving forward. Should two standard samples plot between 2–3 standard deviations, this is considered a failure. Any
values >3 standard deviations are automatic failures. Failures are checked to confirm that there was no misidentification of QA/QC sample material. Once confirmed, failures are re-assayed along with five
shoulder samples on either side in the sample stream until the standard is within the error limits. Should there be more than two failures in a batch, the entire batch is re-assayed. Failures and re-assays
are always addressed immediately.
Where no high-grade intervals are noted, coarse blanks are added every 30 samples. Failures for blanks are defined as results greater than ten times the
detection limit for gold and 100 times the detection limit for copper; these failures trigger the same protocols as those followed for failures of standards.
The current practice is for a QA/QC report to be generated at the conclusion of a drill program and for resource updates. Standards and blanks are plotted in
chronological order on performance charts. For standards, lines are also plotted which represent the expected value, upper limit (+ three standard deviations), and lower limit (- three standard deviations).
Pulp, coarse reject, and external check duplicate results are plotted on scatter diagrams to check for bias and on coefficient of variation diagrams to estimate the precision.
| 8.8 |
Database
|
In 2007, DrillView was established as the single master database to manage drill data. In 2012, to bring New Afton’s practices in line with corporate
standards, New Gold personnel transferred the DrillView database to Maxwell Geosciences (MaxGeo) DataShed database. From 2012- 2019, the database was maintained and updated by a Database Administrator in
Vancouver, BC. In 2019, database management was transferred to New Afton Exploration. The database itself was hosted in the Toronto corporate office, where it was backed up hourly and weekly backups were
stored off-site at the corporate office. New Afton database administrators accessed the database through a secure remote desktop connection. In fall 2023, the database server was moved to the New Afton
Operations.
Assay results are emailed from the laboratory to the database administrator as comma-delimited (CSV) files then imported directly into DataShed using a set
import template. Stored procedures within the database process core and QC assay results into the appropriate tables and views. Once imported and processed, the database administrator validates the batch QC
samples in QAQCR (a MaxGeo QC Program) with re-assays requested as needed. When all assay data have been imported, including re-assays and final QA/QC results, the validated database is exported to
comma-delimited files and saved to the New Afton exploration server. The files are then used for geological interpretation and wireframe modelling.
|
New Afton Operations
British Columbia
Technical Report Summary
|
| 8.9 |
Qualified Person’s Opinion on Sample Preparation, Security, and Analytical Procedures
|
In the opinion of the QP, the sample preparation procedures, analytical methods, QA/QC protocols, and sample security for the samples used in mineral
resource estimation are acceptable, meet industry-standard practice, and are acceptable for mineral resource and mineral reserve estimation and mine planning purposes.
|
New Afton Operations
British Columbia
Technical Report Summary
|
| 9.0 |
DATA VERIFICATION
|
| 9.1 |
Internal Data Verification
|
Sample QA/QC data from the underground drilling program were analyzed by Ron Konst, P.Geo., an independent consultant retained by New Afton in 2006 (Konst,
2006). Some blank and standard assays were noted to be outside acceptable error limits. These were investigated and re-assayed, if appropriate, and no material changes to the assay database were made.
Internal duplicate data were analyzed to determine if any biases were present and to define the assay precision; no material biases were identified.
In 2012, New Afton personnel transferred the DrillView database to Maxwell Geosciences (MaxGeo) DataShed database, a commercial drill data management
relational database system. During this process, the database was checked for errors and corrected where necessary. The pre-2012 assay data were compared to the assay certificates, and it was found that
11 certificates from the 2006 drilling had been improperly imported. Columns of data in the assay spreadsheets had been misidentified resulting in these columns being imported to the wrong fields in the
database. This resulted in minor underestimation of gold and copper grades in some blocks in the model. New Afton reviewed the resource model and found that these errors had little impact on the mineral
reserve estimate. Other errors found included overlapping intervals in some areas where re-assays had been carried out, and inconsistencies in downhole survey data, particularly where there were changes
from one instrument to another. These inconsistencies were corrected.
A correction was applied in 2014 to the conversion of azimuths of downhole surveys measured from magnetic north to true north. Declination, or the
difference in direction between magnetic north and true north, varies due to a continual drift of the north magnetic pole. The declination correction applied to the surveys had been kept constant
throughout the history of the mine which had resulted in some significant errors in the orientation of recent holes. These were corrected in the database.
As part of a 2023 software upgrade, health check SQL scripts and recommendations were performed. Minor issues were encountered during the health check and
no issues with assays were observed. A database maintenance plan was implemented in 2023 to execute integrity checks, rebuild indexes, clean up history, and backup the database daily and weekly.
Verification performed in support of validating the subset of the data used for resource estimation typically consists of spot-checking 10% of the assay
data from a selection of drill holes that intersect the mineralized wireframe domains. Additional checks could include a comparison of the drill hole collar location data with the digital models of the
surface topography and excavation models, visual inspection of the downhole survey information, and using validation routines in Leapfrog Geo, which consisted of checking for overlapping samples and
duplicate records.
| 9.2 |
External Data Verification
|
A number of validation checks were performed in support of technical reports filed as a result of New Afton’s Canadian regulatory reporting requirements.
These are summarized in Table 9‑1.
|
New Afton Operations
British Columbia
Technical Report Summary
|
|
Table 9‑1:
|
External Data Reviews
|
|
Year
|
Company
|
Purpose
|
|||
|
2003
|
Behre Dolbear
|
Support of technical report compilation.
|
|||
|
2004
|
|||||
|
2006
|
Roscoe Postle Associates Inc. (RPA)
|
Mineral resource estimate and preparation of technical report.
|
|||
|
2009
|
Database review, preparation of technical report.
|
||||
|
2011
|
|||||
|
2020
|
Validation of pre-2018 QA/QC database
|
||||
|
2023
|
SLR Consulting Ltd. (SLR)
|
Review of mineral reserve estimates, including mine designs and schedules, cut-off values, dilution estimates, cost estimates, and mine economics.
|
|||
|
2024
|
Review of mineral reserve estimates, including mine designs and schedules, cut-off values, cave management discussion, production metrics, dilution reporting, reconciliation, cost estimates,
and mine economics.
High level review of mineral resource estimates, including geological and domain modelling, key assumptions, parameters, and mineral resources constraining strategy
|
| 9.3 |
Data Verification by Qualified Person
|
| 9.3.1 |
Mr. Nadeau-Benoit
|
Mr. Nadeau-Benoit supervised the preparation of the mineral resource estimate, and the supporting data as summarized in this Report.
He completed site visits during the 2023, 2024 and 2025 drilling campaigns and discussed (on-site and remotely) the mineral resource estimation procedures,
process and considerations of reasonable prospects of eventual economic extraction, and tabulated resource estimates with the on-site Chief Geologist, the Long-Term Planning Engineer, and Resource
Geologist.
Mr. Nadeau-Benoit has undertaken verification that included site visits, core review (on core photos and at the coreshack), review of geological data
collection and checks that the QA/QC procedures used by the New Afton Operations are consistent with standard industry practices.
He has reviewed previous database audits and QA/QC reports, and completed a validation of the current drill hole database; including a 10% cross validation
checks for the 2023, 2024 and 2025 drill programs (database against raw data for assays, survey collars and downhole surveys).
| 9.3.2 |
Mr. Roberts
|
Mr. Roberts works directly at the mine site and has reviewed the resource shapes used for the determination of mineral resources, ensuring that the shapes
are within achievable mining geometries and reflect reasonable prospects for eventual economic extraction.
|
New Afton Operations
British Columbia
Technical Report Summary
|
| 9.4 |
Qualified Person’s Opinion on Data Adequacy
|
The process of data verification for the Project was performed by third parties and Coeur personnel, including the QPs. The QPs reviewed the appropriate
reports. The QP considers that a reasonable level of verification has been completed, and that no material issues would have been left unidentified from the programs completed.
The QPs are of the opinion that the data verification programs for Project data adequately support the geological interpretations, the analytical and database
quality, and therefore support the use of the data in mineral resource and mineral reserve estimation, and in mine planning.
|
New Afton Operations
British Columbia
Technical Report Summary
|
| 10.0 |
MINERAL PROCESSING AND METALLURGICAL TESTING
|
| 10.1 |
Test Laboratories
|
Construction of the process plant was completed in 2012 with commercial production of 11,000 t/d
achieved the same year. Historical testwork on which the plant design were based included mineralogical studies, modal analysis, grinding tests, flotation tests, gravity tests, variability tests and
dewatering tests. It was determined that conventional crushing, grinding and concentration processes were appropriate given the deposit mineralogy.
Changes were made to the plant in 2018–2019 to support processing of supergene ore, including adding gravity recovery capacity to the ball mill circuit and
increasing gravity capacity in each of the tertiary and regrind circuits based on a pilot plant study at ALS Laboratories (ALS) in Kamloops. With mining of supergene ore being completed during the third
quarter of 2022, the gravity circuit operation was adjusted in 2023 to focus on recovering gold rather than native copper.
The primary independent metallurgical testwork facility used for the most recent testwork on C-Zone, East Extension and D-Zone is also ALS. Work included
chemical and mineralogical characteristics, comminution performance, and metallurgical performance of new zones to be processed through the plant. The ALS laboratory has its ISO 9001-2015 certification. ALS
has also been engaged to complete preliminary metallurgical testing for K-Zone.
The New Afton Operations have an on-site analytical laboratory that assays concentrates for sales settlement, in-process samples,
and geological samples. The on-site metallurgical laboratory is used for testing flotation reagents, grind analysis, and characterizing the behavior of new ores. The laboratory is not independent.
There is no international standard of accreditation provided for metallurgical testing laboratories or metallurgical testing techniques.
| 10.2 |
Metallurgical Testwork
|
| 10.2.1 |
C-Zone
|
In 2014, ALS completed testwork on one master and nine sub-composites to evaluate the amenability of C-Zone mineralization to
the New Afton processing flowsheet.
Sample chemical and mineralogical properties included:
| • |
Chalcopyrite was the dominant sulfide mineral in most of the samples, followed by pyrite. Bornite was also present in some samples in minor amounts;
|
| • |
Tennantite/enargite was present in most of the samples. No arsenopyrite was identified, suggesting that most of the arsenic in the samples may be associated with the copper sulfide minerals
tennantite and enargite;
|
|
New Afton Operations
British Columbia
Technical Report Summary
|
The majority of the non-sulfide gangue in all of the samples occurred as feldspars, representing approximately 23–52% by weight of the feed in the
composites.
Comminution tests showed:
| • |
The semi-autogenous mill comminution (SMC) tests derived A × b values ranging from 29–41, giving an average of approximately 36, indicating medium to hard feed material for semi-autogenous
grinding (SAG);
|
| • |
Bond rod and ball mill work indices ranged from approximately 17–20 kWh/t, and 17–19 kWh/t, respectively. The Bond work indices indicated a moderately hard to hard feed material for rod or ball
milling.
|
Recovery for the sub-composite samples was generally excellent, averaging approximately 94% for copper and 95% for gold. Gold recovery for the sub-composites
samples generally tended to follow copper recovery trends. Copper recoveries of approximately 94% and 95% were achieved in repeat rougher testing. Gold recovery to the copper rougher concentrate ranged from
90% to 94% for the two repeat tests. A higher mass recovery corresponded to a higher gold recovery of approximately 4% in the rougher concentrate.
Kinetic tests indicated:
| • |
Master composite: the three-stage dilution cleaning test measured a copper recovery of approximately 85% at a copper grade of approximately 23%. Gold recovery in the copper concentrate was
approximately 76% with the concentrate grading approximately 17.8 g/t Au;
|
| • |
Sub-composite: the three-stage dilution cleaning tests measured an average copper recovery of approximately 87% at an average copper grade of 23%. Similar to the kinetic cleaner tests, samples
with higher copper grades performed relatively better than those with lower copper grades. Gold performance generally mirrored copper performance.
|
A single locked cycle flotation test was performed on the master composite sample, with the following results:
| • |
Regrind size was slightly finer, at approximately K80 31 μm;
|
| • |
Copper recovery measured approximately 90%, while the concentrate graded 25% copper;
|
| • |
Gold recovery measured 86%, while the gold grade in the copper concentrate measured approximately 19 g/t Au.
|
Arsenic in the copper concentrate graded approximately 0.4%.
C-Zone ores were found to be amenable to processing using the current New Afton flowsheet.
|
New Afton Operations
British Columbia
Technical Report Summary
|
| 10.2.2 |
East Extension
|
One master and four sub-composites were generated in 2022 for the East Extension zone. The sub-composites were constructed to test recovery characteristics
of the four observed types of copper mineralization: secondary hypogene, low-grade hypogene, bornite-dominant, and chalcopyrite-dominant. The testing was conducted at ALS Laboratories in Kamloops except
where noted for specific comminution tests.
Comminution test results for the four sub-composites included:
| • |
Bond ball mill work indices ranged from 18.0–20.5 kWh/t, indicating a hard to very hard feed material for ball milling;
|
| • |
A 20 kg composite of the four sub-composites was constructed and sent to SGS Canada Inc. in Burnaby, BC, for SAG power index (SPI) with Comminution Economic Evaluation Tool (CEET) crusher index
determination which measures amenability to crushing on minimum 20mm particles. The SPI was 90.4 minutes, which represents the time required to grind from P80 12.5 mm to P80 1.7 mm, at the 62nd percentile of the SGS database. The A × b value derived from the SMC test was approximately 47. The composite would
be considered moderately hard in terms of SAG milling based on both the SMC and SPI tests. The CEET crusher index value was 27.5, indicating a high hardness in terms of crushing.
|
Recovery for the sub-composites was generally excellent, with rougher concentrate recoveries averaging 93.5% for copper and 90.5% for gold across the five
composites.
A single locked cycle test was performed on the master composite. From the test, 92% of copper, 91% of gold and 62% of the palladium were recovered,
producing a concentrate grade of 32.5% Cu, 16.5 g/t Au and 2.95 g/t Pd. Arsenic was also present in the concentrate, grading 0.13%.
Mineralization from the East Extension was found to be amenable to processing using the current New Afton flowsheet.
| 10.2.3 |
D-Zone
|
In 2024, one master composite and four sub-composites were tested. The sub-composites consisted of low-, medium- and high-grade hypogene mineralization and
one secondary hypogene mineralization.
Test results showed:
| • |
Copper mineralization consisted primarily of chalcopyrite (more than 95%), with tennantite, enargite and bornite;
|
| • |
SMC tests were completed on the master and secondary hypogene composites and resulted in A × b values of 30.7 and 32.7, respectively, indicating high hardness in terms of SAG milling. SPI results
for the four sub-composites ranged from 52–74 minutes, indicating medium to moderately high hardness in terms of SAG milling;
|
| • |
Bond ball mill work indices on the four sub-composites ranged from 18.0–21.0 kWh/t, indicating a hard to very hard feed material for ball milling;
|
|
New Afton Operations
British Columbia
Technical Report Summary
|
| • |
Recovery for the master and sub-composites was generally high, with combined recoveries from gravity and rougher concentrates averaging approximately 92.2% for copper
and 92.9% for gold for the master and hypogene composites, and averaging 90.2% for copper and 90.8% for gold for the secondary hypogene sub-composite.
|
| 10.2.4 |
K-Zone
|
In late 2025, metallurgical testing started on five composites and 16 sub-composites from the K-Zone. The five main composites represented variations in
zone (upper vs lower K-Zone), rock type (diorite, monzodiorite and Nicola Group volcanics) and mineralogy (primary vs secondary hypogene) for use in comminution and mineralogical testwork. The 16
sub-composites included variations in head grade within the above categories to assist in developing recovery vs head grade models using rougher and cleaner batch flotation tests. This first stage of
metallurgical testing is expected to be completed in early 2026. Additional metallurgical tests to characterize K-Zone mineralization amenability to gravity recovery, locked-cycle flotation performance
and dewatering characteristics are planned when additional drill core is available later in 2026.
| 10.2.5 |
Cleaner Circuit Upgrade
|
During 2024, alternative flotation technologies were evaluated for use in the cleaner flotation circuit.
Six flotation technologies from four different vendors were evaluated in the first phase which compared potential layouts, costs and estimated
metallurgical performance. Two of these flotation technologies were selected for pilot testing at the New Afton concentrator.
Based on the results of this testwork, layout considerations and its extensive use in similar applications, a Jameson cell was chosen for the cleaner
upgrade project. Both full and partial tank cell replacement flowsheets were considered. The selected flowsheet replaced the four third cleaner Metso 5 m3 tank cells with a single Jameson cell. The cell was commissioned in August 2025.
| 10.3 |
Recovery Estimates
|
Predictive recovery formulas were developed (based on feed grades, grind size, and throughput rate) to forecast copper and gold recoveries for the New
Afton LOM plan and financial models.
Two main mineralization types will be treated over the LOM: hypogene ore (including background material that is not classified as either hypogene,
secondary hypogene, or supergene) and secondary hypogene ore. Hypogene ore and background material form the majority of the material to be processed at 95% while secondary hypogene ore makes up the
remaining 5%.
|
New Afton Operations
British Columbia
Technical Report Summary
|
The copper recovery formulae are:
| • |
Hypogene ore and background material:
|
| o |
Recovery = −1069.725745 × Cu2 + 28.082358 x Cu + 0.71954 + (160 − P80) x 0.0008;
|
| • |
Secondary hypogene ore:
|
| o |
Recovery = (−2.12308 x 10⁻⁹ x tpod2 + 4.1 × 10⁻⁵ x t/od + 0.7218) + (−0.8 x (−0.051 − Cu) x 0.979).
|
The gold recovery formulae are:
| • |
Hypogene and background material:
|
| o |
Recovery = −0.14117 x Au2 + 0.34802 x Au + 0.65006 + (160 − P80) x 0.0008;
|
| • |
Secondary hypogene ore:
|
| o |
Recovery = (−3.22077 x 10⁻⁹ × tpod2 + 5.84 × 10⁻⁵ x t/od + 0.6886285) + (−0.0308635 x A Au2 + 0.092243 x Au − 0.033668312)
|
In these equations, Cu is the process plant copper head grade in percent, Au is the process plant gold head grade in g/t, P80 is the tertiary hydrocyclone
overflow P80 in µm, and t/od is the processing rate in tonnes per operating day.
Recovery curves for copper and gold are provided in Figure 10‑1 and Figure 10‑2 respectively.
Based on operating experience, hypogene recovery is capped at 92%. For copper grades >2%, copper recovery is constant at 85%. For gold grades >1.9
g/t, gold recovery is constant at 80%. LOM copper and gold recovery rates are estimated to be approximately 88.4% and 83.9%, respectively. East Extension hypogene copper recovery is capped at 90% due to
the relatively high proportion of copper as bornite relative to C-Zone hypogene and the requirement to process East Extension and C-Zone ores in parallel using a common reagent scheme.
| 10.4 |
Metallurgical Variability
|
Samples selected for metallurgical testing during feasibility and development studies were representative of the various styles
of mineralization within the different deposits. Samples were selected from a range of locations within the deposits. Sufficient samples were taken, and tests were performed using sufficient sample mass
for the respective tests undertaken.
Variability assessments are supported by mill production plans in terms of throughput, grind size, head grades and mineralogy.
|
New Afton Operations
British Columbia
Technical Report Summary
|
|
Figure 10‑1:
|
Copper Recovery Curves At 16,000 t/d Processing Rate
|
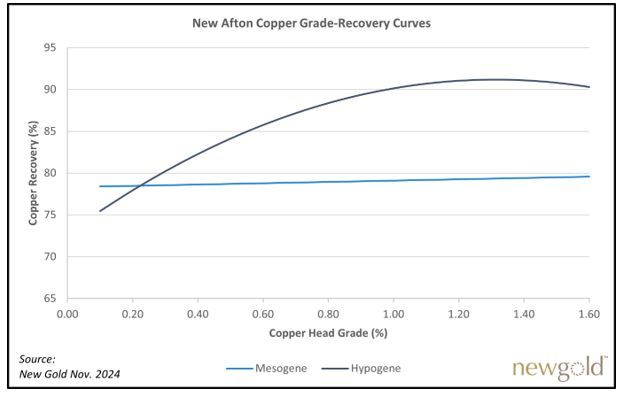
Note: mesogene = secondary hypogene.
|
New Afton Operations
British Columbia
Technical Report Summary
|
|
Figure 10‑2:
|
Gold Recovery Curves At 16,000 t/d Processing Rate
|
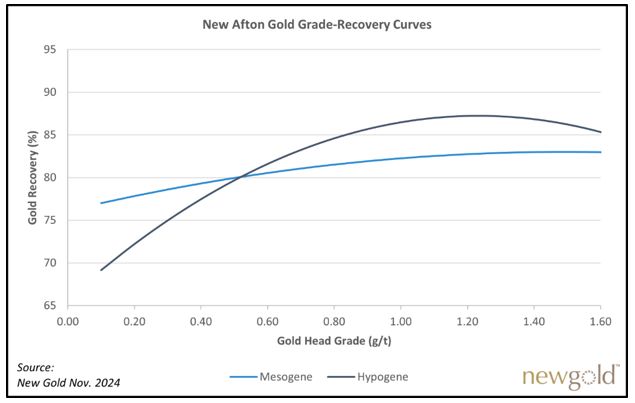
Note: mesogene = secondary hypogene.
| 10.5 |
Deleterious Elements
|
The New Afton concentrate has historically been very clean and marketable. There are no known deleterious elements that could have a significant effect on
economic extraction. Expected penalties associated with mercury and arsenic levels have been considered in the concentrate sales model.
| 10.6 |
Qualified Person’s Opinion on Data Adequacy
|
Testwork programs, both internal and external, continue to be performed to support current operations and potential improvements.
The testwork undertaken is of an adequate level to ensure an appropriate representation of metallurgical characterization and the derivation of
corresponding metallurgical recovery factors for B3, C-Zone, and East Extension.
Metallurgical assumptions are supported by multiple years of production data.
|
New Afton Operations
British Columbia
Technical Report Summary
|
Recovery improvements resulting from the cleaner circuit upgrade are expected to partly offset the impact of a coarser grind size, as the processing rate
returns to approximately 16,000 t/d.
Grade–recovery models for the various ore types were developed using processing throughput rates to inform the forecasting copper and gold recoveries for
the LOM plan.
The QP reviewed the information compiled by New Gold and Coeur, as summarized in this Report chapter and performed a review of the reconciliation data
available to verify the information used in the LOM plan.
Based on these checks, in the opinion of the QP, the metallurgical testwork results and production data support the estimation of mineral resources and
mineral reserves and can be used in the economic analysis that supports the mineral reserves.
|
New Afton Operations
British Columbia
Technical Report Summary
|
| 11.0 |
MINERAL RESOURCE ESTIMATES
|
| 11.1 |
Introduction
|
The database used for mineral resource estimation was closed on January 8, 2026. Closure of the database occurred after the 2025 calendar year to allow
inclusion of all assay results from K-Zone exploration drill holes.
Software used for estimation include Seequent’s Leapfrog Geo v.2025.1.1 (Leapfrog) and its Edge extension (Edge).
Two block models were generated to estimate mineral resources at New Afton. The two models cover the same extent but have different block sizes to
provide more flexibility with choice of mining methods. A 10 x 10 x 10 m model was generated to estimate mineral resources for zones considered suitable for mining through block caving; these include
B3, C-Zone, D-Zone, K-Zone and HW Zone. A 5 x 5 x 5 m sub-blocked model was generated to test potential applicability of more selective underground mining methods.
| 11.2 |
Exploratory Data Analysis
|
The deposit was subject to exploratory data analysis methods, which could include histograms, cumulative probability plots,
box and whisker plots, and contact analysis. Statistics were compiled and compared for length weighted drill hole intersects, raw assay data, capped assay data, composites, and declustered composites
to ensure that the grade distribution and true mean of the system were conserved throughout the different steps of the estimation process.
Drilling programs have tested the mineralized zone to depths approaching 2,000 m below surface. Although the general nature of the mineralization stays
relatively consistent independently of depth, there are subtle differences in the distributions of metals and other elements. To account for this variation, data were segregated above and below 4,900
m elevation (approximately the elevation of the B3 cave footprint) during the variography analysis and the treatment of outlier samples for the broader resource domains (Main Zone, Monzonite, and
Other domains). This artificial boundary at 4,900 m is considered a soft boundary as data are mixed across during block grade interpolation.
| 11.3 |
Geological Models
|
Three-dimensional models for lithology, structures, alteration assemblages, and mineralization styles were created in Leapfrog. Of importance are
specific lithological units that host mineralization (Pothook diorite, monzodiorite dykes, latite dikes and Nicola Group volcanic rocks), versus others that are generally barren (picrite unit) or not
significantly mineralized (monzonite dikes).
The resource domains are grade shells modelled at specific grade thresholds. The geometry of these grade shells follows other geological elements
modelled independently of grade; these include lithological contacts, structures, and alteration and mineralization styles. The high density of drilling information commonly limits the degree of
freedom in the interpretation of the grade shells.
|
New Afton Operations
British Columbia
Technical Report Summary
|
Mineralized grade shells were generated for all mineralized zones at a grade threshold of 0.2% CuEq (Figure 11‑1).
In addition, sub-domains were modelled for East Extension, HW1 and K-Zone to better constrain higher-grade mineralization associated with bornite
and/or chalcopyrite mineralization during the estimation. Sub-domain grade thresholds were 5.0% CuEq for East Extension, 1.0% CuEq for HW1 and 0.8% for K-Zone.
In addition, estimation was also carried out in complementing lithological domains which include monzonite dykes, latite dyke, and Nicola Group
volcanic rocks. The picrite unit was assigned a grade of zero for all metals contained within. All domains were used as hard boundaries during the estimation process.
| 11.4 |
Density Assignment
|
Analysis of the measurements indicates that density tends to increase with depth. Density values in the block models, attributed as "SG", were applied
by elevation. These values ranged from 2.60 t/m3 above the 5,050 m elevation to 2.78 t/m3 below the 4,450 m elevation. Supergene mineralization was assigned a slightly lower density of 2.55 t/m3.
| 11.5 |
Grade Capping/Outlier Restrictions
|
Outlier samples were identified using histograms and probability plots of the distribution of copper, gold, and silver. A
visual review of their location relative to the surrounding data was also conducted. Outlier samples were controlled by using traditional capping directly in the composite database and by limiting the
influence of outlier samples in the grade interpolation.
The capped composites above the outlier threshold grade were restricted to a maximum distance of influence of 17% of the search ellipsoid for the
K-Zone and the HW1 estimation domains (their respective low-grade domains and sub-domains. For the East Extension estimation domains (low grade domain and sub-domains), they were restricted to a
maximum distance of influence of 10% of the search ellipsoid. For the other domains, their capped composites above the outlier threshold grade were restricted to a maximum distance of influence of 10%
of the search ellipsoid above an elevation of 4,900 m mine grid, and 17% below an elevation of 4,900 m mine grid.
Capping values for copper range from 2–15% Cu. Capping values for gold range from 5–15 g/t Au and from 10–90 g/t Ag for silver.
Outlier threshold grades range from 1.5–8% Cu for copper, 1.5–7 g/t Au for gold, and 6–50 g/t Ag for silver.
|
New Afton Operations
British Columbia
Technical Report Summary
|
|
Figure 11‑1:
|
Low-Grade Estimation and Mineral Reserves-Constraining Shapes
|
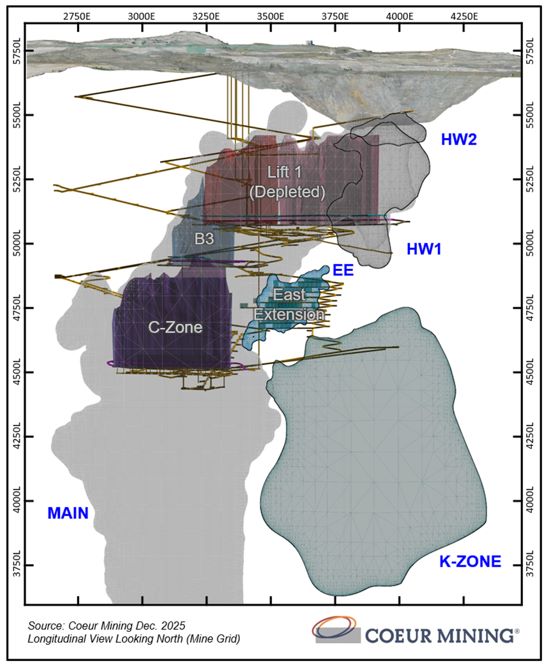
Note: Low-grade estimation domains = Main, K-Zone, East Extension, HW1, HW2; mineral reserves-constraining shapes = C-Zone, East-Extension.
|
New Afton Operations
British Columbia
Technical Report Summary
|
| 11.6 |
Composites
|
Sample interval lengths are relatively consistent in the database. A total of 96% of samples in the vicinity of the New Afton deposit measure exactly 2 m
long. Drill hole composites were length-weighted and were generated as 2 m long, down-the-hole, with estimation domains acting as a hard boundary.
| 11.7 |
Variography
|
Continuity analysis was completed separately for copper, gold, and silver on a domain-by-domain basis using the capped 2 m composites. The spatial models
were aligned in the general plane of the domains and refined using 2D radial continuity plots to fine-tune the orientation of dip, dip azimuth, and pitch. The nugget was determined using a combination of
the downhole variogram and the major axis correlogram. Two spherical structures were used to fit the spatial models.
| 11.8 |
Estimation/interpolation Methods
|
The block model grades for copper, gold, and silver are estimated using ordinary kriging (OK). All grade estimations used length-weighted composited drill
hole assay data.
The copper, gold, and silver estimates were conducted in a single pass using a search ellipsoid measuring 150 x 150 x 40 m for the 10 x 10 x 10 m model and
a search ellipsoid measuring 150 x 150 x 20 m for the 5 x 5 x 5 m sub-blocked model. The search ellipsoids used to estimate the blocks assigned to the monzonite or the ‘other’ domain were oriented
subparallel to their general trend, with a dip of 85° and a dip azimuth of 167° relative to mine grid. The other domains used variable orientations to align the variograms and the search ellipsoids.
Midplanes specific to each domain were used to guide the search ellipsoids.
The interpolation parameters, summarized in Table 11‑1, include the search ellipsoid axes, and the minimum and maximum number of composites used per
blocks. The maximum composites per drill hole were adjusted to accommodate the change of block size between the two models.
| 11.9 |
Validation
|
| • |
Visual inspection at different grade thresholds in cross-section view, plan view, and in 3D;
|
| • |
Comparison of model statistics to drill data;
|
| • |
Swath plots.
|
| • |
Reconciliation against sampling at the underground cave drawpoints and against mill.
|
These validation procedures indicate that geology and resource models are acceptable to support mineral resource estimation.
|
New Afton Operations
British Columbia
Technical Report Summary
|
|
Table 11‑1:
|
Interpolation Parameters
|
| Model | Domain |
Search Ellipse Range
(m)
|
Number of Composites
|
||||||||||||||
| X | Y | Z |
Min/
Block
|
Max/
Block
|
Max/
Drill Hole
|
Max/
Octant
|
|||||||||||
|
10 x 10 x 10 m
|
Main > 4,900 m
|
150
|
150
|
40
|
5
|
54
(36 for Ag)
|
9
|
9
|
|||||||||
|
Main < 4,900 m
|
150
|
150
|
40
|
5
|
36
(45 for Au)
|
9
|
9
|
||||||||||
|
All other domains
|
150
|
150
|
40
|
5
|
36
|
9
|
9
|
||||||||||
|
5 x 5 x 5 m sub-blocked
|
All domains
|
150
|
150
|
20
|
3
|
15
|
3
|
3
|
|||||||||
| 11.10 |
Confidence Classification of Mineral Resource Estimate
|
| 11.10.1 |
Mineral Resource Confidence Classification
|
Criteria for mineral resource confidence classification are:
| • |
Measured: blocks with copper, gold, and silver grades estimated by a minimum of three drill holes located within a distance of 30 m or less. This is achieved with drill holes at a nominal
spacing (drill spacing) of approximately 50 m;
|
| • |
Indicated: blocks with copper, gold, and silver grades estimated by a minimum of three drill holes and located within a distance of 50 m or less. This is achieved with drill holes at a nominal
spacing (drill spacing) of approximately 80 m;
|
| • |
Inferred: blocks that do not meet the criteria for measured or indicated mineral resources but are within a maximum distance of 50 m from a single drill hole.
|
The East Extension area was classified using the same criteria as the other zones even though it is reported through a stope mining method and is drilled
with a tighter spacing of approximately 20 m between drill holes. Optimized stopes that were initially classified as measured for East Extension were downgraded to indicated because of lower grade
continuity at stope mining cut-off grade.
| 11.10.2 |
Uncertainties Considered During Confidence Classification
|
Following the drill spacing analysis that classified the mineral resource estimates into the measured, indicated, and inferred confidence categories,
uncertainties regarding sampling and drilling methods, drilling angles to the mineralization, data processing and handling, geological modelling, and estimation were incorporated into the classifications
assigned. The areas with the most uncertainty were assigned to the inferred category, and the areas with fewest uncertainties were classified as measured.
|
New Afton Operations
British Columbia
Technical Report Summary
|
| 11.11 |
Reasonable Prospects of Economic Extraction
|
| 11.11.1 |
Input Assumptions
|
For each resource estimate, an initial assessment was undertaken that assessed likely infrastructure, mining, and process plant requirements; mining
methods; process recoveries and throughputs; environmental, permitting, and social considerations relating to the proposed mining and processing methods, and proposed waste disposal; and technical and
economic considerations in support of an assessment of reasonable prospects of economic extraction.
The mineral resource estimate is reported assuming underground long-hole stoping mining methods for East Extension and underground bulk mining methods,
likely block caving, for all other zones. Constraining volumes were created to demonstrate the spatial continuity of the mineralization within a potentially mineable shape.
For mineral resources reported with a long-hole stoping mining method, stope optimization was completed using Deswik Stope Optimizer at a cut-off grade
of 1.26% CuEq. The stopes were constrained to a minimum mining shape of 20 m along the strike, height of 20 m, and 5 m width. Mineral reserves were subtracted from the mineral resource optimized stope
shapes. Mineral resources are reported within the optimized stope shapes using a cut-off grade that includes the must-take material below cut-off.
For underground bulk mining zones, mineral resources are reported within resource cave shapes created using a cut-off grade of 0.33% CuEq. Within the
resource cave shapes, resources are reported for blocks above 0.30% CuEq for K-Zone, and above 0.15% CuEq for the other zones.
| 11.11.2 |
Commodity Price
|
The copper, gold, and silver prices used in resource estimation is based on analysis of long-term consensus pricing, and benchmarks to pricing used by
industry peers over the past year. An explanation of the derivation of the commodity prices is provided in Chapter 16.2.
The estimated timeframe used is seven-year mine life that supports the mineral reserves estimates. The gold price forecast for the mineral resource
estimate is US$4.40/lb Cu, $2,500/oz Au, and $30/oz Ag.
| 11.11.3 |
Cut-off Grades
|
Cut-off grades were first established for each extraction scenario. These cut-off grades are based on the input parameters and assumptions detailed in
Table 11‑2, but with metal prices increased to US$4.40/lb Cu, $2,500/oz Au, and $30/oz Ag.
|
New Afton Operations
British Columbia
Technical Report Summary
|
|
Table 11‑2:
|
Cut-off Input Assumptions
|
|
Item
|
Parameter
|
Units
|
Value
|
||||
|
NSR assumptions
|
Gold price
|
US$/oz
|
2,500
|
||||
|
Copper price
|
US$/lb
|
4.40
|
|||||
|
Silver price
|
US$/oz
|
30
|
|||||
|
Exchange rate
|
C$:US$
|
1.30
|
|||||
|
Gold recovery
|
%
|
variable
|
|||||
|
Copper recovery
|
%
|
variable
|
|||||
|
Silver recovery
|
%
|
variable
|
|||||
|
Gold payable
|
%
|
97.4
|
|||||
|
Copper payable
|
%
|
95.8
|
|||||
|
Silver payable
|
%
|
90.0
|
|||||
|
Gold refining charge
|
US$/oz
|
5.05
|
|||||
|
Copper refining charge
|
US$/lb
|
0.061
|
|||||
|
Silver refining charge
|
US$/oz
|
0.454
|
|||||
|
Total treatment cost
|
US$/dmt concentrate
|
61
|
|||||
|
Total transport cost
|
US$/wmt concentrate
|
141
|
|||||
|
Cut-off grade parameters
|
Mining cost – block caving
|
US$/t processed
|
11.50
|
||||
|
Mining cost – stoping
|
US$/t processed
|
87.50
|
|||||
|
Processing cost
|
US$/t processed
|
9.00
|
|||||
|
G&A cost
|
US$/t processed
|
3.50
|
|||||
|
Block caving cut-off grade
|
% CuEq
|
0.15
|
|||||
|
Stoping cut-off grade
|
% CuEq
|
1.26
|
Mineral resources potentially amenable to underground bulk mining were reported using a cut-off grade of 0.30% CuEq for K-Zone and using a cut-off grade of
0.15% CuEq for the other zones. Mineral resources potentially amenable to stope mining were reported using a cut-off grade of 1.26% CuEq.
The following copper-equivalency is used:
| • |
Cu% + (Au g/t * Au Recovery * Au Payable * (Au Price - Refining) / 31.1035) + (Ag g/t * Ag Recovery * Ag Payable * (Ag Price - Refining) / 31.1035) / (22.046 * Cu Recovery * Cu Payable * (Cu
Price - Refining).
|
The calculations are based on the following:
| • |
Au price: US$2,500/oz Au; Au recovery: 87.7%; Au payable: 97.0%; Au refining charge: US$6.00/oz; Ag price: US$30/oz Au; Ag recovery: 73.5%; Ag payable: 90.0%; Ag refining charge: US$0.50/oz; Cu
price: US$4.40/lb Cu; Cu recovery: 86.4%; Cu payable: 96.4%; Cu refining charge: US$0.8/lb.
|
|
New Afton Operations
British Columbia
Technical Report Summary
|
| 11.11.4 |
QP Statement
|
The QP is of the opinion that any issues that arise in relation to relevant technical and economic factors likely to influence the prospect of economic
extraction can be resolved with further work. The mineral resource estimates are performed for deposits that are in a well-documented geological setting. Coeur is very familiar with the economic
parameters required for successful operations in the New Afton area; and Coeur has a history of being able to obtain and maintain permits, social license and meet environmental standards. There is
sufficient time in the seven-year timeframe considered for the commodity price forecast for Coeur to address any issues that may arise, or perform appropriate additional drilling, testwork and engineering
studies to mitigate identified issues with the estimates.
| 11.12 |
Mineral Resource Statement
|
Mineral resources are reported exclusive of those mineral resources converted to mineral reserves. Mineral resources
that are not mineral reserves do not have demonstrated economic viability.
The mineral resource estimates are current as at December 31, 2025. The reference point for the estimate is in situ.
The Qualified Persons for the estimates are Mr. Vincent Nadeau-Benoit P.Geo., and Mr. Tyler Roberts, P.Eng., both Coeur employees.
Mineral resources are summarized in Table 11‑3.
| 11.13 |
Uncertainties (Factors) That May Affect the Mineral Resource Estimate
|
Factors that may affect the mineral resource estimates include:
| • |
Metal price and exchange rate assumptions;
|
| • |
Changes to the assumptions used to generate the gold equivalent grade cut-off grade;
|
| • |
Changes in local interpretations of mineralization geometry and continuity of mineralized zones;
|
| • |
Changes to geological and mineralization shape and geological and grade continuity assumptions;
|
|
New Afton Operations
British Columbia
Technical Report Summary
|
|
Table 11‑3:
|
Measured, Indicated, and Inferred Mineral Resources Statement
|
| Zone | Category |
Tonnes
(t x
1,000)
|
Grade | Metal Content |
Cut-off
Grade
|
Metallurgical
Recovery
|
|||||||||||||||||||
|
Au
(g/t)
|
Ag
(g/t)
|
Cu
(%)
|
Au
Ounces
(oz x
1,000)
|
Ag
Ounces
(oz x
1,000)
|
Cu Pounds
(lb x
1,000,000)
|
CuEq.
(%)
|
Au
(%)
|
Ag
(%)
|
Cu
(%)
|
||||||||||||||||
|
B-Zone
C-Zone
D-Zone
HW
|
Measured
|
29,843
|
0.58
|
1.78
|
0.62
|
552
|
1,707
|
408
|
0.15
|
87.7
|
73.5
|
86.4
|
|||||||||||||
|
Indicated
|
25,611
|
0.28
|
1.04
|
0.28
|
230
|
859
|
158
|
0.15
|
87.7
|
73.5
|
86.4
|
||||||||||||||
|
Sub-total
measured and
indicated
|
55,454
|
0.44
|
1.44
|
0.46
|
782
|
2,566
|
566
|
0.15
|
87.7
|
73.5
|
86.4
|
||||||||||||||
|
Inferred
|
1,289
|
0.35
|
0.70
|
0.22
|
15
|
29
|
6
|
0.15
|
87.7
|
73.5
|
86.4
|
||||||||||||||
|
K-Zone
|
Measured
|
7,206
|
0.70
|
3.66
|
0.91
|
162
|
849
|
144
|
0.30
|
87.7
|
73.5
|
86.4
|
|||||||||||||
|
Indicated
|
40,436
|
0.43
|
1.52
|
0.52
|
553
|
1,979
|
462
|
0.30
|
87.7
|
73.5
|
86.4
|
||||||||||||||
|
Sub-total
measured and
indicated
|
47,642
|
0.47
|
1.85
|
0.58
|
715
|
2,827
|
606
|
0.30
|
87.7
|
73.5
|
86.4
|
||||||||||||||
|
Inferred
|
5,877
|
0.45
|
1.64
|
0.59
|
86
|
309
|
77
|
0.30
|
87.7
|
73.5
|
86.4
|
||||||||||||||
|
East Extension
|
Measured
|
—
|
—
|
—
|
—
|
—
|
—
|
—
|
—
|
—
|
—
|
—
|
|||||||||||||
|
Indicated
|
1,558
|
0.96
|
4.24
|
1.04
|
48
|
213
|
36
|
1.26
|
87.7
|
73.5
|
86.4
|
||||||||||||||
|
Sub-total
measured and
indicated
|
1,558
|
0.96
|
4.24
|
1.04
|
48
|
213
|
36
|
1.26
|
87.7
|
73.5
|
86.4
|
||||||||||||||
|
Inferred
|
—
|
—
|
—
|
—
|
—
|
—
|
—
|
—
|
—
|
—
|
—
|
||||||||||||||
|
Total
|
Measured
|
37,049
|
0.60
|
2.15
|
0.68
|
715
|
2,555
|
552
|
—
|
87.7
|
73.5
|
86.4
|
|||||||||||||
|
Indicated
|
67,605
|
0.38
|
1.40
|
0.44
|
831
|
3,051
|
656
|
—
|
87.7
|
73.5
|
86.4
|
||||||||||||||
|
Total measured and indicated
|
104,654
|
0.46
|
1.67
|
0.52
|
1,545
|
5,606
|
1,208
|
—
|
87.7
|
73.5
|
86.4
|
||||||||||||||
|
Inferred
|
7,166
|
0.44
|
1.47
|
0.53
|
100
|
338
|
83
|
—
|
87.7
|
73.5
|
86.4
|
||||||||||||||
|
New Afton Operations
British Columbia
Technical Report Summary
|
Notes to accompany mineral resource tables:
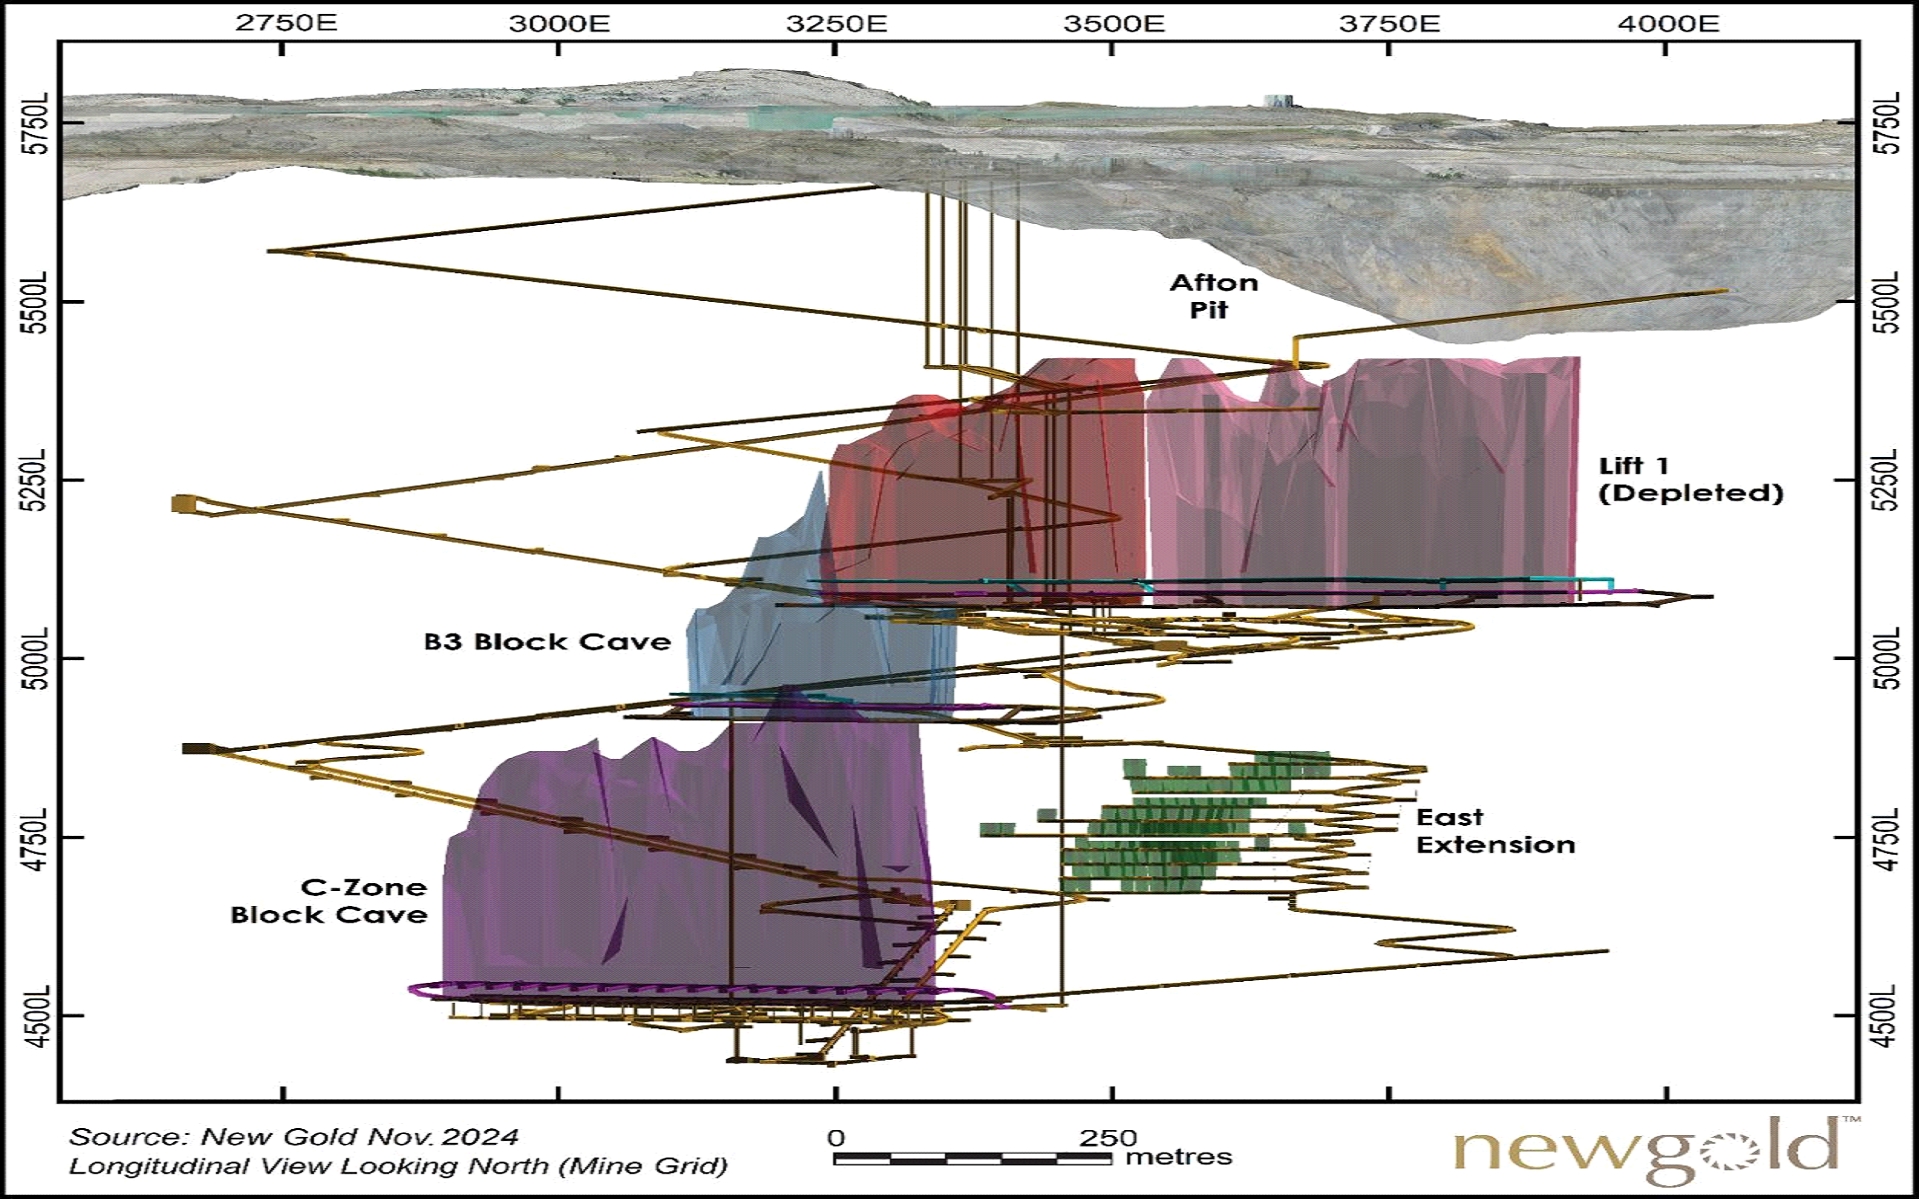
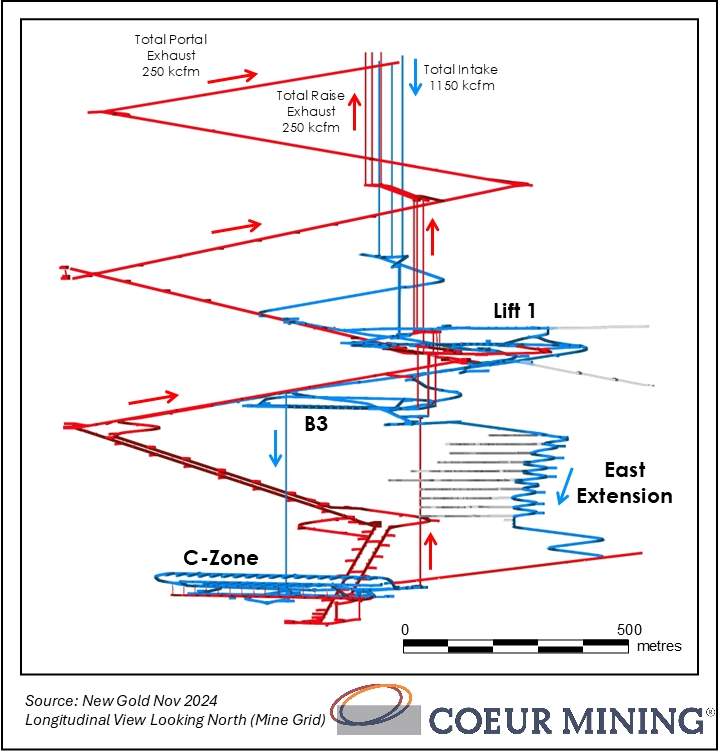
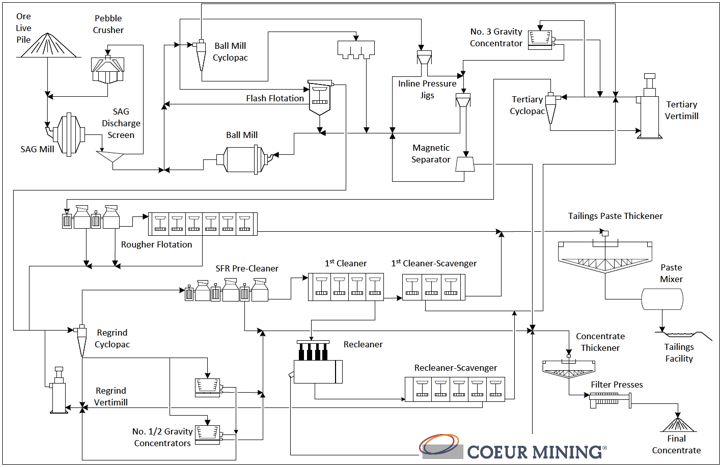
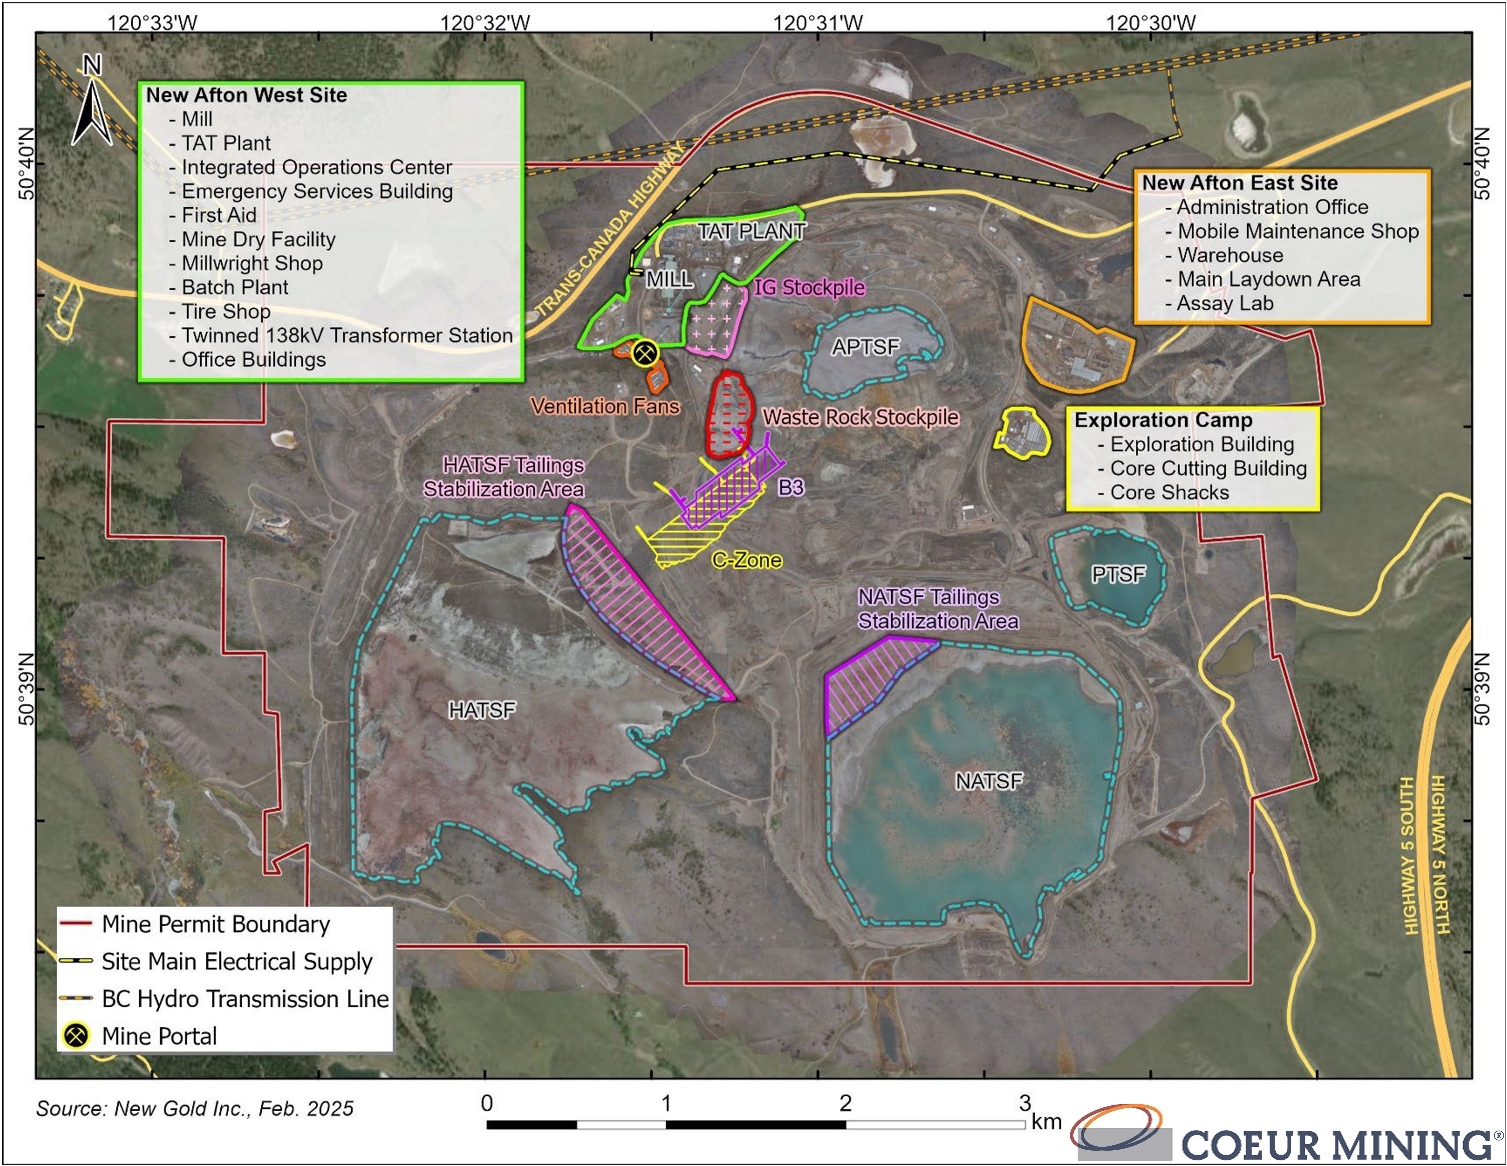
| 1. |
The Mineral resource estimates are current as at December 31, 2025, and are reported using the definitions in Item 1300 of Regulation S–K (17 CFR Part 229) (S-K 1300).
|
| 2. |
The reference point for the mineral resource estimate is in situ. The Qualified Persons for the estimate are Mr. Vincent Nadeau-Benoit P.Geo., and Mr. Tyler Roberts, P.Eng., both
Coeur employees.
|
| 3. |
Mineral resources are reported exclusive of those mineral resources converted to mineral reserves. Mineral resources that are not mineral reserves do not have demonstrated economic
viability.
|
| 4. |
Mineral Resources are estimated using metal price assumptions of US$4.40 per pound of copper, US$2,500 per ounce of gold, and US$30 per ounce of silver, and a foreign exchange rate
assumption of 1.30 C$/1.00US$.
|
| 5. |
For underground bulk mining, mineral resources are reported within resource cave shapes created using a cut-off grade of 0.33% CuEq. Within resource cave shapes, resources are
reported for blocks above 0.30% CuEq for K-Zone, and above 0.15% CuEq for the other zones. For stope mining, mineral resources are reported within mineable shapes created using a cut-off
grade of 1.26% CuEq and include must-take material.
|
| 6. |
The following copper-equivalency (CuEq%) formula is used: Cu% + (Au g/t * Au Recovery * Au Payable * (Au Price - Refining) / 31.1035) +
(Ag g/t * Ag Recovery * Ag Payable * (Ag Price - Refining) / 31.1035) / (22.046 * Cu Recovery * Cu Payable * (Cu Price - Refining). The calculations are based on the following: Au price:
US$2,500/oz Au; Au recovery: 87.7%; Au payable: 97.0%; Au refining charge: US$6.00/oz; Ag price: US$30/oz Au; Ag recovery: 73.5%; Ag payable: 90.0%; Ag refining charge: US$0.50/oz; Cu
price: US$4.40/lb Cu; Cu recovery: 86.4%; Cu payable: 96.4%; Cu refining charge: US$0.8/lb.
|
| 7. |
Rounding of tonnes, grades, troy ounces and pounds as required by reporting guidelines, may result in apparent differences between tonnes, grades, and contained metal contents.
|
|
New Afton Operations
British Columbia
Technical Report Summary
|
| • |
Density and domain assignments;
|
| • |
Changes to geotechnical, mining, and metallurgical recovery assumptions;
|
| • |
Changes to the input and design parameter assumptions that pertain to the assumptions for the mineable shapes and cut-offs constraining the estimates;
|
| • |
Assumptions as to the continued ability to access the site, retain mineral and surface rights titles, maintain environment and other regulatory permits, and
maintain the social license to operate.
|
There are no other environmental, permitting, legal, title, taxation, socioeconomic, marketing, political or other relevant factors known to the
Qualified Person that would materially affect the estimation of mineral resources that are not discussed in this Report.
|
New Afton Operations
British Columbia
Technical Report Summary
|
| 12.0 |
MINERAL RESERVE ESTIMATES
|
|
12.1
|
Introduction
|
Mineral reserves were estimated for C-Zone, and East Extension mining zones (Figure
12‑1). The B3 Zone is an operating block cave. Mining of the B3 block cave is expected to be completed in Q1 2026. Material is continuing to be drawn from the B3 cave; however, this material is
unclassified and is not included in the mineral reserves or mine plan in this Report. The C-Zone is a block cave in the production ramp-up phase, with commercial production achieved in the
fourth quarter of 2024. East Extension is planned as a long-hole stoping zone and is not yet in production.
C-Zone mineral reserves were estimated using the 10 x 10 x 10 m model. Measured and indicated mineral resources were converted to probable
mineral reserves. Due to the uncertainty associated with estimating movement of material within the block caves, no proven mineral reserves were reported for C-Zone.
East Extension mineral reserves were estimated using the 5 x 5 x 5 m sub-blocked model. Indicated mineral resources were converted to probable
mineral reserves.
Mineral reserve block models are generated by adding an NSR attribute, in US$ per tonne, to each block in the resource block models. Blocks
classified as inferred mineral resources, or without a resource classification, were set to zero grade and zero NSR.
| 12.2 |
Development of Mining Case
|
C-Zone block cave mineral reserves were estimated using GEOVIA PCBC software, designed specifically for the planning and scheduling of block cave
mines. PCBC generates vertical or inclined draw columns above each drawpoint (referred to as slice files) for which properties are derived from the block model. In block caving, the height of
draw refers to the vertical height above the drawpoint from which material is extracted. At New Afton, a minimum height of draw of 50 m is applied for block cave mineral reserves and the maximum
height of draw parameter for C-Zone is set at 450 m.
Through the application of the cut-off NSR and caving parameters—which include minimum and maximum height of draw, fragmentation assumptions,
drawpoint geometry, and mixing characteristics—the PCBC model estimates the tonnes and properties of material to be extracted from each drawpoint. The model incorporates dilution from the top of
the columns and the side walls of the cave, depending on the assumed mixing characteristics. PCBC mixing parameters and options have been refined over 12 years of experience at New Afton
operating the Lift 1 and B3 block caves. Several PCBC models are generated using a range of parameters to assess the level of confidence in the model outputs. PCBC then uses historical
production, the applied maximum height of draw, and the mixing parameters to predict the production tonnage and grade.
|
New Afton Operations
British Columbia
Technical Report Summary
|
| Figure 12‑1: |
Final Mine Layout Plan
|
Mineral reserves for the East Extension, planned as a stoping zone, were estimated using Deswik mine planning software. Deswik Stope Optimizer
was first used to define potential stoping zones, based on a cut-off NSR of US$100/t and stope dimensions of 20 m high x 14 m long. Stope widths were variable, ranging from 5–20 m. Overbreak of
0.58 m and 0.29 m was applied to the hanging wall and footwall, respectively. Deswik CAD software was used to design mining drifts to access the stoping areas and other mine infrastructure.
|
New Afton Operations
British Columbia
Technical Report Summary
|
Stopes were analyzed for inclusion into the mineral reserve tabulation by analyzing capital costs, considering the development required to enable
mining of the designed stopes and other mining infrastructure requirements. Deswik Scheduler was used to generate the development and production schedules.
| 12.3 |
Cut-offs
|
An NSR was calculated for each block in the block model using the parameters listed in Table 12‑1. Metallurgical recoveries are variable based on
the grade–recovery curves for each ore type, and concentrate costs and refining charges are variable depending on the smelter. The values shown are LOM averages.
Mineral reserves were reported above a break-even NSR cut-off value equal to the total site operating cost per tonne in US dollars, which
includes mining, processing, and general and administrative (G&A) costs. The NSR cut-off value for block caving and stoping is US$24/t and US$100/t, respectively.
Because block cave drawpoints on the extraction level are positioned in a single plane, material below the cut-off NSR must sometimes be mined
from the draw column to access higher-grade ore located higher in the draw column, or to maintain a cave shape and size suitable for caving. However, Coeur is capable of segregating waste from
the drawpoints by removing it using a belt plow on surface before it reaches the crushed ore stockpile. The C-Zone LOM plan includes 369 kt of waste mined from the drawpoints but not processed,
and this material is excluded from the mineral reserve estimates.
Intermediate-grade C-Zone mineral reserves can also be segregated and stockpiled on surface.
| 12.4 |
Ore Loss and Dilution
|
Block cave dilution is simulated dynamically within PCBC, based on the geometry of the cave, mixing parameters, and mining sequence. Total
dilution over the life of the C-Zone block cave is estimated at 28.6%, which includes 4.6% internal dilution. A key objective for the C-Zone mine design and draw sequence is to minimize dilution
from the picrite zones. As such, early cave growth is prioritized on the north side of the footprint, away from the picrite contact. The cave back will be brought back to a more even height at
mid-height of draw. Ore recovery in the block caves is assumed to be 100% of the mixed/diluted block model.
Dilution assumptions for East Extension stopes are based on the outputs of Matthew’s empirical stope stability model, considering the rock mass
quality and planned stope dimensions. Dilution is currently estimated at 10.8%, with 5.8% from hanging-wall and footwall overbreak at the block model grade and 5% backfill dilution at zero
grade. Longitudinal stopes are planned for the extraction of the high-grade core of the deposit, within a lower- grade halo. Therefore, hanging wall and footwall overbreak dilution is expected
to be low grade. The mine design allows for 3 m wide rib pillars between the backfilled stopes to minimize backfill dilution. An additional 93% mining recovery factor is applied to stope tonnes
to account for unblasted ore in the shoulders of the stopes and unmucked ore remaining on the floor of the stopes.
|
New Afton Operations
British Columbia
Technical Report Summary
|
| Table 12‑1: |
NSR Parameters
|
|
Parameter
|
Units
|
Value
|
|||||
|
NSR assumptions
|
Gold price
|
US$/oz
|
1,650
|
||||
|
Copper price
|
US$/lb
|
3.50
|
|||||
|
Silver price
|
US$/oz
|
20
|
|||||
|
Exchange rate
|
C$:US$
|
1.30
|
|||||
|
Gold recovery
|
%
|
variable
|
|||||
|
Copper recovery
|
%
|
variable
|
|||||
|
Silver recovery
|
%
|
variable
|
|||||
|
Gold payable
|
%
|
97.4
|
|||||
|
Copper payable
|
%
|
95.8
|
|||||
|
Silver payable
|
%
|
90.0
|
|||||
|
Gold refining charge
|
US$/oz
|
5.05
|
|||||
|
Copper refining charge
|
US$/lb
|
0.061
|
|||||
|
Silver refining charge
|
US$/oz
|
0.454
|
|||||
|
Total treatment cost
|
US$/dmt concentrate
|
61
|
|||||
|
Total transport cost
|
US$/wmt concentrate
|
141
|
|||||
|
Cut-off value parameters
|
Mining cost – block caving
|
US$/t processed
|
11.50
|
||||
|
Mining cost – stoping
|
US$/t processed
|
87.50
|
|||||
|
Processing cost
|
US$/t processed
|
9.00
|
|||||
|
G&A cost
|
US$/t processed
|
3.50
|
|||||
|
Total block caving cost
|
US$/t processed
|
24.00
|
|||||
|
Total stoping cost
|
US$/t processed
|
100.00
|
| 12.5 |
Commodity Price
|
The gold price used in mineral reserve estimation is based on analysis of three-year rolling averages, long-term consensus pricing, and
benchmarks to pricing used by industry peers over the past year. An explanation of the derivation of the commodity prices is provided in Chapter 16.2.
The estimated timeframe is the seven-year LOM that supports the mineral reserve estimates.
|
New Afton Operations
British Columbia
Technical Report Summary
|
| 12.6 |
Mineral Reserve Statement
|
Mineral reserves were classified using the mineral reserve definitions set out in S-K 1300. The reference point for
the mineral reserve estimate is the point of delivery to the process plant.
Mineral reserves are reported in Table 12‑2 and are current as at December 31, 2025.
The Qualified Person for the estimate is Mr. Tyler Roberts, P.Eng., a Coeur employee.
| 12.7 |
Uncertainties (Factors) That May Affect the Mineral Reserve Estimate
|
| • |
Changes to the long-term copper, gold, and silver price and exchange rate assumptions;
|
| • |
Changes to the parameters used to derive the cave outlines and stope shapes and determine the cut-off values;
|
| • |
Changes to geotechnical and hydrogeological assumptions;
|
| • |
Changes to the cave mixing model and dilution estimates;
|
| • |
Changes to metallurgical recovery assumptions;
|
| • |
Changes to inputs to capital and operating cost estimates;
|
| • |
Continued ability to access the site, retain mineral and surface rights titles, maintain environmental and other regulatory permits, and maintain the social
license to operate.
|
There are no other mining, metallurgical, infrastructure, permitting, or other relevant factors known to the Qualified Person that would
materially affect the estimation of mineral reserves that are not discussed in this Report.
|
New Afton Operations
British Columbia
Technical Report Summary
|
|
Table 12‑2:
|
Proven and Probable Mineral Reserves Statement
|
|
Zone
|
|
Category
|
Tonnes
(kt)
|
Grade
|
Contained Metal
|
Metallurgical
Recovery
(%)
|
|||||||||||||
|
Au
(g/t)
|
Ag
(g/t)
|
Cu
(%)
|
Au
(koz)
|
Ag
(koz)
|
Cu
(Mlbs)
|
||||||||||||||
|
C-Zone
|
Proven
|
—
|
—
|
—
|
—
|
—
|
—
|
—
|
—
|
||||||||||
|
Probable
|
35,212
|
0.65
|
1.62
|
0.72
|
739
|
1,837
|
556
|
88.5
|
|||||||||||
|
Sub-total proven
and probable
|
35,212
|
0.65
|
1.62
|
0.72
|
739
|
1,837
|
556
|
88.5
|
|||||||||||
|
East Extension
|
Proven
|
—
|
—
|
—
|
—
|
—
|
—
|
—
|
—
|
||||||||||
|
Probable
|
962
|
1.31
|
8.5
|
1.63
|
41
|
264
|
35
|
87.6
|
|||||||||||
|
Sub-total proven
and probable
|
962
|
1.31
|
8.5
|
1.63
|
41
|
264
|
35
|
87.6
|
|||||||||||
|
Total
|
Proven & Probable
|
36,174
|
0.67
|
1.79
|
0.74
|
780
|
2,101
|
591
|
88.5
|
||||||||||
Notes to accompany mineral reserve table:
| 1. |
The Mineral Reserve estimates are current as at December 31, 2025, and are reported using the definitions in Item 1300 of Regulation S–K (17 CFR Part 229) (S-K
1300).
|
| 2. |
The Qualified Person for the estimate is Mr. Tyler Roberts, P.Eng., a Coeur employee.
|
| 3. |
Mineral Reserves are estimated using metal price assumptions of US$3.50 per pound of copper, US$1,650 per ounce of gold, and US$20 per ounce of silver, and a
foreign exchange rate assumption of C$1.30 : US$1.00.
|
| 4. |
C-Zone block cave Mineral Reserves are reported at a cut-off NSR of US$24/t and East Extension Mineral Reserves are reported at a cut-off NSR of US$100/t,
based on processing costs of US$9.00/t processed, G&A costs of US$3.50/t processed, block caving costs of US$11.50/t ore mined, and stoping costs of US$87.50/t ore mined.
Metallurgical recoveries vary depending on ore type and grades.
|
| 5. |
Rounding of short tonnes, grades, and troy ounces, as required by reporting guidelines, may result in apparent differences between tonnes, grades, and
contained metal contents.
|
|
New Afton Operations
British Columbia
Technical Report Summary
|
| 13.0 |
MINING METHODS
|
| 13.1 |
Introduction
|
The mineral reserve estimates are based on block caving and long-hole stoping underground mining methods. The B3 and C-Zones are mined using
block caving, and the East Extension is planned to be mined using stoping. Mining of the B3 block cave is expected to be completed in Q1 2026. Material is continuing to be drawn from the B3
cave; however, this material is unclassified and is not included in the mineral reserves or mine plan in this Report.
| 13.2 |
Geotechnical Considerations
|
| 13.2.1 |
Caveability and Fragmentation
|
Cave monitoring systems indicated that the transition from cave construction into sustainable caving occurred when the drawbell hydraulic radius
was 23 m for West Cave, 21 m for East Cave and 23 m for the B3 Zone. In general, the C-Zone geology is similar to that of the West and B3 Caves. Empirically, its critical hydraulic radius was
estimated to be between 21–23 m, which was proved successful during C-Zone cave initiation. Numerical modelling work by Itasca Consulting Inc., and Beck Engineering Ltd. (Beck) was completed and
produced similar estimates. Review of the Lift 1 and B3 cave monitoring system indicated that the transition to sustainable caving was evidenced by an increase in microseismic events vertically
above the drawpoints and by the observation of cumulative breaks over production intervals on the time-domain reflectometry systems.
When a drawbell is initially developed and blasted rock is mined out, fragmentation from the caving process is generally coarse. As the draw
column matures, the rock fragmentation becomes finer due to secondary fragmentation. Hang-ups occur when broken rock, either single or multiple large rocks, within the drawbell fails to flow out
of the drawpoint as intended, causing a blockage. However, most hang-ups typically occur on the cave boundaries along the footprint perimeter. They can also occur in early draw column height
within the moderately fractured rock. As anticipated, random hang-ups also occur over the life of extraction within the regular highly fractured rock and mature drawbells. Coeur tracks hangups
each shift and has a mobile rock breaker and blasting practice developed for hangup occurrences.
| 13.2.2 |
Stope Stability
|
Stope stability analysis for East Extension is based on results from geotechnical mapping of drill core. Data collection is conducted using
Q-Index and then processed by the empirical modified stability-graph method (after Potvin, 1988; Nickson, 1992; and Hadjigeorgiou et al., 1995). During development, geotechnical mapping will be
conducted in the access drives to validate the stope design criteria and ground support requirements. Stopes are scheduled to be backfilled with cemented rock fill shortly after they are mined
to reduce stand-up time and overbreak.
|
New Afton Operations
British Columbia
Technical Report Summary
|
Stope locations in East Extension have been numerically modelled to evaluate their proximity to the C-Zone cave influence area. Geotechnical offsets were applied to ensure that stress
impacts remain outside the anticipated C-Zone caving zones.
To further mitigate potential risks, the mine design incorporates a longitudinal mining method. This method involves retreating eastward, away
from the C-Zone cave area, during resource extraction. By adopting this approach, this design safeguards critical ramps and stope access against any unforeseen cave deviations within the C-Zone,
enhancing operational reliability and safety.
| 13.2.3 |
Surface Subsidence
|
Surface subsidence was initially observed in 2011 as the West Cave progressively migrated and broke through to the surface, creating a depression
in the topography. This was followed by the breakthrough of the East Cave into the open pit. Mining within West and East caves was completed in April 2021 and February 2022, respectively.
Observed subsidence rates decreased following closure of Lift 1 and prior to the onset of influence from B3. Mining of B3, the second lift, commenced mid-2021.
The timing and extent of B3 cave progression and initial subsidence expression are attributed to the pre-existing broken and mobilized material
within the West Cave muck pile and its associated subsidence zone. Initial subsidence deformations were observed across the existing West Cave subsidence zone as the B3 cave propagated into the
intact ore body portion located adjacent to the West Cave in mid-2022. The progression of the B3 cave triggered the limited mobilization of the overlying Lift 1 extraction level and associated
muck pile, and was accompanied by increasing surface subsidence, particularly along its westernmost boundary.
The influence of subsidence is recorded by a very robust automated instrumentation program and is also monitored using visual observations,
aerial photography, and amplitude-based satellite InSAR. This extensive fully automated monitoring dataset is available to on-site staff, external consultants, and to the TSF Engineers of Record
for routine interpretation of subsidence trends and monitoring of several key mine infrastructure areas.
Numerical modelling is also used to help forecast underground performance and progression of subsidence for long-range planning and to assess and
mitigate potential impacts to mine infrastructure. Beck provides a subsidence forecast model based on input from New Afton and their consultants. Beck updated the latest subsidence model in
August, 2023. Coeur uses the numerical model solely for planning purposes and continues to rely on the observational method, instrumentation data, and remote sensing data to monitor the
progression of subsidence at the mine site.
Mining subsidence from C-Zone, which is located approximately 1,150 m below surface, has been numerically modelled and forecasted using existing
geotechnical and geology datasets. C-Zone is expected to initially breakthrough into the pre-existing B3 and Lift 1 West Cave subsidence influence areas; monitoring will continue using the
existing programs in place for B3 cave mining, with additional monitoring installations as required by the site or TSF Engineers of Record.
|
New Afton Operations
British Columbia
Technical Report Summary
|
East Extension is not expected to cause additional subsidence as the longitudinal stopes are to be backfilled with cemented rock fill, and
geotechnical spans will be minimized to reduce the occurrence of caving stopes.
| 13.2.4 |
Mud Rushes
|
The Mudrush Risk Management Procedure ensures safe working conditions in the event of potential mudrush events caused by cave-groundwater
interactions. These safe working conditions are achieved by implementing a drawpoint classification matrix and a Standard Operations Procedure (SOP). Routine drawpoint inspections are conducted
by draw control, geotechnical, and geology personnel to monitor moisture content and fragmentation. Observed changes in drawpoint moisture during active production are reported by the operators.
A mudrush risk-status board is maintained underground to communicate immediate changes in risk to those working on the level, and a weekly mudrush risk map is published to the underground and
technical teams, summarizing data from inspections over the previous week. Regular priority meetings with underground personnel ensure clear communication of the mudrush status and associated
risk categories. In cases where a drawpoint is classified as high risk, automated or remote production scoops are used to prevent personnel exposure to potential mudrush material flow. In the
C-Zone, similar to B3 and Lift 1, if a mudrush risk is present, production will primarily be carried out using a fleet of automated scoops. No mudrush occurrences were observed during the mining
of the C-Zone or B3 cave.
| 13.2.5 |
Air Blast
|
An air gap is the void space between the intact rock at the cave back and the top of the broken rock muckpile. This void forms as production
begins and material is extracted through the drawpoints. During the caving process, stress changes cause the intact rock at the cave back to break onto the muckpile, gradually filling the void.
However, if the stress changes are insufficient to break the intact rock at the cave back, the air gap can grow larger as production continues to pull the muckpile down. A larger air gap
increases the risk of instability, as it allows larger blocks or volume of intact rock to fall over an increased air gap height. The larger blocks or volume of falling material can compress the
trapped air, causing it to escape at high velocities through connected workings and potentially result in an airblast, which may pose a significant risk to both personnel and equipment.
Coeur actively interprets and manages the risk of air blasts through the application of its Cave Management Plan, by inputting production numbers
and monitoring data from geotechnical instrumentation. To mitigate potential risks, air blast bulkheads have been installed at existing and anticipated connections that may develop during the
caving process. Once the cave has broken through to the surface, the risk of an air blast is eliminated, as material from the caving process has filled any significant void space.
The East and West Caves from Lift 1, as well as the B3 cave, have broken through to the surface and no longer pose an air gap risk. Air gap
analysis and monitoring are ongoing as caving progresses in the C-Zone with breakthrough to the B3 level expected by late-2026 to mid-2027.
|
New Afton Operations
British Columbia
Technical Report Summary
|
| 13.2.6 |
Support Systems
|
The primary ground support system for standard development comprises fiber-reinforced shotcrete, tendon reinforcements (such as rebar bolts or MD
bolts), and welded wire screen.
Ground support for the extraction level includes a primary support system, consisting of fiber-reinforced shotcrete, MD bolts or dynamic rebar
bolts, and screen; followed by secondary support comprising long tendon support (cable bolts and self-drilling anchors) and reinforced strapping (OSRO straps and pillar wrapping), with an
additional layer of mid- to low-wall shotcrete cover to protect equipment from damage.
Ground support for the development of East Extension will be based on the existing ground support standards for fair to good ground conditions.
On the ore drives, cable bolts were planned for the brows of all stopes and for all permanent intersections; they will also be placed in selected areas of hanging wall, footwall, and backs of
stopes.
All major long-term infrastructure, such as conveyor transfer chambers and crusher stations, were located outside of the mining footprint to
minimize their exposure to the induced strain and stress changes caused by the caving process. Given the significant span (>6 m) and long service life anticipated for these excavations,
secondary support systems such as long tendon support (cable bolts) and straps were used to reinforce the rock mass in addition to the primary support system.
Multi-point borehole extensometers are used to measure the in situ displacement of the rock mass near an opening and to assess the performance of
the installed ground support. They are typically installed in the back and sidewalls in a cable-bolted intersection or area of larger span. Handheld LiDAR scanning is also completed to provide a
background dataset that can be used for comparative purposes for determining how much deformation has occurred due to regional mine closure over time. An area can be chosen for monitoring based
on the importance, excavation quality, geology type, structural complexity, and/or anticipated stress conditions.
| 13.2.7 |
Monitoring
|
A large array of instrumentation has been installed for all caves. In the current operating caves, B3 and C-Zone, a microseismic system is used
to capture mining-induced seismicity. The system used for the B3 cave was expanded with the development of the C-Zone mine, allowing for the source-location of microseismic events caused by
ongoing caving activity. Seismic tomography is also utilized with the seismic system to assist with cave profile interpretation.
Metallic and fiber-optical time-domain reflectometry systems are co-axial or fiber-optic cables, grouted in a drill hole, that can be used to
determine rock-mass response to mining. Reflections in the cable are generated by cable deformation, abrasions, water, or severing caused by ground movement. They are used to track and monitor
the cave profile as the mining front advances to surface and along the footprint.
A wireless battery-powered system for cave monitoring (Geo4Sight from Elexon Mining) is also used where the use of cabled monitoring systems is
not possible, or where cables are at high risk of being damaged by moving ground. The system provides a more robust and versatile alternative to wired cave-monitoring systems, as the data are
transmitted wirelessly through rock, and thus is not vulnerable to hole shearing/dislocation.
|
New Afton Operations
British Columbia
Technical Report Summary
|
Cave tracker and beacons provide real-time insight into cave flow and cave propagation. This technology uses magnetic beacons which are embedded
in the ore body. They emit a magnetic field pulse on a set time period. The beacons that are embedded can be tracked in 3D as they move with the fragmented rock of the orebody. The ability to
track beacon movement allows mine engineers to determine which parts of the cave are moving. These beacons are built to withstand the rigors of the underground cave environment.
| 13.3 |
Hydrogeological Considerations
|
The Lift 1 underground dewatering system consists of two vertical sumps located at the bottom of the Lift 1 development. Each sump has a capacity
of approximately 240 m3 and its outflow is connected to a single dewatering system of three booster stations
arranged along a 200 mm dewatering line. The dewatering system is fully automated. One of the two sumps is kept empty as reserve capacity. The maximum design pumping rate of the system is 184 m3/h and the system currently operates at approximately 110 m3/h.
The B3 and C-Zone underground dewatering system consists of a single settlement sump which collects all water. Water from the clean side of the
sump is pumped using a single 150 hp pump through a dedicated line into the Lift 1 vertical sumps.
The C-Zone underground dewatering system uses a similar setup to the Lift 1 system, with the same design capacity of 184 m3/h. It uses two 240 m3 vertical
sump tanks, pumps, 200 mm steel dewatering line, and booster stations. The C-Zone dewatering line drains into the Lift 1 sump tanks for pumping to surface.
| 13.4 |
Operations
|
| 13.4.1 |
Mining Method
|
The block cave mining method involves development of a footprint at the base of the cave that includes an undercut level for initiating the cave
and an extraction level from which ore will be mucked from drawpoints for the duration of the cave. Block caving initially requires up-front capital investment in development and footprint
construction; however, the subsequent production period requires minimal capital investment which is why block caving is considered the underground mining method with the lowest unit mining
costs. Other benefits of block caving include high production rates and low environmental impacts.
The mining plan for East Extension, located east of C-Zone, is to use a longitudinal long-hole stoping method. The method involves the
development of drifts along the strike of the ore body at regular level intervals, followed by drilling and blasting of stopes between levels, and mucking the broken ore from the lower level
using load–haul–dump vehicles (LHDs). After completion of ore extraction, stopes will be backfilled using a combination of rockfill and cemented rockfill.
|
New Afton Operations
British Columbia
Technical Report Summary
|
| 13.4.2 |
Access
|
The underground mine is accessed by decline from a portal on surface located to the south of the processing plant. From surface to a depth of 650
m below surface, a single 5.5 m wide x 6.0 m high decline is used for both vehicle access and the conveyor, which is suspended from the back of the decline. From this elevation to the bottom of
C- Zone at 1,150 m below surface, the mine has two declines: a 5.5 m wide x 5.8 m high access decline and a 5.5 m wide x 6.0 m high conveyor decline.
An exploration ramp was developed from the New Afton open pit to provide early access for Lift 1 development and construction but is no longer
accessible since the East Cave breakthrough to surface. Emergency egress is available through a fresh-air raise equipped with an Alimak elevator and a staging area.
| 13.4.3 |
B3 Cave
|
The B3 block cave extraction level is approximately 160 m below the mined-out Lift 1 and 760 m below surface. The B3 footprint measures
approximately 250 x 125 m for a footprint area of approximately 31,000 m2; this is smaller than the Lift 1 and
C-Zone block cave footprints. The B3 cave has a total of 65 drawbells.
Ramp development from Lift 1 to the B3 cave area began in 2015. The advanced-style method of undercutting commenced in the western footprint
extent in December 2020, with drawbell development beginning in June 2021. The initial interaction of the B3 caved zone with the Lift 1 extraction level is interpreted to have occurred in August
2022 and construction of the B3 cave was completed in the fourth quarter of 2022.
The B3 extraction level is designed with four longitudinal strike drives and 111 drawpoints arranged in a straight-through (El Teniente-style)
pattern. Drawbell spacing is 16.5 x 27.0 m. Ore passes are located on the level’s east side.
The undercut level was designed 18 m above the extraction level (floor-to-floor) with five undercut strike drives. An apex level was developed in
the expected critical hydraulic radius (the expected hydraulic radius required for the cave to self-propagate) to de-risk initial caving; it was successfully omitted from the remainder of the
footprint to reduce development costs. A haulage level where haul trucks are loaded from chutes at the bottom of the ore passes is located 20 m below the B3 extraction level.
| 13.4.4 |
C-Zone
|
The C-Zone extraction level is located approximately 390 m below the B3 extraction level and 1,150 m below surface. The footprint of the C-Zone
measures approximately 460 x 120 m for an area of approximately 55,000 m2. Development of the dual decline from
the B3 area to the C-Zone commenced in 2019 and reached the C-Zone footprint in the second quarter of 2022. Undercut blasting commenced in mid-2023 and the first C-Zone drawbell was blasted in
October 2023. Coeur achieved commercial production at C-Zone in the fourth quarter of 2024, with the materials handling system coming online and the cave footprint reaching the targeted
empirical hydraulic radius for self-cave propagation.
|
New Afton Operations
British Columbia
Technical Report Summary
|
Following the success of the reduced apex level at the B3 cave, the apex level was omitted from the C-Zone design, eliminating approximately
2,000 m of development originally planned in the feasibility study design.
The undercut level is 20 m above the extraction level; it includes 18 undercutting drives that are designed to sit directly above the 18 lines of
the drawbells on the extraction level. The southern end of each undercut drive includes a wider section for the purpose of slot blasting. The undercut level features two ore passes connecting
down to the haulage level and one temporary vent raise to the extraction level.
The extraction level has seven transverse crosscuts, 91 designed drawbells, and a total of 177 drawpoints arranged in a herringbone layout with a
drawbell spacing of 18.0 x 27.0 m. The north–south alignment of the strike drives allows for targeting of the ore contact on the south border of the cave, and provides increased flexibility and
improved automation capability. The extraction level has four access drives that connect the extraction footwall drive to the main C-Zone footwall drive, itself located to the north of the
footprint. The extraction footwall drive features seven ore-passes and one ventilation raise that each connect to the haulage level below.
The haulage level is located north of the cave footprint and 25 m below the extraction level. The haulage level contains the gyratory crusher in
the center of the level, multiple large muck storage areas, battery bays on either side of the level, and a motor room access drive. The level has three accesses to the main C-Zone footwall
drive as well as seven ore passes and two ventilation raises connecting to levels above and below.
The ventilation level lies 20 m below the extraction level and runs east–west across the footprint, with 17 ventilation raises connecting up to
the southern ends of the 17 extraction crosscuts.
The dewatering level is located at the lowest elevation of the C-Zone level and connects to the bottom of the conveyor declines. This level
includes a ventilation raise up to the haulage level, the C-Zone conical sumps, and the main dewatering infrastructure.
| 13.4.5 |
East Extension
|
The East Extension is located 120 m east of the C-Zone block cave, and 150 m above the C-Zone extraction level. East Extension mineral reserves
extend approximately 200 m vertically and 140 m along strike. The current design has 10 levels, spaced at 20 m vertical intervals, with ramp access from the east. Each level has a single or
second parallel ore drive running east–west, with dimensions of 5.0 m wide x 5.0 m high.
There are 114 stopes designed in three panels to optimize scoop productivity; the panels are separated by 5 m thick sill pillars. Based on
geotechnical core data and stope stability analysis, stopes were designed with dimensions of 14 m long x 20 m high and a width up to 20 m. Stoping is sequenced bottom-up within each panel and
retreats eastward to the ramp access on each level. After the ore is mucked out, stopes will be backfilled using a combination of rockfill and cemented rockfill. Cemented rock fill will be mixed
within designated mixing sumps at a target cement content of 7%. Other potential options for cemented rock fill mixing are being investigated using a mobile mixer. Material testing of the
cemented rock fill may allow for adjustments to the cement content.
|
New Afton Operations
British Columbia
Technical Report Summary
|
Development of the East Extension ramp is scheduled to commence in 2028, and ore production is planned to take place concurrently with production
from the C-Zone block cave from 2028–2032.
| 13.5 |
Materials Handling
|
The materials handling system consists of ore passes, underground crushers, a conveyor system to surface, and underground truck haulage.
| 13.5.1 |
B3 Cave
|
At the B3 cave, LHDs muck and tram the ore from the drawpoints to ore passes on the extraction level. B3 ore passes are 34.5 m high with a
storage capacity of approximately 950 t. Ore is then hauled up-ramp to the Lift 1 gyratory crusher using 45 and 50 t articulated dump trucks, for a one-way haulage distance of approximately
1,400 m. No mineral reserve is estimated for the B3 cave (see discussion in Chapter 13.9).
| 13.5.2 |
C-Zone
|
C-Zone ore passes transfer broken ore from both undercut and extraction levels to the haulage level. Extraction-level ore passes are spaced such
that the maximum tram distance from any drawpoint is ≤150 m. Grizzlies are installed on the ore passes to size material prior to crushing, and oversized material is either handled at the
drawpoint or in a remuck with a mobile rock breaker. The ore passes link the undercut level and extraction level to the haulage level.
Development waste is handled through the same production ore passes but separately, using strict procedures and communication between extraction-
and haulage-level workers. A waste storage bay on the haulage level is used to stockpile waste for batch crushing and conveying. All ore and waste is transported to surface via the crushing and
conveying system. The system consists of two FLSmidth 1,100 x 1,800 mm gyratory crushers, located on the Lift 1 and C-Zone haulage levels. The C-Zone crusher is located outside of the
anticipated cave-induced abutment stress zone.
Trucks and LHDs dump directly into the gyratory crushers; both crushers have two dump points to increase dumping efficiency and shorten cycle
times. Each crusher is equipped with a remotely controlled rock breaker. Below the crushers are 800 t surge bins that feed crushed material onto the conveyor belt system. The two gyratory
crushers can feed the conveyor system simultaneously by adjusting their respective apron feeder speeds at the bottom of the ore bins.
The Lift 1 conveyor system consists of five conveyors and transfer stations to surface. The C-Zone conveyor system consists of four conveyors and
transfer stations, tying into the Lift 1 conveyor system at its first transfer station. Conveyors are suspended from the back of the conveyor declines to allow vehicle traffic underneath. The
entire materials handling system is controlled by one operator from a control cab at the crusher and two employees who perform system checks and empty the tramp steel bin. The system is also
equipped to run remotely on surface from the Integrated Operations Centre.
|
New Afton Operations
British Columbia
Technical Report Summary
|
A jaw crusher installed during Lift 1 mine development is available as a back-up crusher and has a capacity of 6,700 t/d. Additionally, an MMD
GPHC Ltd. 625 mineral sizer was installed as a temporary crusher in the C-Zone conveyor decline to improve material handling efficiency during development and construction of C-Zone and is now
moved to a permanent location to additionally reduce material size and optimize mill grinding efficiency and metal recovery at full production from C-Zone.
The peak conveyor capacity is 1,200 t/h, although an average operating rate of 1,000 t/h is typical. Through shift change, the conveyor system is
operated remotely from the Integrated Operations Center providing an extra hour of conveying. Once the belts are emptied, the system can be shut down to conserve energy.
| 13.5.3 |
East Extension
|
East Extension materials handling will be managed by trucking ore from the stopes to the primary crusher location on C-Zone. Remote-enabled 15 t
LHDs are planned for East Extension production, with 50 t haul trucks for material movement to the crusher. The average haul distance for trucks from the level will be approximately 2,000 m from
level to crusher, down a 13% ramp.
| 13.6 |
Underground Infrastructure
|
| 13.6.1 |
Maintenance and Workshops
|
All maintenance work can be performed underground in the 2,500 m2
maintenance shop. The main shop consists of one high-bay equipped with a 40 t overhead crane, three smaller bays, one welding bay, one parts storage bay, and an access drift. Up to six
underground haul trucks can be worked on simultaneously in the large high bay. Oil and grease are stored in an adjacent bay equipped with a fire door and pumped throughout the shop to dispensing
racks.
A second underground maintenance shop is under development for C-Zone, with construction scheduled for completion in 2026. It will consist of one
high bay equipped with a 20 t overhead crane, three smaller maintenance bays, a lunch/office room, a warehouse, an electrical room, tool and storage rooms, and a lube room.
Battery charging bays are in select locations across Lift 1, B3 and C-Zone to support the battery electric fleet. Battery charging bays are
typically equipped with 2 t back-mounted monorails and can hold four batteries at a time for charging. Small auxiliary service bays on the B3 and C-Zone levels currently accommodate minor
equipment repairs.
|
New Afton Operations
British Columbia
Technical Report Summary
|
| 13.6.2 |
Fuel Bay
|
A single underground fuel bay is located adjacent to the lift 1 haulage level, with two satellite fuel bays located on the B3 footwall and C-Zone
decline. The fuel bay contains two 5,000 L fuel tanks each mounted on a cassette-style mobile platform. The fuel tanks are placed inside a containment area equipped with an automatic fire door.
Once per day, the fuel cassette is loaded onto a multi-purpose cassette carrier and driven to surface to be filled. In addition to fuel, the fuel bay stores grease, washer fluid, and other
supplies needed for equipment maintenance.
| 13.6.3 |
Batch Plant
|
All concrete and shotcrete products used underground are produced at the on-site batch plant. The truck-mix-style plant can produce over 80 m3 of product per shift. Control of the plant is through a dedicated system that has pre-programmed recipes for each
product required. Shotcrete and concrete products are delivered via 4 or 6 m3 underground transmixers.
| 13.6.4 |
Refuge Stations
|
Underground refuge stations are provided throughout the mine to safeguard personnel during emergencies. Coeur uses a combination of permanent
constructed refuge chambers within each block cave production footprint, and semi-portable containerized refuge stations elsewhere.
| 13.6.5 |
Utility and Fire Water
|
Fresh water from Kamloops Lake is provided to the underground mine for both utility and fire water use. Underground water supply is via a 6-inch
(approximately 15 cm) steel pipeline suspended from the back of the main conveyor declines and distributed throughout the mine. The crushers and conveyor systems and primary underground
maintenance shops are outfitted with fire detection and sprinkler suppression systems.
| 13.6.6 |
Compressed Air and Electricity
|
Compressed air is run throughout the mine and is supplied by compressors located near the portal. Smaller auxiliary compressors installed
underground provide additional compressed air locally for high-use applications. Electrical power is reticulated through the mine at 13.8 kV via a ring main system. Permanent and portable
underground substations step power down to 600 V for service equipment.
| 13.6.7 |
Communications
|
The mine site runs an extensive communication system that comprises a fiber-optic network, two-way Tetra radio system and wi-fi. This
configuration enables services such as process control, automated LHD operations, business data, seismic monitoring, closed circuit television, security access, and fire alarm network, private
long-term evolution network on surface and underground, and two-way voice communication.
|
New Afton Operations
British Columbia
Technical Report Summary
|
| 13.7 |
Ventilation
|
The current ventilation layout is a push–pull system with six ventilation raises to surface: three intake raises and three exhaust raises. The
intake raises (VR5, VR6, and VR7) are fitted with 800 hp axial fans. The exhaust shafts (VR2, VR3, and VR4) are fitted with 600 hp axial fans. The main conveyor portal also exhausts air from the
mine, as shown in Figure 13‑1.
The three intake raises supply approximately 1,150,000 cfm of fresh air to the top of the access decline, where air is split into two sections,
with approximately 600,000 cfm directed down the access decline and 550,000 cfm directed down the fresh air intake. The conveyor decline exhausts approximately 250,000 cfm from the mine with the
remainder flowing through the exhaust raises. Primary air flows are monitored and tracked via the on-site distributed control system.
Development faces and temporary access areas (such as the undercut level) are ventilated using auxiliary fans with ventilation ducting, while
major production areas (such as the extraction levels) are ventilated using either flow- through ventilation or via a fan in a bulkhead design.
The B3 cave ventilation circuit feeds from and exhausts into the existing mine ventilation circuit. B3 has fresh air delivered to the working
area via the B3 cave access ramp. The lower portion of the haulage ramp where trucks are loaded will be fed from a fan and ducting. The air then flows into the footwall drive. Flow continues to
the west side of the B3 cave footprint where it then flows east across the extraction strike drives. The air from the B3 cave extraction then exhausts up two vertical raises on the eastern side
of the footprint to the existing mine return air circuit.
Ventilation to the C-Zone is supplied through a push-pull system, using the same main surface fans currently supplying air to Lift 1 and B3, as
well as booster fans in the C-Zone exhaust air path. Fresh air enters the footwall drive from the Lift 1 access decline via a 4.0 m diameter vertical raise from the top of the C-Zone decline. It
then flows through the extraction crosscut drives before entering the return air circuit. Fresh air is provided to the undercut level using auxiliary fans and flexible ducting from the footwall
drive. Fresh air to the haulage level flows through each haulage leg from the footwall drive and travel to the extraction level to be exhausted into the return air circuit. The conveyor drives
and a second 4.0 m diameter raise exhausts all the air up to the Lift 1 return air circuit, which exhausts the air out of the mine.
The East Extension is estimated to require 275 kcfm of airflow. During development, 135 kcfm will be provided to the upper and lower ramp by two
200 hp fans in parallel. Once the main access ramp is connected, 275 kcfm will be redirected from the C-Zone to flow through the East Extension.
|
New Afton Operations
British Columbia
Technical Report Summary
|
| Figure 13‑1: |
Ventilation Schematic
|
Note: Figure prepared by Coeur, 2026.
|
New Afton Operations
British Columbia
Technical Report Summary
|
| 13.8 |
Blasting and Explosives
|
Three explosives magazines are located on site: two on surface, and two underground. The surface magazines hold ammonium nitrate fuel oil (ANFO),
bulk emulsion, and caps and boosters. Development mining explosives and production explosives are held in separate areas. The underground magazine has four separate bays, capable of holding all
types of explosives. Deliveries are received weekly and placed in the appropriate storage area.
| 13.9 |
Production Schedule
|
The LOM plan is based on the C-Zone block cave, and longitudinal stoping at the East Extension.
Mining of the B3 block cave is expected to be completed in Q1 2026. Material is continuing to be drawn from the B3 cave from outside the stated
proven and probable mineral reserves. This material is unclassified and is not included in the mineral reserve estimates. Draw will cease from the B3 cave at such a time as the observed grades
become uneconomical or the approaching C-Zone cave induces safety risks.
C-Zone mining production is expected to ramp up to approximately 5.4 Mt of ore in 2026 and 5.4–6.0 Mt/a from 2026–2032. In periods when the
mining rate exceeds the processing rate, intermediate-grade ore will be stockpiled on surface until it can be processed.
Development of the East Extension access ramp is scheduled to start from the top and bottom in 2028, and the first ore from East Extension is
expected in 2028. From 2028–2031, the East Extension is expected to provide approximately 500 t/d of high-grade supplementary mill feed.
With the ramping up of C-Zone block cave, the processing rate is planned to increase from an average of 13,750 t/od at the start of 2026 to full
capacity of approximately 16,000 t/d by the end of 2026. These processing rates were achieved in the past during mining of the Lift 1 block caves. Feed grades are planned to increase as C-Zone
caving advances into the core of the deposit, peaking in 2027 and 2028.
The current mine life is to 2032, based on the production plan shown in Table 13‑1. A cross-section through the mine showing the final mine
layout was provided in Figure 12‑1.
| 13.10 |
Equipment
|
The required mobile mining equipment to support current block cave production and C-Zone development is in place. Mining activities are carried
out by Coeur personnel using Owner equipment. Mining contractors can be employed if required; this is mostly to support C-Zone cave construction. The purchase of additional mining equipment is
included in the LOM plan to facilitate the C-Zone production ramp up and mining of the East Extension zone.
|
New Afton Operations
British Columbia
Technical Report Summary
|
| Table 13‑1: |
LOM Production Plan
|
|
Units
|
2026
|
2027
|
2028
|
2029
|
2030
|
2031
|
2032
|
Total
|
|||||||||||
|
Underground Mining
|
|||||||||||||||||||
|
B3 ore tonnes mined
|
kt
|
—
|
—
|
—
|
—
|
—
|
—
|
—
|
—
|
||||||||||
|
C-Zone ore tonnes mined
|
kt
|
5,705
|
6,112
|
5,780
|
5,520
|
5,628
|
5,650
|
817
|
35,212
|
||||||||||
|
East Extension ore tonnes mined
|
kt
|
—
|
—
|
120
|
360
|
252
|
230
|
—
|
962
|
||||||||||
|
Total ore tonnes mined
|
kt
|
5,705
|
6,112
|
5,900
|
5,880
|
5,880
|
5,880
|
817
|
36,174
|
||||||||||
|
Lateral development
|
m
|
357
|
—
|
4,183
|
1,689
|
—
|
—
|
—
|
6,229
|
||||||||||
|
Vertical development
|
m
|
116
|
—
|
—
|
—
|
—
|
—
|
—
|
116
|
||||||||||
|
Processing
|
|||||||||||||||||||
|
Ore processed
|
kt
|
5,641
|
5,993
|
5,966
|
5,942
|
5,877
|
5,844
|
913
|
36,176
|
||||||||||
|
Gold feed grade
|
g/t
|
0.68
|
0.81
|
0.83
|
0.74
|
0.58
|
0.42
|
0.31
|
0.67
|
||||||||||
|
Copper feed grade
|
%
|
0.79
|
0.88
|
0.89
|
0.80
|
0.64
|
0.49
|
0.35
|
0.74
|
||||||||||
|
Silver feed grade
|
g/t
|
1.87
|
2.13
|
2.08
|
2.01
|
1.57
|
1.27
|
0.80
|
1.79
|
||||||||||
|
Gold recovery
|
%
|
83.8
|
84.6
|
84.9
|
84.6
|
82.9
|
81.6
|
80.4
|
83.72
|
||||||||||
|
Copper recovery
|
%
|
87.9
|
88.9
|
89.3
|
89.0
|
87.7
|
86.9
|
86.3
|
88.28
|
||||||||||
|
Silver recovery
|
%
|
74.9
|
75.5
|
75.9
|
75.3
|
73.6
|
72.6
|
69.8
|
74.48
|
||||||||||
|
Gold production
|
koz
|
104.13
|
132.17
|
134.36
|
120.24
|
90.15
|
64.93
|
7.34
|
653.32
|
||||||||||
|
Copper production
|
Mlb
|
87.40
|
103.64
|
104.00
|
93.33
|
72.63
|
54.73
|
6.17
|
521.90
|
||||||||||
|
Silver production
|
koz
|
256.74
|
309.46
|
302.57
|
288.78
|
217.80
|
173.24
|
16.48
|
1,565
|
||||||||||
When the C-Zone block cave is in full production, ten diesel LHDs (Sandvik LH410) will operate on the extraction level to muck and tram ore from
the drawpoints to the ore passes. These LHDs will have the capability to be automated. In addition, five CAT R1300G LHDs will support the fleet in smaller tunnels.
On the C-Zone haulage level, four large battery-electric LHDs (Sandvik LH518iB) will be used for tramming the ore from the bottom of the ore
passes to the C-Zone gyratory crusher.
East Extension mining will require three LHDs and two trucks during production. The levels will have two remucks located within 40 m of the main
access ramp to be used as mixing bays and truck loading areas. Along the main access ramp, remucks will be spaced every 150 m to facilitate development. The development fleet for East Extension
will include four jumbos, five bolters, four scissor lifts, two ANFO loaders, four LHDs, and three trucks.
Following completion of B3 mining, and C-Zone development, existing mining equipment will be transferred to the East Extension. This includes
haul trucks, drill jumbos, bolters, shotcrete sprayers, production drills, an ANFO loader, and transmixers. The LOM plan includes the purchase of four LHDs, an additional haul truck, and an
additional ANFO loader.
|
New Afton Operations
British Columbia
Technical Report Summary
|
A list of the major mobile mining equipment, showing the current fleet and additional requirements to achieve the LOM plan, is provided in Table
13‑2.
| 13.11 |
Personnel
|
As of the end of 2025, the workforce totaled 652 employees, 81% of which (527 employees) were hired from the Kamloops region. A total of 169 of
New Afton employees identify as Indigenous (26% of the workforce) and 38 are SSN members (6% of the workforce). This does not include fixed-term contracts, part-time employees and includes
active and inactive employees.
|
New Afton Operations
British Columbia
Technical Report Summary
|
|
Table 13‑2:
|
Key Equipment List
|
|
Type
|
Model
|
Current Quantity
(Dec 2025)
|
Additional LOM Requirements
|
||||
|
Drill jumbo
|
Sandvik two boom
|
4
|
—
|
||||
|
Rock bolter
|
Sandvik bolters
|
8
|
—
|
||||
|
LHD
|
Sandvik LH410
|
10
|
—
|
||||
|
LHD
|
Sandvik LH518iB
|
4
|
—
|
||||
|
LHD
|
CAT R1600
|
6
|
—
|
||||
|
LHD
|
Large diesel LHDs (15t +)
|
6
|
2
|
||||
|
LHD
|
CAT1300
|
3
|
2
|
||||
|
Truck
|
CAT AD45
|
4
|
1
|
||||
|
Long hole drill
|
Sandvik DL 420 & 430
|
4
|
—
|
||||
|
Explosives
|
Emulsion & ANFO loaders
|
2
|
1
|
||||
|
Concrete mixer
|
Transmixers
|
8
|
—
|
||||
|
Shotcrete
|
Normet & Macleans prayers
|
4
|
—
|
||||
|
Utility
|
Scissor deck, boom truck & other
|
15
|
—
|
||||
|
Utility
|
Maclean blockholer
|
1
|
1
|
||||
|
Utility
|
CAT skid steer
|
5
|
—
|
||||
|
Utility
|
CAT 120/140 M grader
|
2
|
—
|
||||
|
Utility
|
CAT TH407 / TL943 telehandler
|
7
|
—
|
||||
|
Utility
|
CAT 930G IT loader
|
4
|
—
|
||||
|
Utility
|
MineMaster tractor
|
3
|
—
|
|
New Afton Operations
British Columbia
Technical Report Summary
|
| 14.0 |
RECOVERY METHODS
|
| 14.1 |
Process Method Selection
|
The process plant design is conventional and has no novel parameters. The plant design was based on the testwork discussed in Chapter 13.
Optimization activities completed since plant startup in 2012 have assisted in increasing capacities and efficiencies.
The processing flowsheet consists of conventional crushing and grinding circuits, a flotation circuit, and a gravity circuit to produce a
copper–gold concentrate. Run-of-mine ore is crushed at the two underground gyratory crushers and underground sizer (C-Zone only) and transported via conveyor belts to the crushed ore stockpile
on surface.
| 14.2 |
Flowsheet
|
A flow diagram for the process plant (excluding the underground crush-convey system) is provided in Figure 14‑1.
| 14.3 |
Throughput
|
In 2025, the New Afton Mine processed 46.06 Mt with average metallurgical recoveries of 85.65% for gold, 89.24% for copper, and 75.35% for
silver, including a small amount through ore purchase agreements. The processing plant throughput is currently limited by mine production and, with C-Zone ramping up over the next few years, the
New Afton Mine intends to take advantage of the existing processing capacity at the mill to process up to 16,400 t/d.
| 14.4 |
Plant Design
|
| 14.4.1 |
Crushing
|
Run-of-mine ore is crushed to minus 150 mm through one of two 1,100 x 1,800 mm FLSmidth gyratory crushers located underground at the Lift 1 and
C-Zone cave haulage levels. In the case of C-Zone, a secondary stage of crushing is performed by an MMD S625 sizer to produce minus 75 mm feed for the processing plant. The ore is then
transported to surface via conveyor belts. Ore is discharged onto a 120,000 wmt crushed ore stockpile.
Waste and low-grade ore are diverted from the mill feed to the WRSFs and low-grade stockpile, respectively.
|
New Afton Operations
British Columbia
Technical Report Summary
|
|
Figure 14‑1:
|
Process Flowsheet
|
Note: Figure prepared by Coeur, 2026.
|
New Afton Operations
British Columbia
Technical Report Summary
|
| 14.4.2 |
Grinding
|
Located beneath the crushed ore stockpile, two 1.8 x 11 m apron feeders regulate the flow of ore onto the SAG mill feed conveyor. The SAG mill is
an 8.5 m diameter x 4 m long Farnell-Thompson mill, driven by a 5,220 kW GE motor with a variable speed drive. The SAG mill discharge is screened over a 2.4 x 6.1 m Deister double-deck screen
with 7 x 28 mm apertures on the lower deck. The screen-deck was upgraded from single to double deck in 2015. Both the upper and lower deck oversize are recycled to the SAG mill-feed conveyor,
with the option of crushing this recycle stream using an FLSmidth XL600 Raptor cone crusher.
Secondary grinding is accomplished using a 5.5 m diameter x 9.8 m long Farnell-Thompson fixed-speed ball mill driven by a 5,220 kW motor, in
closed circuit with seven (five operating) Krebs GMax-26 hydrocyclones.
Approximately 7% of the cyclone feed can be diverted to a Gekko inline pressure jig and magnetic separation circuit for native copper and gold
recovery and magnetite rejection, with concentrate reporting to the concentrate thickener. While still available, the jig circuit is not currently in use for B3 and C-Zone processing due to the
primary hypogene mineralization. Approximately 8% of the cyclone feed reports to a Metso Skim- Air 500 flash flotation cell with concentrate reporting to the regrind circuit, the fine tails
reporting to the ball mill cyclone feed pump-box and the coarse tails reporting to the ball mill feed. The cyclone overflow reports to the tertiary circuit.
The tertiary grinding circuit was added in 2015. Tertiary grinding is accomplished using a Metso Vertimill 3000 in closed circuit with seven
(five or six operating) Krebs GMax-26 hydrocyclones. The tertiary cyclone overflow reports to the rougher flotation cells. Approximately 10% of the tertiary cyclone feed can be diverted to a
continuous CVD42 Knelson concentrator for native copper and gold recovery with concentrate reporting to the cleaner inline pressure jig feed. While still available, the CVD42 circuit is not
currently in use for B3 and C-Zone processing due to the primary hypogene mineralization. Both the SAG and ball mill circuit control is supported with an expert control system.
| 14.4.3 |
Flotation
|
The tertiary grinding cyclone overflow flows by gravity into the rougher flotation circuit, which consists of two staged flotation reactor cells
in series followed by six 100 m3 flotation tank cells in series. The two staged flotation reactor cells were commissioned in 2017. The concentrate from the rougher flotation cells is collected
in launders and flows by gravity to the regrind circuit; the tailings from the final rougher cell is discharged into the tailings pump-box.
The regrind circuit grinds the flash and rougher flotation concentrates, decreasing the particle size to 80% passing 35 μm to 40 μm prior to
upgrading in the cleaner flotation cells. The regrind circuit consists of a 932 kW Vertimill in closed circuit with the regrind cyclopac. The regrind cyclopac consists of six (five operating)
Krebs GMax-15 hydrocyclones.
The underflow stream from two of the operating regrind cyclones is processed through two XD-40 Knelson concentrators to recover liberated gold
from the regrind circuit. The Knelson concentrate discharges to the final concentrate pump-box, where it is pumped to the concentrate thickener. The Knelson concentrator tailings are discharged
back to the regrind cyclone feed pump-box. The regrind cyclone overflow discharges to the cleaner flotation circuit and the tailings flow to cleaner scavenger flotation. Cleaner scavenger
tailings report to the tailings pump-box.
|
New Afton Operations
British Columbia
Technical Report Summary
|
Three staged flotation reactor cells were added to the head of cleaner flotation in 2015 to increase cleaner flotation capacity. The concentrate
from these three cells is combined with the inline pressure jig final concentrate (when operating), Jameson concentrate, and regrind Knelson concentrates to produce the final bulk
copper–gold–silver concentrate for dewatering.
| 14.4.4 |
Dewatering
|
The final concentrate is pumped to the concentrate thickener which achieves an underflow slurry density of approximately 55% solids. The slurry
is pumped to an agitated tank and subsequently pumped into one of the two filter presses, where it is dewatered to approximately 8% moisture.
The dewatered concentrate is discharged from the filter presses directly into the concentrate storage shed, before truck transportation to either
the DP World Fraser Surrey Docks (DP World) container port for ocean shipment to a smelter, or to the Ashcroft terminal for transportation by rail to a smelter in Quebec.
In the case of DP World, concentrate is loaded into containers (two per truck) at the New Afton shed. These containers are stored at the port
then emptied into the bulk hold of the ship. Empty containers are returned to site for reloading.
In the case of Ashcroft, the concentrate is loaded into side-dump trucks at the New Afton shed then stored in stockpiles at the Ashcroft terminal
before loading into railcars.
| 14.4.5 |
Tailings
|
The rougher and cleaner-scavenger flotation tailings are combined in the mill and pumped to the thickened and amended tailings plant which
includes a 45m Metso paste thickener. The slurry discharges to the thickener feed tank. Flocculant is added at the feed tank and/or the thickener feedwell. The slurry exits the bottom of the
feedwell into the thickener and is separated into two streams: supernatant thickener overflow and sedimented thickener underflow. The thickener underflow solids concentration is typically
maintained in the 61–65 wt% solids range.
The thickener underflow is pumped out from the bottom of the thickener using a centrifugal pump. The pump discharges to a distribution header
which splits the flow equally between the operating cement mixing and tailings pump trains. There are two operating pump trains and one on standby. Each pump train consists of a paste mixer, a
pump-box, a centrifugal charge pump and a high-pressure positive displacement pump. The positive displacement pumps discharge into a combined line, with the deposition location(s) controlled at
a valve yard close to the TSF. Tailings can be discharged to the New Afton TSF or at one of four spigot points along the Afton Pit TSF.
The thickener overflow exits at the top of the thickener via a weir into a collection launder. The launder discharges to a pipe which feeds the
thickener overflow pump-box. The water is returned to the mill process water system to maintain the mill operational water balance. Anti-scalant is added to control calcium carbonate buildup
resulting from lime addition in the process plant and the relatively high temperature of the recirculating process water.
|
New Afton Operations
British Columbia
Technical Report Summary
|
Thickening the tailings reduces the amount of water placed in the Afton Pit TSF and ultimately reduces the amount of water that will percolate
into the underground workings. The cement amendment process transitions the tailings from a fluid-like state to a soft-soil-like state within seven days of placement. This control guards against
tailings exfiltration through the broken cave-material associated with the Lift 1 East Block cave.
The TSF facilities are discussed in Chapter 15.
| 14.5 |
Equipment Sizing
|
| • |
SAG mill; Farnell-Thompson 8.5 x 4.0 m; 5220 kW; variable speed;
|
| • |
Cone crusher; FLSmidth Raptor XL600; 447 kW;
|
| • |
Ball mill; Farnell-Thompson 5.5 x 9.8m; 5220 kW;
|
| • |
Tertiary mill; Metso VTM3000; 2,237 kW;
|
| • |
Regrind mill; Svedala VTM1250; 932 kW;
|
| • |
Ball mill cyclones; Krebs 7 x 66 cm gMax;
|
| • |
Tertiary cyclones; Krebs 7 x 66 cm gMax;
|
| • |
Regrind cyclones; Krebs 6 x 38 cm gMax;
|
| • |
Flotation recovery units:
|
| o |
1 x Metso SkimAir 500;
|
| o |
5 x Woodgrove staged flotation reactors (two in rougher and three in cleaner circuit);
|
| o |
6 x Metso TC 100;
|
| o |
7 x Metso TC 20;
|
| o |
5 x Metso TC 5;
|
| • |
Gravity recovery units:
|
| o |
2 x Knelson XD40 batch concentrators;
|
| o |
1 x Knelson CVD42;
|
| o |
2 x Gekko inline pressure jigs;
|
| • |
Concentrate thickener; Metso:Outotec 18 m high rate thickener;
|
| • |
Concentrate filter; 2 x IPM MCFH filter presses;
|
|
New Afton Operations
British Columbia
Technical Report Summary
|
| • |
Tailings thickener; Metso 45 m paste thickener;
|
| • |
Metso Courier 6X SL on-stream analyzer and PSI 300 particle size analyzer;
|
| • |
Delta V distributed control system.
|
| 14.6 |
Power and Consumables
|
| 14.6.1.1 |
Power
|
Most of the power consumption at the mill occurs in the grinding circuit. With a SAG mill that requires an average of 4.5 MW, a ball mill
requiring an average of 5.45 MW, a tertiary mill requiring an average of 2.1 MW and a regrind mill requiring an average of 0.45 MW, an average consumption of 105,000 MWh per annum is needed to
grind the ore to the optimal grind size for flotation and gravity separation.
| 14.6.1.2 |
Water
|
Water drawn from Kamloops Lake is used for applications requiring fresh rather than reclaimed water, as well as to make up any deficit in the
site water balance. Water is periodically reclaimed from the pond generated by consolidating tailings in the New Afton TSF as required to maintain a low water inventory and transported via the
Pothook TSF for use as mill process water. The dewatering system for the underground mine is also used as mill process water. The majority of mill process water is currently reclaimed from the
tailings thickener overflow. Minor sources of process water include the Historical Afton TSF wells and the dewatering system for the Afton Pit TSF.
| 14.6.2 |
Consumables
|
The major consumables used in processing include cement, grinding media, lime, collector (potassium amyl xanthate), and frother.
| 14.6.3 |
Personnel
|
The personnel requirements for the LOM average is 75 personnel within the Processing department including the surface, tailings, metallurgy, and
assay laboratory areas.
|
New Afton Operations
British Columbia
Technical Report Summary
|
| 15.0 |
INFRASTRUCTURE
|
| 15.1 |
Introduction
|
The New Afton Mine is in operation and has all the required infrastructure to support the operation. A plan of the mine site is shown in Figure
15‑1.
|
15.2
|
Surface Buildings and Facilities
|
The following administration and technical offices, as well as operations and maintenance facilities support the New Afton operations:
| • |
Security and first aid buildings equipped with an ambulance. First aid personnel are available full-time at the mine;
|
| • |
Emergency services building, equipped with two fire engines and mine rescue equipment. Mine rescue personnel are available full-time at the mine;
|
| • |
Ore concentrator (mill) building;
|
| • |
Assay laboratory;
|
| • |
Thickened and amended tailings plant;
|
| • |
Millwright shop, mobile maintenance shop, and tire shop;
|
| • |
Warehouse buildings and laydowns;
|
| • |
Integrated operations center that centralizes key mine planning, operations, and maintenance personnel;
|
| • |
Office buildings house the administration, mine operations and technical services, capital projects and i.t., safety/training, and environment/permitting departments;
|
| • |
Mine dry and contractor dry buildings;
|
| • |
Batch plant near the mine portal that produces the concrete and shotcrete required for mining operations;
|
| • |
Explosives magazines for ANFO, bulk emulsion, caps, and boosters;
|
| • |
Exploration and core cutting buildings;
|
| • |
Twinned 138 kV site transformers and substations;
|
| • |
Main surface ventilation fans and heaters;
|
| • |
Kamloops Lake pumphouse and pipeline.
|
|
New Afton Operations
British Columbia
Technical Report Summary
|
|
Figure 15‑1:
|
Infrastructure Layout Plan
|
Note: TAT = thickened and amended tailings; APTSF = Afton Pit TSF; HATSF = historical Afton TSF; PTSF = Pothook TSF; NATSF = New
Afton TSF.
|
New Afton Operations
British Columbia
Technical Report Summary
|
| 15.3 |
Roads and Logistics
|
Mine access is discussed in Chapter 4.2. A paved road staffed with a security gate connects the highway to the mine offices. A network of roads
on the site service the various mine facilities.
| 15.4 |
Stockpiles
|
Run-of-mine ore is discharged onto a 120,000 wmt stockpile. Two 1.8 m × 11 m apron feeders located beneath the crushed ore stockpile regulate ore
flow onto the SAG mill feed conveyor.
During periods when mining rates exceed processing capacity, intermediate-grade ore may be stockpiled on surface for later processing.
Intermediate-grade C-Zone mineral reserves may also be segregated and stockpiled on surface using a diverter on the conveyor as it exits the
underground portal. All stockpile locations and volumes are permitted and approved through end of mine.
| 15.5 |
Waste Rock Storage Facilities
|
Waste rock produced by block cave mining is deposited in the Afton Pit TSF or within designated block cave subsidence areas, both of which are
classified as potentially acid generating (PAG) storage areas.
Several historical waste rock dumps developed from the Afton pit between 1974 and 1977 are located south and west of the pit and were covered and
revegetated at mine closure in 1997 using glacial till and topsoil. Portions of these historical dumps have since been overlain by permitted tailings and dam infrastructure, and an additional
historical waste rock pile located northwest of the historical Afton TSF was also reclaimed in 1997.
Select historical waste rock is reused as construction material where appropriate, and all excavated waste rock is geochemically characterized in
accordance with the site metals leaching/acid rock drainage (ML/ARD) management plan, with material exhibiting a neutralization potential ratio of <2.0 placed in the subsidence zone or
co-deposited in the Afton Pit TSF.
| 15.6 |
Tailings Storage Facilities
|
There are four TSFs on the New Afton mine site:
| • |
The Afton Pit TSF, which is the primary facility for LOM tailings deposition;
|
| • |
The New Afton TSF, which holds the Lift 1 and majority of B3 cave tailings;
|
| • |
The historical Afton TSF, which holds the tailings from the original Afton operation and is inactive;
|
| • |
The Pothook TSF, which acts as a site water reservoir, and currently does not receive any tailings.
|
|
New Afton Operations
British Columbia
Technical Report Summary
|
| 15.6.1 |
Afton Pit TSF
|
The Afton Pit TSF is a historical open pit that was mined from 1977 to 1997 and is now used for storage of thickened and cement-amended tailings.
An overview of the thickened and cement amended tailings plant is provided in Chapter 14.4.5. Tailings have been deposited into the Afton Pit TSF since late-2022; commencing after Lift 1 caving
activities ceased. No active caving is currently occurring vertically underneath areas of thickened and cement-amended tailings deposition to reduce the risks of fines and dilution entering the
cave.
The thickened and cement amended tailings are currently discharged into the Afton Pit TSF from three discharge points along the west side of the
pit rim, and from a fourth deposition point on the southeast side of the pit rim. The overall deposition objective is to form a tailings surface that slopes to the northeast to maintain
potential surface ponding away from the B3 and C-Zone cave footprints and to direct surface drainage towards the water reclaim infrastructure situated along the Afton Pit TSF access road.
As at December 31, 2025, 8.8 Mt were deposited into the Afton Pit TSF. The current LOM plan is to deposit 44 Mt in the facility, which will use
approximately 55-60% of the total Afton Pit TSF storage capacity. The total open volume below the pit rim is 72 Mt and subsidence is expected to generate an additional 6.5 Mt capacity around the
pit area. The final allocated amount that can be deposited in the Afton Pit TSF depends on the density of the tailings (assumed 1.3 t/m3) and how C-Zone subsidence ultimately affects the Afton Pit TSF geometry.
| 15.6.2 |
New Afton TSF
|
The New Afton TSF is located approximately 1 km south of the Afton Pit TSF. Containment is provided by natural topography and five dams (A, B, C,
South, and West dams). The starter dams were initially constructed in 2011, and the facility was raised annually until 2021. Full time tailings deposition ceased in 2022, when the Afton Pit TSF
came online.
The facility partially overlies a historical WRSF that is up to 70 m thick and covered by a geomembrane liner. Seepage through the dams and
runoff from the downstream shells is collected using ditches and water management ponds located downstream of each dam.
Block cave induced subsidence is expected to affect a portion of the facility. To control the risk of tailings release, a stabilization program
was developed. The New Afton TSF has nominal remaining capacity of approximately 2 Mt, however there are no plans to actively deposit in this facility to align with the overall stabilization
objectives although small volumes of tailings may be placed throughout the life of mine to support water management and closure grading activities.
| 15.6.3 |
Historical Afton TSF
|
Containment at the historical Afton TSF is provided by two rockfill dams constructed with till cores (the East and West dams) and by natural
topography formed of glacial sediments and bedrock. Portions of the downstream slope of the East Dam are partially buried under waste rock placed during historical operations. Block cave induced
subsidence is expected to affect a portion of the facility. To control the risk of tailings release, a stabilization program was developed.
|
New Afton Operations
British Columbia
Technical Report Summary
|
The impoundment contains an estimated 37 Mt of tailings that were hydraulically deposited from spigots on the north side of the impoundment.
| 15.6.4 |
Pothook TSF
|
The facility is located approximately 200 m northeast of the New Afton TSF and is used as a water storage reservoir with a capacity of
approximately 300,000 m³. No additional tailings deposition is planned to reserve this capacity to store excess stormwater volumes and to buffer water volumes required to support processing
operations. Storage containment is provided by one dam (Pothook TSF dam) and by natural topography that was modified by historical mining of the Pothook open pit.
No tailings deposition is expected until site closure, when tailings deposition may be used to support desired surface grading activities. The
Pothook TSF currently acts as a water reservoir for site requirements. Water is transferred from the New Afton TSF to the Pothook TSF where it is then reclaimed for milling process via a reclaim
intake located near the right abutment at the north side of the facility. Water transfer from the New Afton TSF pond, including discharge from the New Afton TSF stabilization dewatering wells,
report to the south end of the Pothook TSF.
| 15.6.5 |
Tailings Facility Stabilization
|
C-Zone caving induced subsidence is projected to overlap with Dam C of the New Afton TSF and East Dam of the historical Afton TSF. The projected
ground movement from the block cave is well understood, this has led to the successful development of monitoring and stabilization plans during the Lift 1 and B3 cave mining for the New Afton
TSF and historical Afton TSF. Stabilization strategies for both the New Afton TSF and historical Afton TSF include pond removal, dewatering/depressurization of the in-situ tailings, and
consolidation of in situ tailings before mining induced subsidence is expected to affect the facilities.
The historical Afton TSF stabilization objectives were achieved, and no additional mitigation plan is necessary at the Report date. The New Afton
TSF stabilization activities are materially completed and will receive verification from the Engineer of Record by the 2026 target date, which is approximately two years earlier than the
forecast C-Zone mining-induced subsidence is expected to impact the New Afton TSF.
With respect to maintaining the stabilized state of these facilities, ongoing dewatering, deformation monitoring, and subsidence progression
monitoring and forecasting continues to be a tailings management priority. Quantifiable performance objectives were set for each facility, and verifications are completed monthly to ensure
objectives continue to be met.
|
New Afton Operations
British Columbia
Technical Report Summary
|
| 15.6.6 |
Monitoring
|
Coeur has implemented a stringent subsidence monitoring and adaptive management plan during the stabilization and mining period to effectively
manage risk. The stabilization program involves New Afton TSF and historical Afton TSF Engineers of Record, and additional consultant review, following industry best practices for worker safety
and operations.
The New Afton TSF, historical Afton TSF and Afton Pit TSF and block cave induced subsidence is monitored/tracked through a combination of InSAR
(a radar satellite imagery technique), drone-based photogrammetry, and a comprehensive suite of surface and subsurface geotechnical instrumentation.
Subsidence models and site observations are continually reviewed and used to confirm understanding of the timing of ground movements, and to
verify that subsidence movement is projected to remain within the target stabilization areas of the affected facilities. The stabilization objectives are managed through quantifiable performance
objectives and Trigger Action Response Plans, and are updated as new information becomes available.
| 15.6.7 |
Performance Reviews
|
All TSFs located within the New Afton Operations area undergo thorough review and oversight from qualified professionals including, at minimum,
the following evaluations:
| • |
Weekly inspections by trained surveillance inspectors;
|
| • |
Quarterly inspections from the New Afton Mine TSF Qualified Person. (The TSF Qualified Person is a required role under to the Health, Safety and Reclamation Code for Mines in British Columbia. This role is currently fulfilled by the New Afton Tailings and Surface Superintendent.)
|
| • |
Annual inspections from facility Engineers of Record;
|
| • |
Twice annual site and technical review from the Independent Tailings Review Board (ITRB);
|
| • |
Dam safety reviews performed every five years;
|
| • |
Third-party reviews as required by regulators.
|
| 15.7 |
Water Management
|
The mine is characterized as having a net negative water balance (even in wet years); it relies on water pumped from Kamloops Lake to offset the
water balance deficit.
Coeur has developed a Site Water Management and Monitoring Plan which addresses how water is managed during operation and closure; the most
recent update was completed on November 14, 2023. This management plan covers physical water management on site, as well as monitoring of surface water to provide surveillance and early
identification of potential off-site impacts or variations from predicted water quality values.
|
New Afton Operations
British Columbia
Technical Report Summary
|
Tailings seepage water is collected surface water management ponds, in the mine workings, or via interception wells prior to entering the
underground workings. The water collected from these locations is pumped to the mill process water stream. Pond water from ongoing consolidation in the New Afton TSF is also reclaimed for reuse
in the mill.
Seepage water from the historical Afton TSF flows west from the northwestern portion of the facility to a seepage collection pond that maintains
control of the water through evaporation and pump-back for processing.
The mine site potable water treatment plant provides water to washrooms, kitchens, change
room showers, and sinks across the site. Bottled potable water is brought on-site for drinking.
| 15.8 |
Water Supply
|
Fresh water is drawn from Kamloops Lake and is used primarily for ore processing make-up water, as road dust suppressant, for vehicle wash-down,
fire control, and drilling. The majority of mill process water is currently reclaimed from the tailings thickener overflow. Minor sources of process water include the Historical Afton TSF wells,
the New Afton TSF wells, site dewatering wells, reclamation of consolidation water from the New Afton TSF, and the surface water reclaim system for the Afton Pit TSF.
Water balance modelling is used to track the inventory of water on site, as well as water consumption and water losses.
| 15.9 |
Camps and Accommodation
|
There is no onsite accommodation. Employees reside in adjacent communities.
| 15.10 |
Power and Electrical
|
Currently, BC Hydro supplies the mine with 49.5 MW of electrical power via a connection located between the Savona Substation and the Douglas
Substation. This connection consists of a 138 kV overhead line terminal and approximately 1.1 km of 138 kV transmission line to the mine site substation.
A BC Hydro transmission upgrade was completed in 2024 to increase the site demand capacity from 34.5 MW to 49.5 MW to support C-Zone production,
in addition to operation of the B3 block cave, new tailings thickener systems, water evaporators, and potential C-Zone fleet electrification. A new 40/53 MVA transformer and substation were
installed at the mine in mid-2024, twinning the existing site substation to provide site power supply redundancy, energize the underground, and to provide capacity for battery electric equipment
and future expansions.
|
New Afton Operations
British Columbia
Technical Report Summary
|
| 16.0 |
MARKET STUDIES AND CONTRACTS
|
| 16.1 |
Markets
|
The New Afton Operations produce a high-quality clean copper concentrate with typical copper grade, high gold grades,
payable silver credits, and relatively low impurity levels.
The current concentrate is readily marketable to any of several smelters or concentrate marketing firms. Smelting and refining terms are
generally similar and include treatment charges and refining charges which are generally known, with penalty charges for contaminants such as arsenic and mercury in the concentrates. Penalty
terms are generally more variable than the treatment and refining terms. Concentrates are typically sold through concentrate marketing firms, with long-term contracts that cover several years.
Coeur has established contracts and buyers for the concentrate products, and has an internal marketing group that monitors markets for its key
products.
Together with public documents and analyst forecasts, these data support that there is a reasonable basis to assume that for the LOM plan, that
the key products will be saleable at the assumed commodity pricing.
There are no agency relationships relevant to the marketing strategies used.
Product valuation is included in the economic analysis in Chapter 19, and is based on a combination of the metallurgical recovery, commodity
pricing, and consideration of processing charges.
| 16.2 |
Commodity Price Forecasts
|
Coeur uses a combination of analysis of three-year rolling averages, long-term consensus
pricing, and benchmarks to pricing used by industry peers over the past year, when considering long-term commodity price forecasts.
Higher metal prices are used for the mineral resource estimates to ensure the mineral reserves are a sub-set of, and not constrained by, the
mineral resources, in accordance with industry-accepted practice.
The long-term gold and copper price forecasts are:
| • |
Mineral reserves:
|
| o |
US$1,650/oz Au; US$3.50/lb;
|
| • |
Mineral resources:
|
| o |
US$2,500/oz Au; US$4.40/lb.
|
All commodity prices are advised by the corporate investment committee and revised as necessary throughout the budget
and forecast process. This guidance is used to keep all sites using the same basis for revenue. The sites do not advise prices or deviate from the prices provided.
|
New Afton Operations
British Columbia
Technical Report Summary
|
The economic analysis in Chapter 19 uses the reverting price curve assumptions outlined in Table 16‑1.
| 16.3 |
Contracts
|
Numerous contracts are in place to support ongoing mine operations at the Project. These include agreements covering maintenance services, fuel
supply, explosives, grinding media, milling reagents, concentrate transportation, port services in Vancouver, and third-party representation services related to concentrate sampling and analysis
at delivery. Contract terms and rates are generally consistent with industry norms and are periodically re-tendered or renegotiated as operational requirements dictate.
New Afton produces a high-quality copper concentrate characterized by typical copper grades, elevated gold content, payable silver credits, and
relatively low impurity levels. Due to its quality and sustained global demand for copper concentrates, the product is readily marketable to multiple smelters and concentrate marketing firms.
Smelting and refining arrangements typically include treatment and refining charges, with potential penalty charges applied for deleterious elements such as arsenic and mercury. Penalty terms
tend to be more variable than treatment and refining charges. New Afton does not engage in forward metal sales or hedging activities.
Current concentrate sales agreements include long-term offtake contracts with multiple counterparties. Agreements with Glencore cover the periods
2022–2026 and 2027–2030. An agreement with IXM Metals covers the period 2022–2027, and an agreement with Concord Resources covers the period 2022–2026. These arrangements provide diversified
market access and sales continuity for concentrate production.
Concentrate transportation and handling are supported by several long-term logistics agreements. Stk’emlupsemc-Arrow Transportation Limited
provides concentrate trucking and rail car loading services under an agreement covering 2022–2029. DP World Fraser Surrey provides rotainer receiving, storage, and vessel loading services under
an agreement covering 2022–2029. Ocean freight services are provided by Oldendorff Carriers under an agreement covering 2023–2026.
Coeur maintains additional contracts, agreements, and purchase orders for goods and services required for mine operations, with the most
significant relating to maintenance services, fuel supply, explosives, grinding media, milling reagents, and concentrate haulage. In addition, Coeur maintains a cooperation agreement with the
Stk’emlupsemc te Secwépemc Nation.
|
New Afton Operations
British Columbia
Technical Report Summary
|
|
Table 16‑1:
|
Commodity Price Forecast Used in Cashflow Analysis
|
|
Units
|
2026
|
2027
|
2028
|
2029
|
2030
|
2031+
|
|||||||||
|
Gold
|
US$/oz
|
4,550
|
4,000
|
3,800
|
3,600
|
3,100
|
3,100
|
||||||||
|
Copper
|
US$/lb
|
5.00
|
5.00
|
5.00
|
5.00
|
4.50
|
4.50
|
|
New Afton Operations
British Columbia
Technical Report Summary
|
| 17.0 |
ENVIRONMENTAL STUDIES, PERMITTING, AND PLANS, NEGOTIATIONS, OR AGREEMENTS WITH LOCAL INDIVIDUALS OR GROUPS
|
| 17.1 |
Baseline and Supporting Studies
|
The New Afton Operations were reviewed and permitted as a major mine under the BC Mines Act in 2007 and
received BC Environmental Management Act permits in 2010.
The M-229 permit was issued under the Mines Act and is administered by the Ministry of Mining and
Critical Minerals.
The effluent discharge permit 100224 and air discharge permit 100223 were issued under the Environmental
Management Act and administered by the Ministry of Environment and Parks.
| 17.2 |
Environmental Considerations/Monitoring Programs
|
The New Afton Operations are in compliance with all current permit conditions and requirements and there are no outstanding environmental issues.
Environmental monitoring for air quality, ambient noise and vibration, geochemistry, surface water quality, groundwater quality, aquatic
resources, flora and fauna, are completed regularly and reported per permit conditions.
| 17.3 |
Closure and Reclamation Considerations
|
Coeur carries out progressive reclamation, conducts research activities for reclamation programs, and partners with the SSN First Nation to
implement successful reclamation measures.
The purpose of the closure and post-closure monitoring and maintenance program is to evaluate and ensure that the site is safe, stable, and
non-polluting in accordance with the identified mine closure objectives. Monitoring and maintenance will be conducted to assess how the reclamation measures meet reclamation end-land-use
objectives. Activities will involve inspections, sampling, and assessments of physical, geochemical, and biological aspects.
The most recent reclamation liability cost estimate for the New Afton Operations, as submitted to the MCM on November 1, 2024, is approximately
C$70.4 million (US$ 51 million). It assumes approximately C$30.4 million (US$ 22 million) for post-closure monitoring and maintenance over the following 100 years. Based on the standard
regulatory discount rates applicable in British Columbia, the NPV of the post-closure monitoring and maintenance costs is approximately C$8.1 million (US$ 5.9 million), while the conventional
closure works cost is not subject to discount. This gives a total NPV of approximately C$48.2 million (US$ 34.9 million). Since BC regulations will not allow discount of the total reclamation
liability cost estimate below C$50 million (US$ 36.2 million); the current bonding for the site is fixed at C$50 million (US$ 36.2 million). All amounts were converted from Canadian dollars to
United States dollars at a rate of US$1 to C$1.38.
|
New Afton Operations
British Columbia
Technical Report Summary
|
| 17.4 |
Permitting
|
The New Afton Operations commenced in 2012 and have obtained all necessary environmental permits and licenses from the appropriate provincial,
and federal agencies for the operation of the underground mine, TSF, waste rock dumps, process plant, water usage, effluent discharge, and all necessary support facilities. The key approvals and
permits include:
| • |
Permit M-229. While this permit is in place, an authorization to amend the permit has been submitted for longitudinal stope mining of the East Extension and
K-Zone access development;
|
| • |
Permit 100223 (air emissions);
|
| • |
Permit 100224 (effluent discharge);
|
| • |
Permit 123886 (conditional water license);
|
| • |
Permit 126715 (water license amendment);
|
| • |
Permit C132319 (conditional water license);
|
| • |
Permit C504133 (conditional water license).
|
Operational standards and best management practices were established to maintain compliance with applicable state and federal regulatory
standards and permits.
Coeur submitted a Mines Act Permit Amendment (on January 12, 2026, seeking amendment to their M-229 Mines
Act Permit to cover the following:
| • |
East Extension Project: encompasses a minor underground extension at the New Afton Mine Site (New Afton) to include an additional ore zone;
|
| • |
Early K Zone Access Development Project would allow early ramp development mining in anticipation of the K Zone orebody. Coeur is working toward compiling
mineral reserve information;
|
| • |
New Afton M-229 Permit Boundary Reversion in the northeast quadrant to revert to a prior 2019 outline that would align with the New Afton Mining Lease
boundary.
|
Proposed changes to the existing LOM plan include extension of underground workings to the East Extension zone, extraction and processing of East
Extension ore, and deposition of tailings into the Afton Pit TSF. The East Extension project will use the existing mine and mill infrastructure with tie-ins to the existing electrical lines,
communications system, ventilation system, and underground dewatering system. No new offsite facilities are required, and the frequency of concentrate shipments will not increase because of the
project. Given the backfilling of stopes proposed in the preferred mining method, no subsidence is expected to occur because of the East Extension development.
Regulatory approvals for the East Extension project include a Notice of Departure (submitted February 2025) for the initial access development
activities and submittal of a Mines Act Permit Amendment to mine the East Extension zone, as well as the K Zone Access Development and New Afton M-229 Permit Boundary Reversion. The Ministry of
Environment and Parks will also receive copies of the submissions which will serve as notification of changes to mining activities; however, amendment to Coeur’s waste discharge permits is not
expected to be required.
|
New Afton Operations
British Columbia
Technical Report Summary
|
In the interest of workloads, timing and after discussions with both SSN and the Ministry of Mines and Critical Minerals, Coeur included the K
Zone Access Development Project and the New Afton M-229 Permit Boundary Reversion in a combined M-229 Permit Application with the East Extension project.
| 17.5 |
Social Considerations, Plans, Negotiations and Agreements
|
| 17.5.1 |
Social Considerations
|
The New Afton Operations are located in the traditional territory and central lands of the SSN. The SSN consists of two First Nations
communities, the Tk̓emlúps te Secwépemc and the Skeetchestn Indian Band.
The mine is located approximately 10 km from the City of Kamloops, which has a growing population of approximately 97,000. New Afton employs most
of its staff from the nearby communities.
As part of the Mines Permit Application in 2007 (Rescan, 2007), a socio-economic assessment was
conducted which included a description of existing socio-economic conditions and expected project impacts. The assessment included both Indigenous and non-Indigenous communities and found that,
overall, the New Afton Operations would provide a net benefit to communities through job creation, training, and economic opportunities. Mitigation measures were recommended for any potential
negative effects (such as perceptions of environmental effects, visual impacts of the mine site).
| 17.5.2 |
Indigenous Communities
|
Coeur’s Human Rights Policy and Indigenous Peoples Policy sets forth the commitment to respect the
rights and traditions of Indigenous people where it operates by proactively seeking, engaging, and supporting meaningful dialogue regarding its operations. The SSN has asserted unextinguished
title and rights on the land where the mine is located.
Coeur, through its New Gold subsidiary, has maintained a Participation Agreement with SSN, which was initially signed in 2008 and amended in
2011. This agreement was revised as the Cooperation Agreement in 2021 and was most recently amended and restated in 2024. The agreement affirms mutual commitment to the vision of a
consent-based, stable, and environmentally responsible relationship regarding the New Afton Operations and Coeur’s activities that is respectful of SSN title and rights. The agreement secures
and maintains SSN’s consent to the project during operations and closure and considers the following values:
| • |
Environmental and regulatory matters;
|
| • |
Cultural heritage and archaeology;
|
| • |
Human resources, employment, training, and education;
|
|
New Afton Operations
British Columbia
Technical Report Summary
|
| • |
Business opportunities;
|
| • |
Financial considerations.
|
| 17.5.3 |
Cultural Heritage
|
Archaeological impact assessments were conducted in 2007, 2008, 2011, and 2014. Since then, additional cultural heritage and archaeological
surveys were conducted on an individual project basis.
Coeur acknowledges that archaeological assessment cannot completely eliminate the risk of encountering archaeological resources. As such, Coeur
and SSN developed an Archaeological and Cultural Heritage Site Mitigation Management Plan. The plan summarizes surveys, lists archaeology and cultural heritage sites, and provides mitigation and
management recommendations aimed at reducing the impact on archaeology and cultural heritage sites. Guidelines were developed to guide cultural heritage and archaeological projects and to set
out timelines and deliverables.
Coeur employs a Dig Permit process to assess for known archaeological or cultural heritage sites for all surface ground disturbance work.
| 17.6 |
Qualified Person’s Opinion on Adequacy of Current Plans to Address Issues
|
Based on the information provided to the QP by Coeur, there are no material issues known
to the QP that require mitigation activities or allocation of remediation costs in respect of environmental, permitting, closure or social license considerations.
|
New Afton Operations
British Columbia
Technical Report Summary
|
| 18.0 |
CAPITAL AND OPERATING COSTS
|
| 18.1 |
Introduction
|
Capital and operating cost estimates are at a minimum at a pre-feasibility level of confidence, having an accuracy
level of ±25% and a contingency range not exceeding 15%.
|
18.2
|
Capital Cost Estimates
|
Capital costs are based on budget estimates and supplier and contractor quotes, engineering designs, maintenance strategies, production plans,
and recent operating history. In later years, capital estimates are based on estimated annual operating requirements and are therefore classified as sustaining capital.
| 18.2.1 |
Mine-Related Costs
|
Approximately 82% of C-Zone capital and 89% of East Extension capital are related to mine development and drawbell construction and maintenance,
for which the cost estimate is based on mine plans and schedules, equipment data, consumables estimates, and labor schedules. A further 17% of total capital is related to mining equipment, and
mine infrastructure, for which the cost estimate is based on engineered quantities and supplier quotes.
| 18.2.2 |
Other Costs
|
Other capital expenditures include tailings management, processing plant capital projects, and other infrastructure. Total LOM tailings
management capital is estimated at US$3.1 million, mostly related to the New Afton TSF. The tailings plant and Afton Pit TSF have sufficient capacity to meet the LOM throughput and total
capacity requirements.
| 18.2.3 |
Capital Cost Summary
|
Capital costs are based on budget estimates from supplier and contractor quotes, engineering designs, maintenance strategies, production plans,
and recent operating history. All costs are in US dollars and are based on an exchange rate assumption of C$1.38:US$1.00 for the entire LOM plan.
The capital cost estimate is summarized in Table 18‑1, and totals US$212.6 million.
|
New Afton Operations
British Columbia
Technical Report Summary
|
|
Table 18‑1:
|
LOM Capital Cost Estimate (US$ M)
|
|
Category
|
2026
|
2027
|
2028
|
2029
|
2030
|
2031
|
2032
|
Total
|
||||||||||
|
Sustaining Capital
|
||||||||||||||||||
|
C-Zone
|
14.3
|
18.9
|
4.3
|
4.3
|
4.3
|
4.3
|
—
|
50.6
|
||||||||||
|
East Extension
|
—
|
—
|
1.1
|
2.0
|
—
|
—
|
—
|
3.1
|
||||||||||
|
Other
|
17.6
|
6.1
|
2.9
|
2.7
|
1.1
|
—
|
—
|
30.5
|
||||||||||
|
Total sustaining capital
|
32.0
|
25.0
|
8.4
|
9.0
|
5.4
|
4.3
|
—
|
84.2
|
||||||||||
|
Growth Capital
|
||||||||||||||||||
|
C-Zone
|
27.3
|
0.5
|
—
|
—
|
—
|
—
|
—
|
27.8
|
||||||||||
|
East Extension
|
0.4
|
1.2
|
34.0
|
—
|
—
|
—
|
—
|
35.5
|
||||||||||
|
K-Zone
|
17.6
|
21.7
|
21.2
|
—
|
—
|
—
|
—
|
60.5
|
||||||||||
|
Other
|
(0.6)
|
2.3
|
0.7
|
2.2
|
—
|
—
|
—
|
4.6
|
||||||||||
|
Total growth capital
|
44.6
|
25.8
|
55.9
|
2.2
|
—
|
—
|
—
|
128.4
|
||||||||||
|
Total Capital
|
76.6
|
50.8
|
64.2
|
11.2
|
5.4
|
4.3
|
—
|
212.6
|
Note: Numbers have been rounded.
| 18.3 |
Operating Cost Estimates
|
| 18.3.1 |
Basis of Estimate
|
The basis for the operating cost estimate is the budget and LOM plan. The production plan drove the calculation of the mining and processing costs, as the mining
mobile equipment fleet, workforce, contractors, power, and consumables requirements were calculated based on specific consumption rates. Consumable prices and labor rates are based on current contracts and
agreements.
| 18.3.2 |
Mining and Processing Costs
|
Underground mining costs are derived from the production plan and estimates of labor, equipment productivity, maintenance, diesel, and other consumables.
Processing costs are driven by tonnes processed, consumption rates, consumables and electricity, and plant equipment maintenance strategies.
Mining costs are inclusive of primary crushing and conveyance to surface. Mining and processing costs are expected to decrease over the next three years relative
to 2026 actual costs, mainly due to higher production rates and stable overall expenses. Costs increase in 2029 due to stope production at East Extension, which has higher costs than cave production in the
C-Zone.
 |
New Afton Operations
British Columbia
Technical Report Summary
|
| 18.3.3 |
General and Administrative Costs
|
G&A costs include maintenance of site infrastructure, human resources, finance, environment, community relations, asset protection and security, safety,
information technology, supply chain, and site management.
| 18.3.4 |
Other Operating Costs
|
Other operating cost includes concentrate transport costs, inventory movements, royalties, and other costs.
| 18.3.5 |
Operating Cost Summary
|
LOM operating costs are shown in Table 18‑2 and total US$1,085.6 M. Unit operating costs from 2026–2032 range from US$24.08–US$33.60/t.
|
|
New Afton Operations
British Columbia
Technical Report Summary
|
|
Table 18‑2:
|
LOM Operating Cost Estimate
|
|
Units
|
2026
|
2027
|
2028
|
2029
|
2030
|
2031
|
2032
|
Total/
Average |
||||||||||||
|
Operating Costs
|
||||||||||||||||||||
|
Mining
|
US$ M
|
65.7
|
65.2
|
58.7
|
83.7
|
75.7
|
69.8
|
11.6
|
430.3
|
|||||||||||
|
Processing
|
US$ M
|
45.3
|
41.6
|
41.2
|
40.5
|
39.8
|
36.1
|
5.0
|
249.4
|
|||||||||||
|
G&A
|
US$ M
|
66.1
|
62.1
|
59.9
|
46.4
|
42.6
|
38.2
|
4.2
|
319.5
|
|||||||||||
|
Other
|
US$ M
|
12.4
|
13.5
|
12.8
|
18.7
|
14.5
|
13.3
|
1.2
|
86.4
|
|||||||||||
|
Total
|
US$ M
|
189.5
|
182.4
|
172.6
|
189.2
|
172.5
|
157.3
|
22.0
|
1,085.6
|
|||||||||||
|
Unit Operating Costs
|
||||||||||||||||||||
|
Mining
|
$/t mined
|
11.51
|
10.67
|
9.94
|
14.23
|
12.87
|
11.87
|
14.25
|
12.19
|
|||||||||||
|
Processing
|
$/t milled
|
8.03
|
6.94
|
6.91
|
6.81
|
6.77
|
6.17
|
5.46
|
6.73
|
|||||||||||
|
G&A
|
$/t milled
|
11.72
|
10.37
|
10.04
|
7.81
|
7.25
|
6.53
|
4.60
|
8.33
|
|||||||||||
|
Other
|
$/t milled
|
2.21
|
2.26
|
2.14
|
3.14
|
2.46
|
2.27
|
1.28
|
2.25
|
|||||||||||
|
Total
|
$/t milled
|
33.60
|
30.44
|
28.93
|
31.84
|
29.35
|
26.92
|
24.08
|
29.31
|
|
|
New Afton Operations
British Columbia
Technical Report Summary
|
| 19.0 |
ECONOMIC ANALYSIS
|
| 19.1 |
Forward-looking Information
|
Results of the economic analysis represent forward- looking information that is subject to several known and unknown
risks, uncertainties and other factors that may cause actual results to differ materially from those presented here.
Other forward-looking statements in this Report include, but are not limited to: statements with respect to future metal prices and concentrate sales contracts;
the estimation of mineral reserves and mineral resources; the realization of mineral reserve estimates; the timing and amount of estimated future production; costs of production; capital expenditures; costs and
timing of the development of new ore zones; permitting time lines; requirements for additional capital; government regulation of mining operations; environmental risks; unanticipated reclamation expenses; title
disputes or claims; and, limitations on insurance coverage.
Factors that may cause actual results to differ from forward-looking statements include: actual results of current reclamation activities; results of economic
evaluations; changes in Project parameters as mine and process plans continue to be refined, possible variations in mineral reserves, grade or recovery rates; geotechnical considerations during mining; failure
of plant, equipment or processes to operate as anticipated; shipping delays and regulations; accidents, labor disputes and other risks of the mining industry; and, delays in obtaining governmental approvals.
| 19.2 |
Methodology Used
|
Coeur records its financial costs on an accrual basis and adheres to U.S. Generally Accepted Accounting Principles (GAAP).
The financial costs used for this analysis are based on the 2026 LOM budget model, which was built on a zero-based budgeting process that was validated through a
historical cost comparison from the previous financial year. Production figures in this Chapter are based on predicted equipment hours and manpower requirements needed to execute the mine plan using actual unit
costs, labor rates and may vary from year to year depending on capital and production needs.
Consumables are based upon market projections and contract pricing. Experts and bids are used for capital purchases to ensure that all costs are included in the
project to avoid unbudgeted expenditures.
All financial results are communicated to the site management team. This process results in refinements and agreements as to the validity of the cost, capital,
and cash flow results. This is an ongoing process throughout the budget and provides consistency of the results and acceptance of both short- and long-term goals.
Capitalized exploration is determined annually through the corporate office, is discretionary, and therefore not included in the economic
analysis. Management fees assessed through the corporate office are not included in the economic analysis.
|
|
New Afton Operations
British Columbia
Technical Report Summary
|
| 19.3 |
Financial Model Parameters
|
| 19.3.1 |
Mineral Resource, Mineral Reserve, and Mine Life
|
The mineral resources are discussed in Chapter 11, and the mineral reserves are discussed in Chapter 12.
The mineral reserves support a mine life to late 2032 and processing and gold production continuing to
December, 2032.
| 19.3.2 |
Metallurgical Recoveries
|
Forecast metallurgical recoveries are provided in Chapter 10.
| 19.3.3 |
Smelting and Refining Terms
|
The dewatered concentrate is discharged from the filter presses directly into the concentrate storage shed, before truck transportation to either the DP World
container port for ocean shipment to a smelter, or to the Ashcroft terminal for transportation by rail to a smelter in Quebec. In the case of DP World, concentrate is loaded into containers (two per truck) at
the New Afton shed. These containers are stored at the port then emptied into the bulk hold of the ship. Empty containers are returned to site for reloading. In the case of Ashcroft, the concentrate is loaded
into side-dump trucks at the New Afton shed then stored in stockpiles at the Ashcroft terminal before loading into railcars.
New Afton concentrate is readily marketable to any of several smelters or concentrate marketing firms. Smelting and refining terms include treatment charges and
refining charges which are generally known, with penalty charges for contaminants such as arsenic and mercury in the concentrates. Penalty terms are generally more variable than the treatment and refining
terms. Concentrates from New Afton are typically sold through concentrate marketing firms, with long-term contracts that cover several years.
| 19.3.4 |
Metal Prices
|
Metal price assumptions are provided in Chapter 16.
| 19.3.5 |
Capital and Operating Costs
|
Capital and operating cost forecasts price assumptions are outlined in Chapter 18.
Capitalized exploration is determined annually through corporate office and is discretionary and therefore not included in the economic
analysis. Management fees assessed through the corporate office are not included in the economic analysis.
|
|
New Afton Operations
British Columbia
Technical Report Summary
|
| 19.3.6 |
Working Capital
|
Working capital is based on historical trends in payables, receivables, and inventory movements and is adjusted annually to reflect changes in production levels
and spending profiles over the remaining mine life. Mining and processing unit costs have historically been stable on a per-tonne basis once block cave construction is completed, and consistent throughput is
achieved. Working capital costs are projected to remain relatively consistent starting in 2027, with longer-term variations driven by production level demands for equipment requirements and capital intensity.
Capital and operating cost assumptions are derived from budgets, engineering designs, production plans, historical caves, and recent operating history, and are used to support projected cash flow timing and
resulting working capital requirements.
| 19.3.7 |
Taxes and Royalties
|
Royalties are discussed in Chapter 3.6. Royalties included in the cashflow analysis are based upon gold ounces mined or produced, depending upon the agreement.
The analysis includes applicable mining-related and corporate income taxes based on current laws and regulations, which are subject to change
Currently, Coeur pays no federal income tax due to historic net operating losses.
| 19.3.8 |
Closure Costs and Salvage Value
|
Closure costs are summarized in Chapter 17.3.
Closure costs are based upon economic review by the Environmental team and is periodically reviewed by an external consultant. The models used are reviewed
internally. The closure costs are included in the annual budget LOM. This is reviewed by corporate investment teams.
| 19.3.9 |
Financing
|
The economic analysis is based on 100% equity financing and is reported on a 100% project ownership basis.
| 19.3.10 |
Inflation
|
The economic analysis assumes constant prices with no inflationary adjustments.
| 19.4 |
Economic Analysis
|
The NPV at 5% is $2,485 M. As the cashflow is based on existing operations, considerations of payback and internal rate of return are not relevant.
|
|
New Afton Operations
British Columbia
Technical Report Summary
|
A summary of the financial results is provided in Table 19‑1. An annualized cashflow statement is provided in Table 19‑2.
The active mining operation ceases in 2032; however, closure costs are estimated to be paid out through 2032. For the purposes of the financial model, all costs
incurred beyond 2032 are included in the cash flow in the year 2032.
| 19.5 |
Sensitivity Analysis
|
The sensitivity of the Project to changes in metal prices, grade, capital costs, and operating cost assumptions was tested using a range of 30% above and below
the base case values. The NPV sensitivity to these parameters is illustrated in Table 19‑3, with the base case bolded. Recovery is not shown as the sensitivity to recovery mirrors the sensitivity to metal
price.
The Project is most sensitive to copper and gold prices and metal grades, less sensitive to operating cost increases, and least sensitive to capital expenditure
changes and exchange rates.
The primary sensitivity is to the world economy and the effect this has upon copper and gold pricing. With block caving being a low operating costs per tonne
mining method, the project carries less world economy risk when compared to alternative underground mining methods.
|
|
New Afton Operations
British Columbia
Technical Report Summary
|
|
Table19‑1:
|
Cashflow Summary Table
|
|
Item
|
Units
|
Value
|
|||
|
Revenue
|
US$ M
|
4,837.4
|
|||
|
Production costs
|
US$ M
|
1,108.9
|
|||
|
Exploration
|
US$ M
|
23.3
|
|||
|
Accretion liability
|
US$ M
|
18.9
|
|||
|
Total cost and expenses
|
US$ M
|
1,151.2
|
|||
|
Interest income
|
US$ M
|
3.4
|
|||
|
Intercompany
|
US$ M
|
27.7
|
|||
|
EBITDA
|
US$ M
|
3,655.1
|
|||
|
Depreciation, depletion, and amortization
|
US$ M
|
4,580.4
|
|||
|
Income before taxes
|
US$ M
|
(925.3)
|
|||
|
Income tax expense (benefit)
|
US$ M
|
731.1
|
|||
|
Net income
|
US$ M
|
(1,656.4)
|
|||
|
Add back amortization
|
US$ M
|
4,580.4
|
|||
|
Add back accretion
|
US$ M
|
(47.3)
|
|||
|
Add back other non-cash items
|
US$ M
|
54.4
|
|||
|
Operating cash flow before working capital changes
|
US$ M
|
2,931.2
|
|||
|
Working capital
|
US$ M
|
28.6
|
|||
|
Operating cash flow
|
US$ M
|
2,959.6
|
|||
|
Investing activities
|
US$ M
|
(222.4)
|
|||
|
Interest received
|
US$ M
|
0.4
|
|||
|
Other
|
US$ M
|
(2.8)
|
|||
|
Payments on capital leases
|
US$ M
|
(0.2)
|
|||
|
Total cash flow
|
US$ M
|
2,734.7
|
|||
|
Free cash flow
|
US$ M
|
2,737.2
|
|||
|
NPV Pre-Tax/After-Tax @ 5%
|
US$ M
|
3132/2,484.6
|
Note: EBITDA = earnings before interest, taxes, depreciation, and amortization. Numbers have been rounded.
|
|
New Afton Operations
British Columbia
Technical Report Summary
|
|
Table19‑2:
|
Cashflow Forecast on Annualized Basis (US$ M)
|
|
Item
|
2026
|
2027
|
2028
|
2029
|
2030
|
2031
|
2032
|
2033+
|
|||||||||
|
Revenue
|
882.7
|
1,017.3
|
984.7
|
872.3
|
584.6
|
430.8
|
64.9
|
—
|
|||||||||
|
Production costs
|
206.7
|
181.9
|
170.2
|
190.5
|
173.2
|
157.7
|
28.8
|
—
|
|||||||||
|
Exploration
|
22.6
|
0.7
|
(0.0)
|
(0.0)
|
(0.0)
|
(0.0)
|
—
|
—
|
|||||||||
|
Accretion liability
|
2.2
|
2.4
|
2.5
|
2.7
|
2.9
|
3.0
|
3.2
|
—
|
|||||||||
|
Total costs and expenses
|
231.5
|
185.0
|
172.7
|
193.2
|
176.1
|
160.8
|
32.0
|
—
|
|||||||||
|
Interest Income
|
0.6
|
0.6
|
0.6
|
0.6
|
0.5
|
0.5
|
0.1
|
—
|
|||||||||
|
Intercompany
|
6.2
|
281
|
—
|
0.1
|
(0.0)
|
—
|
21.1
|
—
|
|||||||||
|
Earnings before depreciation, interest, and taxes (EBITDA)
|
644.5
|
831.5
|
811.5
|
678.4
|
408.0
|
269.5
|
11.7
|
—
|
|||||||||
|
Depreciation, depletion, and amortization
|
680.6
|
927.9
|
926.7
|
816.2
|
608.4
|
424.8
|
174.6
|
21.1
|
|||||||||
|
Income before taxes
|
(36.1)
|
(96.5)
|
(115.2)
|
(137.8)
|
(200.4)
|
(155.3)
|
(162.9)
|
(21.1)
|
|||||||||
|
Income tax expense (benefit)
|
47.4
|
204.6
|
182.0
|
151.0
|
85.1
|
53.2
|
7.7
|
—
|
|||||||||
|
Net Income
|
(83.5)
|
(301.1)
|
(297.3)
|
(288.8)
|
(285.5)
|
(208.5)
|
(170.6)
|
(21.1)
|
|||||||||
|
Add back amortization
|
680.6
|
927.9
|
926.7
|
816.2
|
608.4
|
424.8
|
174.6
|
21.1
|
|||||||||
|
Add back accretion
|
(0.5)
|
(0.3)
|
(0.8)
|
(0.3)
|
(0.3)
|
(0.3)
|
(0.3)
|
(44.3)
|
|||||||||
|
Add back other non-cash items
|
12.6
|
(1.2)
|
(0.8)
|
0.1
|
0.1
|
0.1
|
43.4
|
||||||||||
|
Operating cash flow before working capital changes
|
609.1
|
625.4
|
627.8
|
527.2
|
322.7
|
216.2
|
3.7
|
(1.0)
|
|||||||||
|
Working capital
|
11.2
|
19.3
|
4.2
|
2.8
|
0.6
|
11.0
|
(19.0)
|
(1.8)
|
|||||||||
|
Operating cash flow
|
620.4
|
644.8
|
632.0
|
530.0
|
323.3
|
227.3
|
(15.4)
|
(2.7)
|
|||||||||
|
Investing activities
|
(76.6)
|
(50.8)
|
(64.2)
|
(11.2)
|
(10.9)
|
(8.7)
|
—
|
—
|
|||||||||
|
Interest received
|
0.1
|
0.1
|
0.1
|
0.1
|
(0.0)
|
(0.0)
|
(0.0)
|
—
|
|||||||||
|
Other
|
(2.8)
|
—
|
—
|
—
|
—
|
—
|
—
|
—
|
|||||||||
|
Payments on capital leases
|
(0.1)
|
(0.1)
|
—
|
—
|
—
|
—
|
—
|
—
|
|||||||||
|
Total cash flow
|
541.0
|
594.0
|
567.8
|
518.8
|
312.5
|
218.6
|
(15.4)
|
(2.7)
|
|||||||||
|
Free cash flow
|
543.8
|
594.0
|
567.7
|
518.7
|
312.4
|
218.6
|
(15.4)
|
—
|
Note: Numbers have been rounded.
|
|
New Afton Operations
British Columbia
Technical Report Summary
|
|
Table19‑3:
|
Sensitivity Table (US$ M)
|
|
Parameters
|
-30%
|
-20%
|
-10%
|
-5%
|
0%
|
5%
|
10%
|
20%
|
30%
|
||||||||||
|
Metal price
|
1,176
|
1,612
|
2,048
|
2,267
|
2,485
|
2,703
|
2,921
|
3,357
|
3,793
|
||||||||||
|
Operating costs
|
2,781
|
2,682
|
2,583
|
2,534
|
2,485
|
2,435
|
2,386
|
2,287
|
2,189
|
||||||||||
|
Capital costs
|
2,547
|
2,526
|
2,505
|
2,495
|
2,485
|
2,474
|
2,464
|
2,443
|
2,422
|
||||||||||
|
Grade
|
1,176
|
1,612
|
2,048
|
2,267
|
2,485
|
2,703
|
2,921
|
3,357
|
3,793
|
Note: Numbers have been rounded.
|
|
New Afton Operations
British Columbia
Technical Report Summary
|
| 20.0 |
ADJACENT PROPERTIES
|
This Chapter is not relevant to this Report.
|
|
New Afton Operations
British Columbia
Technical Report Summary
|
| 21.0 |
OTHER RELEVANT DATA AND INFORMATION
|
This Chapter is not relevant to this Report.
|
|
New Afton Operations
British Columbia
Technical Report Summary
|
| 22.0 |
INTERPRETATION AND CONCLUSIONS
|
| 22.1 |
Introduction
|
The Qualified Persons note the following interpretations and conclusions in their respective areas of expertise, based on the review
of data available for this technical report summary.
| 22.2 |
Mineral Tenure, Surface Rights, Water Rights, Royalties and Agreements
|
Information provided by Coeur’s legal and tenure experts on the mining tenure held by Coeur supports that Coeur has valid title that is sufficient to support
mineral resource and mineral reserve estimates.
Coeur holds sufficient surface rights to support the LOM plan.
Environmental liabilities for the New Afton Operations are typical of those that would be expected to be associated with a mining operation conducted via open
pit and underground mass mining methods.
The Qualified Person is not aware of any other significant factors and risks that may affect access, title, or the right or ability to perform the proposed work
program on the property that are not discussed in this report.
| 22.3 |
Geology and Mineralization
|
The understanding of geological controls, geometry, and grade variability of the copper–gold porphyry mineralization is
sufficient to support estimation of mineral resources and mineral reserves. This understanding is strengthened by a history of production and exploration that spans more than a decade. The alteration
assemblages and mineral zonation associated with the porphyry-style mineralization are well understood and support both the interpretation of mineral resource domains for estimation purposes and exploration
concepts for targeting.
The K-Zone is a new area of copper-gold porphyry mineralization recently discovered through underground drilling. The understanding of the geometry and grade
distribution could be improved by additional drilling. Additional underground development is proposed to provide better drilling platforms to improve definition and further test the extents of the K-Zone
mineralization.
The exploration programs completed to date are suitable to the mineralization style. In addition to exploration potential around the Main Zone, exploration
potential remains in the HW zone and K-Zone. The New Afton mineralized system is open at depth and to the east, with potential for the discovery of new mining zones.
|
|
New Afton Operations
British Columbia
Technical Report Summary
|
| 22.4 |
Exploration, Drilling, and Sampling
|
Drilling procedures, including data collected during the exploration and delineation drilling programs, follow best practice. Collar
and down-hole surveys, lithological, alteration, mineralization, structural geology, and geotechnical data was collected and catalogued following best practice guidelines to support estimation of mineral
resources and mineral reserves. The drill spacing and frequency of sampling is adequate and reflects the mineralized zones’ dimensions and styles of mineralization. Litho-structural 3D modelling constructed
independently of grade further supports the interpretation of mineral resource domains.
Sample preparation, analysis, and security are performed in accordance with industry best practice. QA/QC programs were implemented to adequately address issues
of precision, accuracy, and contamination by including blanks, duplicates, and certified standard samples.
| 22.5 |
Data Verification
|
The data verification programs from the QP concluded that the data collected from the Project adequately support the geological interpretations and constitute a
database of sufficient quality to support the use of the data in mineral resource estimation.
| 22.6 |
Metallurgical Testwork
|
The testwork undertaken is of a level adequate for ensuring an appropriate representation of metallurgical characterization and the derivation of corresponding
metallurgical recovery factors for the B3 cave, C-Zone, and East Extension.
Metallurgical assumptions are supported by multiple years of production data.
Recovery improvements resulting from the cleaner circuit upgrade are expected to partly offset the impact of a coarser grind size, as the processing rate returns
to approximately 16,000 t/d.
Grade-recovery models for the various ore types were developed using processing throughput rates to inform the forecasting copper and gold recoveries for the LOM
plan.
There are no known processing factors that could have a significant effect on economic extraction.
The New Afton concentrate has historically been very clean and marketable. There are no known deleterious elements that could have a significant effect on
economic extraction.
| 22.7 |
Mineral Resource Estimates
|
The mineral resource estimate is reported using the definitions set out in SK-1300, and is reported exclusive of those mineral resources converted to mineral
reserves.
The reference point for the estimate is in situ.
|
|
New Afton Operations
British Columbia
Technical Report Summary
|
The estimate is current as at December 31, 2025. The estimate was constrained using reasonable prospects of economic extraction that assumed underground bulk
mining or long-hole stoping mining methods.
There are no other environmental, permitting, legal, title, taxation, socioeconomic, marketing, political or other relevant factors known to the Qualified
Persons that would materially affect the estimation of Mineral Resources that are not discussed in this Report.
| 22.8 |
Mineral Reserve Estimates
|
The mineral reserve estimate is reported using the definitions set out in SK-1300. The reference point for the estimate is the point of delivery to the process
plant.
The estimate is current as at December 31, 2025.
The Qualified Person is of the opinion that mineral reserves were estimated using industry-accepted practices and are based on underground mining assumptions.
The mineral reserves are acceptable to support mine planning.
Factors that may affect the mineral reserve estimates include: changes to the long-term copper and gold price and exchange rate assumptions; changes to the
parameters used to derive the cave outlines and stope shapes and determine the cut-off values; changes to geotechnical and hydrogeological assumptions; changes to the cave mixing model and dilution estimates;
changes to metallurgical recovery assumptions; changes to inputs to capital and operating cost estimates; ability to maintain social and environmental license to operate.
There are no other environmental, legal, title, taxation, socioeconomic, marketing, political or other relevant factors known to the qualified person that would
materially affect the estimation of Mineral Reserves that are not discussed in this report.
| 22.9 |
Mining Methods
|
Current operations use the block caving mining method. Coeur/New Gold has successfully constructed and operated multiple block caves at New Afton for more than
13 years.
C-Zone achieved commercial production in 2024, and New Afton is scheduled to complete the transition from B3 block cave to C-Zone block cave production in 2026.
Mine planning of the new East Extension zone considers long-hole stoping methods.
Construction of the C-Zone materials handling system, including a new gyratory crusher and extension of the conveyor system, was completed in 2024. The East
Extension will use the same materials handling system.
Mine designs incorporate underground infrastructure and ventilation requirements.
The planned mobile equipment fleets are suitable for the selected mining methods.
Based on current mineral reserves, New Afton has a projected mine life of seven years, to 2032.
|
|
New Afton Operations
British Columbia
Technical Report Summary
|
| 22.10 |
Recovery Methods
|
The process plant uses conventional processes and equipment to enable economic recovery over a wide range of mill throughputs, particle sizes, and copper–gold
mineralogy The plant has been in operation since 2012.
Coeur/New Gold has previously achieved the planned processing rates of approximately 16,000 t/d during mining of the Lift 1 block caves.
The operation has access to an adequate supply of process water and power to support the LOM plan.
| 22.11 |
Infrastructure
|
The thickened and amended tailings plant is operational, and tailings have been successfully deposited into the Afton Pit TSF since late-2022. The Afton Pit TSF
has sufficient storage capacity to support the LOM plan.
The tailings stabilization project is on schedule. The historical Afton TSF stabilization is complete, and New Afton TSF stabilization will be finalized well
ahead of the expected subsidence impacts.
The planned East Extension operations are not expected to require additional surface facilities.
| 22.12 |
Market Studies
|
The New Afton Operations produce a high-quality clean copper concentrate with typical copper grade, high gold grades, payable silver credits, and relatively low
impurity levels.
The concentrate produced by the New Afton Operations is readily marketable.
Contract terms are considered to be within industry norms, and typical of similar contracts in Canada.
Commodity pricing assumptions, marketing assumptions, and current major contract areas are acceptable for use in estimating mineral reserves and in the economic
analysis that supports the mineral reserves.
| 22.13 |
Environmental, Permitting and Social Considerations
|
The information provided by Coeur’s environmental experts supports that there is adequate baseline data and ongoing
environmental studies to understand potential environmental risks and potential mitigations which may be required.
Coeur holds all major permits and licenses for mine operations at New Afton, and a Mines Act permit amendment for
mining East Extension will be sought.
|
|
New Afton Operations
British Columbia
Technical Report Summary
|
The most recent reclamation liability cost estimate for the New Afton Operations, as submitted to the MCM on November 1, 2024, is approximately C$70.4 million
(US$ 51 million). It assumes approximately C$30.4 million (US$ 22 million) for post-closure monitoring and maintenance over the following 100 years. Based on the standard regulatory discount rates applicable in
British Columbia, the NPV of the post-closure monitoring and maintenance costs is approximately C$8.1 million (US$ 5.9 million), while the conventional closure works cost is not subject to discount. This gives
a total NPV of approximately C$48.2 million (US$ 34.9 million). Since BC regulations will not allow discount of the total reclamation liability cost estimate below C$50 million (US$ 36.2 million); the current
bonding for the site is fixed at C$50 million (US$ 36.2 million). All amounts were converted from Canadian dollars to United States dollars at a rate of US$1 to C$1.38.
Environmental liabilities for the New Afton Operations are typical of those that would be expected to be associated with a mining operation conducted via
underground mining methods.
Coeur maintains strong relationships with Indigenous partners and collaborates on environmental and business matters.
A Cooperation Agreement is in place with the SSN.
The Qualified Person is not aware of any other significant environmental or social factors and risks that may affect access, or the right or ability to perform
the proposed work program that are not discussed in this Report.
| 22.14 |
Capital Cost Estimates
|
Capital costs consist mostly of the remaining development, cave construction, and underground infrastructure needed to complete the
C-Zone project, as well as processing improvements, tailings, and underground development and mining equipment to support East Extension.
Capital cost estimates are acceptable to support the mineral reserve estimate. The LOM plan estimated total capital cost is US$212.6 million.
| 22.15 |
Operating Cost Estimates
|
The basis for the operating cost estimate is the New Afton budget and LOM plan. The production plan drove the calculation of the
mining and processing costs, as the mining mobile equipment fleet, workforce, contractors, power, and consumables requirements were calculated based on specific consumption rates. Consumable prices and labor
rates are based on current contracts and agreements.
Operating cost estimates are acceptable to support the Mineral Reserve estimate. The LOM plan estimated total operating cost is US$1,085.6 million, averaging
US$29.31 per tonne processed.
| 22.16 |
Economic Analysis
|
The NPV at 5% is US $2,485 M. As the cash flow is based on existing operations, considerations of payback and internal rate of return are not relevant.
|
|
New Afton Operations
British Columbia
Technical Report Summary
|
The Project is most sensitive to copper and gold prices and metal grades, less sensitive to operating cost increases, and least sensitive to capital expenditure
changes and exchange rates.
| 22.17 |
Risks and Opportunities
|
| 22.17.1 |
Risks
|
Uncertainties that may affect the mineral resource and mineral reserve estimates were discussed in Chapter 11.13 and Chapter 12.7, respectively.
The major risks to the New Afton Operations are associated with the following elements:
| • |
Negative variations to the copper and gold price assumptions;
|
| • |
Significant additional dilution or ore losses due to cave deviation or variations to the mine plan;
|
| • |
Oversized material or hung drawpoints during the early stages of C-Zone cave propagation, potentially limiting daily tonnage until additional drawpoints are blasted or
drawpoints become free-flowing;
|
| • |
Significant delays to the completion of the tailings stabilization project, potentially impacting C-Zone production;
|
| • |
Changes in geotechnical conditions and modelling parameters, including but not limited to the following:
|
| o |
The extent and magnitude of subsidence affecting site infrastructure;
|
| o |
Convergence in underground production drifts exceeding expectations;
|
| o |
Cave growth deviation and induced stress from the C-Zone block cave impacting underground development and infrastructure.
|
| 22.17.2 |
Opportunities
|
The major opportunities are as follows:
| • |
Potential extension of mine life and improved production profile if mineral resources at the K-Zone, D-Zone, and HW Zone can be converted to mineral reserves with additional
studies;
|
| • |
Potential to expand mineralization and identify new zones with additional drilling;
|
| • |
Further improvements in metallurgical recoveries with process plant improvements;
|
| • |
Further reduction in cement consumption in the thickened and amended tailings plant with additional testing and analysis;
|
| • |
Overperformance of drawpoints in C-Zone pulling in residual grade from the B3 cave post closure;
|
|
|
New Afton Operations
British Columbia
Technical Report Summary
|
| • |
Conversion of some or all of the measured and indicated mineral resources currently reported exclusive of mineral reserves to mineral reserves, with appropriate supporting
studies;
|
| • |
Upgrade of some or all of the inferred mineral resources to higher-confidence categories with additional studies.
|
| 22.18 |
Conclusions
|
Under the assumptions in this Report, the operations evaluated show a positive cash flow over the remaining LOM. The mine plan is
achievable under the set of assumptions and parameters used.
|
|
New Afton Operations
British Columbia
Technical Report Summary
|
| 23.0 |
RECOMMENDATIONS
|
The QPs have no material recommendations to make.
|
|
New Afton Operations
British Columbia
Technical Report Summary
|
|
24.0
|
REFERENCES
|
ALS. 2014. Pilot Plant Test Work New Afton Project New Gold Inc. KM4388, 145 p. (October 2014).
ALS. 2015. Pilot Plant Testing of New Afton Supergene and Hypogene Ore New Gold, KM4491, 410 p. (October 2015).
ALS. 2022. Metallurgical Assessment of Mineralization from the Mine Underground East Extension (UEE) KM6634 and
KM6734, 349 p. (August 2022).
ALS. 2024. Metallurgical Testing of New Afton D-Zone Mineralization KM7342, 223 p. (November 2024).
AMC Consultants Pty Ltd. 2007. Afton Project Feasibility Study, Underground Mining Study.
Barton N, Lien R, and Lunde J. 1974. Engineering Classification of Rock masses for the design of Tunnel Support. Journal of Rock Mechanics, Vol 6, p. 189-236.
BC Data Catalogue. British Columbia internet-based library of geospatial data sets. Accessed on December 10, 2024.
https://catalogue.data.gov.bc.ca/
BC MapPlace.
https://www2.gov.bc.ca/gov/content/industry/mineral-exploration-mining/british-columbia-geological-survey/mapplace.
BC Ministry of Energy, Mines and Petroleum Resources (MEMPR). 2017. Health, Safety and Reclamation Code for Mines in
British Columbia. Mining and Minerals Division, Victoria, British Columbia.
BC MTO- Mineral Titles Online. British Columbia internet-based electronic mineral titles administration system.
Accessed in November 2024. https://www.mtonline.gov.bc.ca/mtov/home.
BC Road Builders and Heavy Construction Association. 2024. Equipment Rental Rate Guide – The Blue Book.
Beck Engineering. 2019. Draft – Simulation of Subsidence – A Simulation of Worst-Case Closure Subsidence for Lift 1,
21 p. (December 1, 2019).
Behre Dolbear & Company, Ltd. 2003a. Mineral Resource Estimate for the Afton Copper/Gold Project, Kamloops, B.C.,
161 p., filed on SEDAR.
Behre Dolbear & Company, Ltd. 2004. Mineral Resource Estimate for the Afton Copper/Gold Project, Kamloops, B.C.,
160 p., filed on SEDAR.
BGC Engineering Inc (BGC). 2018. New Afton Tailings Storage Facility Design 2018 Update. Report RP-0921055.0532
submitted to New Gold Inc. September 13, 2018.
BGC. 2019a. 2018. Dam Safety Inspection. Report RP-0921055.0592 submitted to New Gold Inc. March 29, 2019.
BGC. 2019b. New Afton Thickener Water Balance Model – September 2019. Project memorandum submitted to New Gold Inc.
September 19, 2019.
BGC. 2019c. New Afton and Pothook TSF Instrumentation Data – November 2018 to January 2019. Report RP-0921063.0621
submitted to New Gold Inc. July 2, 2019.
|
|
New Afton Operations
British Columbia
Technical Report Summary
|
BGC. 2019d. Historical Afton Tailings Storage Facility 2018 Dam Safety Review. Report RP- 0921057.0572 submitted to
New Gold Inc. March 29, 2019.
BGC. 2024. New Afton Project 2024 – New Afton TSF Closure Spillway and Channels – Preliminary Design. July 2024.
RP-0921122.1065.
Bieniawski, Z.T. 1989. Engineering rock mass classifications. New York: Wiley.
British Columbia Geological Survey. 2024. MapPlace. https://mapplace.gov.bc.ca
Canadian Dam Association (CDA) Dam Safety Guidelines 2007 (Revised 2013).
Canadian Institute of Mining, Metallurgy and Petroleum (CIM). 2014. CIM Definition Standards for Mineral Resources
& Mineral Reserves. Adopted by CIM Council on May 19, 2014.
Canadian Institute of Mining, Metallurgy and Petroleum (CIM). 2019. Mineral Resources & Mineral Reserves
Estimation Best Practice Guidelines. Adopted by CIM Council on November 29. 2019.
Carter, NC.1981. Porphyry Copper and Molybdenum Deposits West-Central British Columbia, British Columbia Ministry of
Energy, Mines, and Petroleum Resources, Bulletin 64, 150p.
Caterpillar. 2024. 49th Caterpillar
Performance Handbook.
Chamberlain CM, Jackson M, Jago CP, Pass HE, Simpson KA, Cooke DR, and Tosdal RM. 2007. Toward an integrated model
for alkalic porphyry copper deposits in British Columbia (NTS 093A, N; 104G). Geological Fieldwork 2006, British Columbia Geological Survey Paper 2007-01, 259-273.
Victoria, BC: British Columbia Ministry of Energy, Mines and Petroleum Resources.
Cooke DR, Wilson AJ, House MJ, Wolfe RC, Walshe JL, Lickfold V, and Crawford AJ. 2007. Alkalic porphyry Au-Cu and
associated mineral deposits of the Ordovician to Early Silurian Macquarie Arc, New South Wales. Australian Journal of Earth Sciences, 54(2-3), 445-463.
Eriez Manufacturing Co. 2015. Laboratory-Scale Testing for Recovering Copper & Gold Values from Coarse Ore MT
15-030 (Confidential), 7 p. (June 2015).
Gekko Systems. 2015. New Gold New Afton Native Copper Gravity Testwork. Report T1369, 24 p. (November 2015).
Gekko Systems. 2016. New Gold New Afton Magnetic Separation and Gravity Testwork. Report T1474, 27 p. (February
2016).
Hadjigeorgiou J, Leclair J, and Potvin Y. 1995. An update of the Stability Graph Method for open stope design. 97th
Annual General Meeting of C.I.M. Halifax, Nova Scotia.
Hatch Ltd. 2007. New Afton Project, NI 43-101 Independent Technical Report, prepared for New Gold Inc. (filed on
SEDAR on April 30, 2007).
Itasca Consulting Group Inc. 2014a. Analysis of Potential Mining Induced Fracture Opening at New Afton Mine, August
15, 2014.
Itasca Consulting Group Inc. 2014b. Analysis of Caving and Subsidence at New Afton Mine – C-Zone Calibration and
Forward Modelling, September 26, 2014.
Itasca Consulting Group Inc. 2014c. New Afton C-Zone Dilution Modelling, September 26, 2014.
Itasca Consulting Group Inc. 2014d. Analysis of Caving and Subsidence at New Afton Mine – C-Zone Calibration and
Forward Modelling, November 17, 2014.
|
|
New Afton Operations
British Columbia
Technical Report Summary
|
Knight Piésold Ltd. 2018. New Afton Tailings Storage Facility 2017 Dam Safety Review. Report VA101-577/8-1
submitted to New Gold Inc. March 29, 2018.
Knight Piésold Ltd. 2019. New Afton Mine Historical Afton Tailings Storage Facility – 2018 Dam Safety Inspection.
Report VA101-577/21-1 submitted to New Gold Inc. March 28, 2019.
Konst RB. 2006. New Afton Project 2005-2006 Drilling Program Sample Preparation and Analytical Quality Control
Report, internal report prepared for New Gold Inc., April 30, 2006.
Lang JR, Stanley CR, and Thompson JR. 1995. Porphyry copper-gold deposits related to alkalic igneous rocks in the
Triassic-Jurassic arc terranes of British Columbia. In F.W. Pierce and J.G. Bolm (Eds.), Porphyry copper deposits of the
American Cordillera (pp. 219-236). Arizona Geological Society Digest 20. Tucson, AZ. Arizona Geological Society.
Lipske J, and Wade D. 2014. Geological Model of the New Afton Copper and Gold Deposit, British Columbia, internal
report to New Gold Inc., 53 p.
Lipske J, Wade D, Hall RH, and Petersen MA. 2020. Geology and mineralization of the New Afton Cu-Au alkalic
porphyry deposit, Kamloops, British Columbia. Porphyry Deposits of the Northwestern Cordillera of North America: A 25 Year Update. Canadian Institute of Mining,
Metallurgy and Petroleum, Special Volume 57 (pp. 648-664).
Logan JM, Mihalynuk MG, Ullrich T, and Friedman RM. 2007. U-Pb ages of intrusive rocks and 40Ar/39Ar plateau ages
of copper-gold-silver mineralization associated with alkaline intrusive centres at Mount Polley and the Iron Mask batholith, southern and central British Columbia. Geological
Fieldwork 2006, British Columbia Geological Survey Paper 2007-01. 93-116. Victoria, BC: British Columbia Ministry of Energy, Mines and Petroleum Resources.
Lyman GJ. 2019. Sampling Properties of Jig and Bulk Concentrates. 3 p., Memorandum to J. Katchen and John Andrew,
(August 16, 2019)
MetSolve Laboratories Inc. 2015. New Gold Inc. New Afton Mine Heavy Liquid Separation MS1632, 22 p. (September,
2015).
Mortensen JK, Ghosh DK, and Ferri F. 1995. U-Pb geochronology of intrusive rocks associated with copper-gold
porphyry deposits in the Canadian Cordillera. In T.G. Schroeter (Ed.), Canadian Institute of Mining, Metallurgy and Petroleum
Special Volume 46 (pp. 142-158). Montreal, QC. Canadian Institute of Mining, Metallurgy and Petroleum.
Nevada Division of Environmental Protection. 2017. Standardized Reclamation Cost Estimator, version 2.0. In
collaboration with the US Department of Interior, Bureau of Land Management and the Nevada Mining Association.
New Gold. 2016. C-ZONE PROJECT 2016, Feasibility Study Report, British Columbia, Canada, Internal study, January
29, 2016
New Gold. 2021. C-zone Permit Amendment Application dated November, 2021.
New Gold. 2019. New Afton Tailings and Water Management Facilities Operation, Maintenance & Surveillance
Manual. Internal report ENV-MNUL-T301 revision V2018-01. May 7, 2019.
New Gold. 2024a. Annual Reclamation Report for 2023. New Afton Mine. Kamloops, BC. March 2024.
New Gold. 2024b. New Afton: 2023 Ministry of Environment & Climate Change Strategy Annual Report for
Authorization Number 100223. March 2024.
|
|
New Afton Operations
British Columbia
Technical Report Summary
|
New Gold. 2024c. New Afton: 2023 Ministry of Environment & Climate Change Strategy Annual Report 100224. March 2024.
New Gold. 2024d. New Afton Mine – Mine Reclamation and Closure Plan 2024 – Mines Act Permit M-229. November 1,
2024.
Nickson SD (1992) Cable support guidelines for underground hard rock mine operations. Ph.D. Dissertation,
University of British Columbia
Okane. 2024. New Afton Mine Closure Failure Modes and Effects Analysis. October 2024. M. A. O’Kane Consultants
Inc.
Potvin Y. 1988. Empirical open stope design in Canada. Ph.D. Dissertation, University of British Columbia.
Price RA. 1994. Cordilleran Tectonics. In: Geological Atlas of the Western
Canadian Sedimentary Base, G. D. Mossop and I. Shetsen (comp.), Canadian Society of Petroleum Geologists and Alberta Research Council.
Rescan. 2007. Application for a Permit Approving the Mine Plan and Reclamation Program Pursuant to the Mines Act
R.S.B.C. 1996, C. 293. New Afton Gold-Copper Mine, British Columbia, Canada. January 2007.
Roscoe Postle Associates Inc. 2006. Technical Report on the New Afton Project. Internal report prepared by
Wallis S and Giroux G, for New Gold Inc., 44 p.
Roscoe Postle Associates Inc. 2009. Technical Report on the New Afton Copper/Gold Project, Kamloops, B.C.
Prepared by Bergen RD, Rennie DW, and Scott KC, for New Gold Inc., 160 p., filed on SEDAR.
Roscoe Postle Associates Inc. 2015. Technical Report on the New Afton Mine, British Columbia, Canada, prepared
by Bergen RD, Krutzelmann H, and Rennie DW, for New Gold Inc. (March 23, 2015), 256 p., filed on SEDAR.
Roscoe Postle Associates Inc. 2016. Technical Report on the New Afton Mine, British Columbia, Canada, prepared
by Rennie DW, Bergen RD, and Krutzelmann H, for New Gold Inc. (March 15, 2016), 247 p., filed on SEDAR.
Roscoe Postle Associates Inc. 2020. Technical Report on the New Afton Mine, British Columbia, Canada, prepared
by Rennie DW, Lecuyer NL, Krutzelmann H, and Vasquez L, for New Gold Inc (February 28, 2020), filed on SEDAR.
SGS. 2019. 16337-06 – New Afton Gold Deportment – July 25 2019, an Excel workbook prepared for New Gold Inc.
(July 24, 2019).
Sim R and Davis B. 2014. Mineral Resource Model, Draft internal report to New Gold, 52 p. (September 5, 2014).
Sim R and Davis B. 2019. Mineral Resource Model and Estimate of Mineral Resources as of December 31, 2018.
Internal report to New Gold Inc. June 10, 2019, revised November 6, 2019, 49 p.
SLR Consulting (Canada) Ltd. 2024. New Afton Mine Year-End 2023 Mineral Reserves Review, letter report issued to
J. Parsons. March 25, 2024.
|
|
New Afton Operations
British Columbia
Technical Report Summary
|
|
Abbreviation/Symbol
|
Definition
|
||
|
'
|
minutes (geographic)
|
||
|
"
|
seconds (geographic)
|
||
|
#
|
number
|
||
|
%
|
percent
|
||
|
<
|
less than
|
||
|
>
|
greater than
|
||
|
°C
|
degree Celsius
|
||
|
º
|
degrees
|
||
|
µ
|
micron
|
||
|
µm
|
micrometer (micron)
|
||
|
a
|
annum
|
||
|
A
|
ampere
|
||
|
AA
|
atomic absorption
|
||
|
AEP
|
annual exceedance probability
|
||
|
Ag
|
silver
|
||
|
AIA
|
Archaeological Impact Assessment
|
||
|
APTSF
|
Afton Pit Tailings Storage Facility
|
||
|
As
|
arsenic
|
||
|
Au
|
gold
|
||
|
B3
|
Block 3 block cave
|
||
|
C$
|
Canadian dollars
|
||
|
CA
|
Cooperation Agreement (New Gold & SSN)
|
||
|
cfm
|
cubic feet per minute
|
||
|
cm
|
centimeter
|
||
|
cm²
|
square centimeter
|
||
|
CRF
|
cemented rockfill
|
||
|
Cu
|
copper
|
||
|
CuEq
|
copper-equivalent
|
||
|
Cu Eq
|
copper equivalent
|
||
|
d
|
day
|
||
|
dia.
|
diameter
|
||
|
dmt
|
dry metric tonne
|
||
|
EDF
|
environmental design flood
|
||
|
EMA
|
BC Environmental Management Act
|
||
|
EMC
|
Environmental Management Committee
|
|
|
New Afton Operations
British Columbia
Technical Report Summary
|
|
Abbreviation/Symbol
|
Definition
|
||
|
ENV
|
BC Ministry of Environment and Parks
|
||
|
EOR
|
Engineer of Record
|
||
|
FMEA
|
failure modes and effects analysis
|
||
|
ft
|
feet
|
||
|
ft³
|
cubic foot / cubic feet
|
||
|
g
|
gram
|
||
|
g/L
|
gram per liter
|
||
|
g/t
|
gram per tonne
|
||
|
G&A
|
general and administrative expenses
|
||
|
GPS
|
global positioning system
|
||
|
ha
|
hectare
|
||
|
HATSF
|
Historical Afton Tailings Storage Facility
|
||
|
HCT
|
humidity cell testing
|
||
|
HHERA
|
Human Health and Ecological Risk Assessment
|
||
|
HOD
|
height of draw
|
||
|
HP
|
horsepower
|
||
|
hp
|
horsepower
|
||
|
HQ
|
2.5 inch core size
|
||
|
HR
|
hydraulic radius
|
||
|
HRCR
|
critical hydraulic radius
|
||
|
HSRC
|
Health, Safety and Reclamation Code
|
||
|
HW
|
Hanging wall zones
|
||
|
ICP
|
inductively coupled plasma
|
||
|
ID2
|
inverse distance interpolation (power of 2)
|
||
|
IMB
|
Iron Mask Batholith
|
||
|
IOC
|
Integrated Operations Centre
|
||
|
IST
|
in situ stress testing
|
||
|
ITRB
|
Independent Tailings Review Board
|
||
|
k
|
kilo (thousand)
|
||
|
kg
|
kilogram
|
||
|
km
|
kilometer
|
||
|
km/h
|
kilometer per hour
|
||
|
km²
|
square kilometer
|
||
|
kV
|
kilovolt
|
||
|
kW
|
kilowatt
|
||
|
kWh
|
kilowatt-hour
|
||
|
L
|
liter
|
||
|
lb
|
pound
|
|
|
New Afton Operations
British Columbia
Technical Report Summary
|
|
Abbreviation/Symbol
|
Definition
|
||
|
lbs
|
pounds
|
||
|
LHD
|
load-haul-dump
|
||
|
LiDAR
|
light detection and ranging
|
||
|
LOM
|
life of mine
|
||
|
LTE
|
long-term evolution
|
||
|
M
|
mega (million)
|
||
|
Ma
|
mega annum (million years)
|
||
|
MAC
|
Mining Association of Canada
|
||
|
masl
|
meter above sea level
|
||
|
max
|
maximum
|
||
|
MCM
|
BC Ministry of Mines and Critical Minerals
|
||
|
mesh
|
size based on number of screen openings per inch
|
||
|
MG
|
mine grid (elevation)
|
||
|
mg
|
milligram
|
||
|
min
|
minimum
|
||
|
mm
|
millimeter
|
||
|
MoE
|
Ministry of Environment and Climate Change Strategy
|
||
|
MPa
|
megapascal
|
||
|
MPBX
|
multi-point borehole extensometers
|
||
|
MFLRNO
|
Ministry of Forests, Lands, Natural Resource Operations and Rural Development
|
||
|
Mst/a
|
million tons per year
|
||
|
Mt
|
million tonne
|
||
|
MVA
|
megavolt-amperes
|
||
|
MW
|
megawatt
|
||
|
MWh
|
megawatt-hour
|
||
|
m
|
meter
|
||
|
m²
|
square meter
|
||
|
m³
|
cubic meter
|
||
|
m³/h
|
cubic meter per hour
|
||
|
NATSF
|
New Afton Tailings Storage Facility
|
||
|
NN
|
nearest neighbor
|
||
|
NSERC
|
Natural Sciences and Engineering Research Council
|
||
|
NSR
|
net smelter return
|
||
|
NWWMP
|
Northwest Water Management Pond
|
||
|
OK
|
ordinary kriging
|
||
|
OES
|
optical emission spectroscopy
|
||
| oz |
troy ounce |
|
|
New Afton Operations
British Columbia
Technical Report Summary
|
|
Abbreviation/Symbol
|
Definition
|
||
|
oz/st
|
ounces per ton
|
||
|
P.Eng.
|
Professional Engineer
|
||
|
P.Geo.
|
Professional Geologist
|
||
|
PCBC
|
GEOVIA PCBC software
|
||
|
Pd
|
palladium
|
||
|
pH
|
measure of acidity or alkalinity
|
||
|
PHTSF
|
Pothook Pit Tailings Storage Facility
|
||
|
PM
|
particulate matter
|
||
|
PM2.5
|
particulate matter ≤2.5 µm
|
||
|
PM10
|
particulate matter ≤10 µm
|
||
|
ppm
|
parts per million
|
||
|
ppb
|
part per billion
|
||
|
Pt
|
platinum
|
||
|
QA
|
quality assurance
|
||
|
QC
|
quality control
|
||
|
QA/QC
|
quality assurance and quality control
|
||
|
QP
|
Qualified Person
|
||
|
QPO
|
Quantifiable Performance Objective
|
||
|
RC
|
reverse circulation
|
||
|
RCP
|
Reclamation and Closure Plan
|
||
|
RMR89
|
rock mass rating
|
||
|
ROM
|
run-of-mine
|
||
|
RQD
|
rock quality designation
|
||
|
RSBC
|
Revised Statutes of British Columbia
|
||
|
s
|
second
|
||
|
S
|
sulphur
|
||
|
SAG
|
semi-autogenous grinding
|
||
|
SBC
|
Statutes of British Columbia
|
||
|
SFR
|
staged flotation reaction
|
||
|
SIB
|
Skeetchestn Indian Band
|
||
|
SMC
|
semi-autogenous mill comminution
|
||
|
SPI
|
SAG Power Index
|
||
|
SSN
|
Stk’emlupsemc Te Secwepemc Nation
|
||
|
st
|
US short ton (2,000 lb)
|
||
|
st/h
|
tons per hour
|
||
|
st/ft³
|
tons per cubic foot
|
||
|
t
|
metric tonne
|
||
|
TARP
|
Trigger Action Response Plan
|
|
|
New Afton Operations
British Columbia
Technical Report Summary
|
| Abbreviation/Symbol | Definition | ||
|
TAT
|
thickened and amended tailings
|
||
|
tph
|
tonne per hour
|
||
|
t/a
|
tonne per annum
|
||
|
t/d
|
tonne per day
|
||
|
t/od
|
tonne per operating day
|
||
|
TRU
|
Thompson Rivers University
|
||
|
TSF
|
tailings storage facility
|
||
|
TSM
|
Towards Sustainable Mining
|
||
|
US$
|
United States dollar
|
||
|
W
|
watt
|
||
|
WLRS
|
Ministry of Water, Lands and Resource Stewardship
|
||
|
WMP
|
water management pond
|
||
|
wmt
|
wet metric tonne
|
||
|
wt%
|
weight percent
|
||
|
WQG-FWAL
|
Water Quality Guidelines for Freshwater Aquatic Life
|
|
Term
|
Definition
|
||
|
acid rock drainage/ acid mine
drainage
|
Characterized by low pH, high sulfate, and high iron and other metal species.
|
||
|
ANFO
|
A free-running explosive used in mine blasting made of 94% prilled aluminum nitrate and 6% No. 3 fuel oil.
|
||
|
aquifer
|
A geologic formation capable of transmitting significant quantities of groundwater under normal hydraulic gradients.
|
||
|
argillic alteration
|
Introduces any one of a wide variety of clay minerals, including kaolinite, smectite and illite. Argillic alteration is generally a low temperature event, and some may
occur in atmospheric conditions
|
||
|
azimuth
|
The direction of one object from another, usually expressed as an angle in degrees relative to true north. Azimuths are usually measured in the clockwise direction, thus
an azimuth of 90 degrees indicates that the second object is due east of the first.
|
||
|
comminution/crushing/grinding
|
Crushing and/or grinding of ore by impact and abrasion. Usually, the word "crushing" is used for dry methods and "grinding" for wet methods. Also, "crushing" usually
denotes reducing the size of coarse rock while "grinding" usually refers to the reduction of the fine sizes.
|
||
|
cut-off grade
|
A grade level below which the material is not “ore” and considered to be uneconomical to mine and process. The minimum grade of ore used to establish reserves.
|
||
|
data verification
|
The process of confirming that data has been generated with proper procedures, has been accurately transcribed from the original source and is suitable to be used for
mineral resource and mineral reserve estimation
|
|
|
New Afton Operations
British Columbia
Technical Report Summary
|
|
Term
|
Definition
|
||
|
density
|
The mass per unit volume of a substance, commonly expressed in grams/ cubic centimeter.
|
||
|
dilution
|
Waste of low-grade rock which is unavoidably removed along with the ore in the mining process.
|
||
|
feasibility study
|
A feasibility study is a comprehensive technical and economic study of the selected development option for a mineral project, which includes detailed assessments of all applicable modifying
factors, as defined by this section, together with any other relevant operational factors, and detailed financial analysis that are necessary to demonstrate, at the time of reporting, that
extraction is economically viable. The results of the study may serve as the basis for a final decision by a proponent or financial institution to proceed with, or finance, the development of the
project.
A feasibility study is more comprehensive, and with a higher degree of accuracy, than a pre-feasibility study. It must contain mining, infrastructure, and process designs completed with
sufficient rigor to serve as the basis for an investment decision or to support project financing.
|
||
|
flowsheet
|
The sequence of operations, step by step, by which ore is treated in a milling, concentration, or smelting process.
|
||
|
gangue
|
The fraction of ore rejected as tailing in a separating process. It is usually the valueless portion, but may have some secondary commercial use
|
||
|
indicated mineral resource
|
An indicated mineral resource is that part of a mineral resource for which quantity and grade or quality are estimated on the basis of adequate geological evidence and
sampling. The term adequate geological evidence means evidence that is sufficient to establish geological and grade or quality continuity with reasonable certainty. The level of geological
certainty associated with an indicated mineral resource is sufficient to allow a qualified person to apply modifying factors in sufficient detail to support mine planning and evaluation of the
economic viability of the deposit.
|
||
|
inferred mineral resource
|
An inferred mineral resource is that part of a mineral resource for which quantity and grade or quality are estimated on the basis of limited geological evidence and sampling. The term limited
geological evidence means evidence that is only sufficient to establish that geological and grade or quality continuity is more likely than not. The level of geological uncertainty associated with
an inferred mineral resource is too high to apply relevant technical and economic factors likely to influence the prospects of economic extraction in a manner useful for evaluation of economic
viability.
A qualified person must have a reasonable expectation that the majority of inferred mineral resources could be upgraded to indicated or measured mineral resources with continued exploration;
and should be able to defend the basis of this expectation before his or her peers.
|
||
|
internal rate of return (IRR)
|
The rate of return at which the Net Present Value of a project is zero; the rate at which the present value of cash inflows is equal to the present value of the cash
outflows.
|
||
|
initial assessment
|
An initial assessment is a preliminary technical and economic study of the economic potential of all or parts of mineralization to support the
disclosure of mineral resources. The initial assessment must be prepared by a qualified person and must include appropriate assessments of reasonably assumed technical and economic factors,
together with any other relevant operational factors, that are necessary to demonstrate at the time of reporting that there are reasonable prospects for economic extraction. An initial assessment
is required for disclosure of mineral resources but cannot be used as the basis for disclosure of mineral reserves
|
|
|
New Afton Operations
British Columbia
Technical Report Summary
|
| Term | Definition | ||
|
life of mine (LOM)
|
Number of years that the operation is planning to mine and treat ore, and is taken from the current mine plan based on the current evaluation of ore reserves.
|
||
|
measured mineral resource
|
A measured mineral resource is that part of a mineral resource for which quantity and grade or quality are estimated on the basis of conclusive geological evidence and
sampling. The term conclusive geological evidence means evidence that is sufficient to test and confirm geological and grade or quality continuity. The level of geological certainty associated
with a measured mineral resource is sufficient to allow a qualified person to apply modifying factors, as defined in this section, in sufficient detail to support detailed mine planning and final
evaluation of the economic viability of the deposit.
|
||
|
mineral reserve
|
A mineral reserve is an estimate of tonnage and grade or quality of indicated and measured mineral resources that, in the opinion of the qualified person, can be the basis of an economically
viable project. More specifically, it is the economically mineable part of a measured or indicated mineral resource, which includes diluting materials and allowances for losses that may occur when
the material is mined or extracted.
The determination that part of a measured or indicated mineral resource is economically mineable must be based on a preliminary feasibility (pre-feasibility) or feasibility study, as defined by
this section, conducted by a qualified person applying the modifying factors to indicated or measured mineral resources. Such study must demonstrate that, at the time of reporting, extraction of
the mineral reserve is economically viable under reasonable investment and market assumptions. The study must establish a life of mine plan that is technically achievable and economically viable,
which will be the basis of determining the mineral reserve.
The term economically viable means that the qualified person has determined, using a discounted cash flow analysis, or has otherwise analytically determined, that extraction of the mineral
reserve is economically viable under reasonable investment and market assumptions.
The term investment and market assumptions includes all assumptions made about the prices, exchange rates, interest and discount rates, sales volumes, and costs that are necessary to determine
the economic viability of the mineral reserves. The qualified person must use a price for each commodity that provides a reasonable basis for establishing that the project is economically viable.
|
||
|
mineral resource
|
A mineral resource is a concentration or occurrence of material of economic interest in or on the Earth’s crust in such form, grade or quality, and quantity that there are reasonable prospects
for economic extraction.
The term material of economic interest includes mineralization, including dumps and tailings, mineral brines, and other resources extracted on or within the earth’s crust. It does not include
oil and gas resources as defined in Regulation S-X (§210.4-10(a)(16)(D) of this chapter), gases (e.g., helium and carbon dioxide), geothermal fields, and water.
When determining the existence of a mineral resource, a qualified person, as defined by this section, must be able to estimate or interpret the location, quantity, grade or quality continuity,
and other geological characteristics of the mineral resource from specific geological evidence and knowledge, including sampling; and conclude that there are reasonable prospects for economic
extraction of the mineral resource based on an initial assessment, as defined in this section, that he or she conducts by qualitatively applying relevant technical and economic factors likely to
influence the prospect of economic extraction.
|
|
|
New Afton Operations
British Columbia
Technical Report Summary
|
| Term | Definition | ||
|
mining claim
|
A description by boundaries of real property in which metal ore and/or minerals may be located.
|
||
|
modifying factors
|
The factors that a qualified person must apply to indicated and measured mineral resources and then evaluate in order to establish the economic viability of mineral
reserves. A qualified person must apply and evaluate modifying factors to convert measured and indicated mineral resources to proven and probable mineral reserves. These factors include, but are
not restricted to: mining; processing; metallurgical; infrastructure; economic; marketing; legal; environmental compliance; plans, negotiations, or agreements with local individuals or groups; and
governmental factors. The number, type and specific characteristics of the modifying factors applied will necessarily be a function of and depend upon the mineral, mine, property, or project.
|
||
|
net smelter return royalty (NSR)
|
A defined percentage of the gross revenue from a resource extraction operation, less a proportionate share of transportation, insurance, and processing costs.
|
||
|
open pit
|
A mine that is entirely on the surface. Also referred to as open-cut or open-cast mine.
|
||
|
ounce (oz) (troy)
|
Used in imperial statistics. A kilogram is equal to 32.1507 ounces. A troy ounce is equal to 31.1035 grams.
|
||
|
plant
|
A group of buildings, and especially to their contained equipment, in which a process or function is carried out; on a mine it will include warehouses, hoisting
equipment, compressors, repair shops, offices, mill or concentrator.
|
||
|
potassic alteration
|
A relatively high temperature type of alteration which results from potassium enrichment. Characterized by biotite, K-feldspar.
|
||
|
preliminary feasibility study, pre-feasibility study
|
A preliminary feasibility study (prefeasibility study) is a comprehensive study of a range of options for the technical and economic viability of a mineral project that has advanced to a stage
where a qualified person has determined (in the case of underground mining) a preferred mining method, or (in the case of surface mining) a pit configuration, and in all cases has determined an
effective method of mineral processing and an effective plan to sell the product.
A pre-feasibility study includes a financial analysis based on reasonable assumptions, based on appropriate testing, about the modifying factors and the evaluation of any other relevant factors
that are sufficient for a qualified person to determine if all or part of the indicated and measured mineral resources may be converted to mineral reserves at the time of reporting. The financial
analysis must have the level of detail necessary to demonstrate, at the time of reporting, that extraction is economically viable
|
|
|
New Afton Operations
British Columbia
Technical Report Summary
|
| Term | Definition | ||
|
probable mineral reserve
|
A probable mineral reserve is the economically mineable part of an indicated and, in some cases, a measured mineral resource. For a probable mineral reserve, the
qualified person’s confidence in the results obtained from the application of the modifying factors and in the estimates of tonnage and grade or quality is lower than what is sufficient for a
classification as a proven mineral reserve, but is still sufficient to demonstrate that, at the time of reporting, extraction of the mineral reserve is economically viable under reasonable
investment and market assumptions. The lower level of confidence is due to higher geologic uncertainty when the qualified person converts an indicated mineral resource to a probable reserve or
higher risk in the results of the application of modifying factors at the time when the qualified person converts a measured mineral resource to a probable mineral reserve. A qualified person must
classify a measured mineral resource as a probable mineral reserve when his or her confidence in the results obtained from the application of the modifying factors to the measured mineral resource
is lower than what is sufficient for a proven mineral reserve.
|
||
|
propylitic
|
Characteristic greenish color. Minerals include chlorite, actinolite and epidote. Typically contains the assemblage quartz-chlorite-carbonate
|
||
|
proven mineral reserve
|
A proven mineral reserve is the economically mineable part of a measured mineral resource. For a proven mineral reserve, the qualified person has a high degree of
confidence in the results obtained from the application of the modifying factors and in the estimates of tonnage and grade or quality. A proven mineral reserve can only result from conversion of a
measured mineral resource.
|
||
|
qualified person
|
A qualified person is an individual who is a mineral industry professional with at least five years of relevant experience in the type of mineralization and type of deposit under consideration
and in the specific type of activity that person is undertaking on behalf of the registrant; and an eligible member or licensee in good standing of a recognized professional organization at the
time the technical report is prepared.
For an organization to be a recognized professional organization, it must:
(A) Be either:
(1) An organization recognized within the mining industry as a reputable professional association, or
(2) A board authorized by U.S. federal, state, or foreign statute to regulate professionals in the mining, geoscience or related field;
(B) Admit eligible members primarily on the basis of their academic qualifications and experience;
(C) Establish and require compliance with professional standards of competence and ethics;
(D) Require or encourage continuing professional development;
(E) Have and apply disciplinary powers, including the power to suspend or expel a member regardless of where the member practices or resides; and;
(F) Provide a public list of members in good standing.
|
||
|
reclamation
|
The restoration of a site after mining or exploration activity is completed.
|
||
|
refining
|
A high temperature process in which impure metal is reacted with flux to reduce the impurities. The metal is collected in a molten layer and the impurities in a slag
layer. Refining results in the production of a marketable material.
|
||
|
refractory
|
Gold mineralization normally requiring more sophisticated processing technology for extraction, such as roasting or autoclaving under pressure.
|
|
|
New Afton Operations
British Columbia
Technical Report Summary
|
| Term | Definition | ||
|
rock quality designation (RQD)
|
A measure of the competency of a rock, determined by the number of fractures in a given length of drill core. For example, a friable ore will have many fractures and a
low RQD.
|
||
|
royalty
|
An amount of money paid at regular intervals by the lessee or operator of an exploration or mining property to the owner of the ground. Generally based on a specific
amount per tonne or a percentage of the total production or profits. Also, the fee paid for the right to use a patented process.
|
||
|
run-of-mine (ROM)
|
Rehandle where the raw mine ore material is fed into the processing plant’s system, usually the crusher. This is where material that is not direct feed from the mine is
stockpiled for later feeding. Run-of-mine relates to the rehandle being for any mine material, regardless of source, before entry into the processing plant’s system.
|
|
|
New Afton Operations
British Columbia
Technical Report Summary
|
| 25.0 |
RELIANCE ON INFORMATION PROVIDED BY THE REGISTRANT
|
| 25.1 |
Introduction
|
The Qualified Persons fully relied on the registrant for guidance in the areas noted in the following sub-sections.
As the operations have been in production for approximately 15 years, first under New Gold management, and now Coeur’s management, the registrant has
considerable experience in this area.
The QPs took undertook checks that the information provided by the registrant was suitable to be used in the Report.
| 25.2 |
Macroeconomic Trends
|
| • |
Information relating to inflation, interest rates, discount rates, taxes.
|
This information is used in the economic analysis in Chapter 19. It supports the mineral resource estimate in Chapter 11, and the mineral reserve
estimate in Chapter 12.
| 25.3 |
Markets
|
| • |
Information relating to market studies/markets for product, market entry strategies, marketing and sales contracts, product valuation, product specifications,
refining and treatment charges, transportation costs, agency relationships, material contracts (e.g. mining, concentrating, smelting, refining, transportation, handling, hedging arrangements,
and forward sales contracts), and contract status (in place, renewals).
|
This information is used when discussing the market, commodity price, and contract information in Chapter 16, and in the economic analysis in Chapter 19.
It supports the mineral resource estimate in Chapter 11, and the mineral reserve estimate in Chapter 12.
| 25.4 |
Legal Matters
|
| • |
Information relating to the corporate ownership interest, the mineral tenure (concessions, payments to retain, obligation to meet expenditure/reporting of work
conducted), surface rights, water rights (water take allowances), royalties, encumbrances, easements and rights-of-way, violations and fines, permitting requirements, ability to maintain and
renew permits
|
This information is used in support of the property ownership information in Chapter 3, the permitting and closure discussions in Chapter 17, and the
economic analysis in Chapter 19. It supports the mineral resource estimate in Chapter 11, and the mineral reserve estimate in Chapter 12.
|
|
New Afton Operations
British Columbia
Technical Report Summary
|
| 25.5 |
Environmental Matters
|
| • |
Information relating to baseline and supporting studies for environmental permitting, environmental permitting and monitoring requirements, ability to maintain and
renew permits, emissions controls, closure planning, closure and reclamation bonding and bonding requirements, sustainability accommodations, and monitoring for and compliance with requirements
relating to protected areas and protected species.
|
This information is used when discussing property ownership information in Chapter 3, the permitting and closure discussions in Chapter 17, and the
economic analysis in Chapter 19. It supports the mineral resource estimate in Chapter 11, and the mineral reserve estimate in Chapter 12.
| 25.6 |
Stakeholder Accommodations
|
| • |
Information relating to social and stakeholder baseline and supporting studies, relationships with the local ski areas, hiring and training policies for workforce
from local communities, partnerships with stakeholders (including national, regional, and state mining associations; trade organizations; fishing organizations; state and local chambers of
commerce; economic development organizations; non-government organizations; and, state and federal governments), and the community relations plan.
|
This information is used in the social and community discussions in Chapter 17, and the economic analysis in Chapter 19. It supports the mineral resource
estimate in Chapter 11, and the mineral reserve estimate in Chapter 12.
| 25.7 |
Governmental Factors
|
| • |
Information relating to taxation and royalty considerations at the Project level, monitoring requirements and monitoring frequency, and bonding requirements.
|
This information is used in the economic analysis in Chapter 19. It supports the mineral resource estimate in Chapter 11, and the mineral reserve
estimate in Chapter 12.