Pay vs Performance Disclosure - USD ($)
Dec. 31, 2025
Dec. 31, 2024
Dec. 31, 2023
Dec. 31, 2022
Dec. 31, 2021
PAY VERSUS PERFORMANCE
In this section, we are including the required disclosure for pay versus performance as defined by the Securities and Exchange Commission (SEC) for our principal executive officer(s) (PEO(s)) and
Non-PEO
NEOs and Company performance for the fiscal years listed below. Pay Versus Performance |
||||||||||||||||||||||||||||||||
Year 1 |
Summary Compensation Table Total for CEO |
Comp Actually Paid to CEO 2 |
Average Summary Compensation Table Total for Non-CEO NEOs |
Average Comp Actually Paid to Non-CEO NEOs 2 |
Value of Initial Fixed $100 Investment Based On: 3 |
Net Income (Loss) $M |
Standalone AT&T Adjusted Operating Income $M 4 |
|||||||||||||||||||||||||
AT&T TSR |
S&P 500 CSI |
|||||||||||||||||||||||||||||||
2025 |
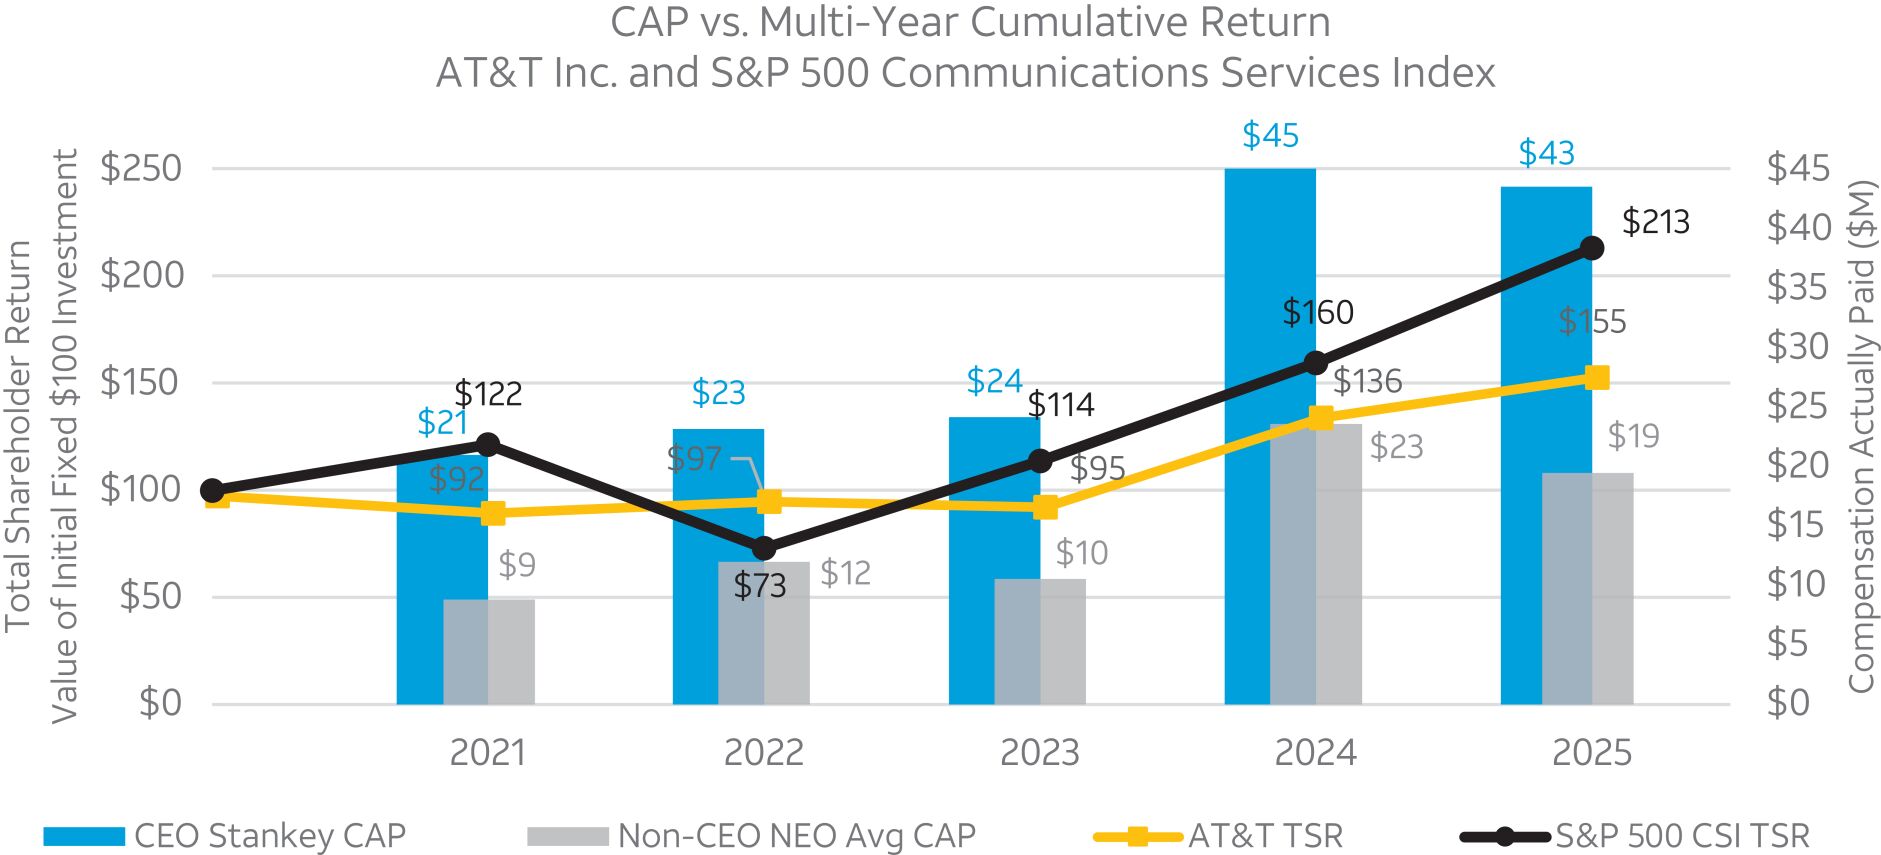
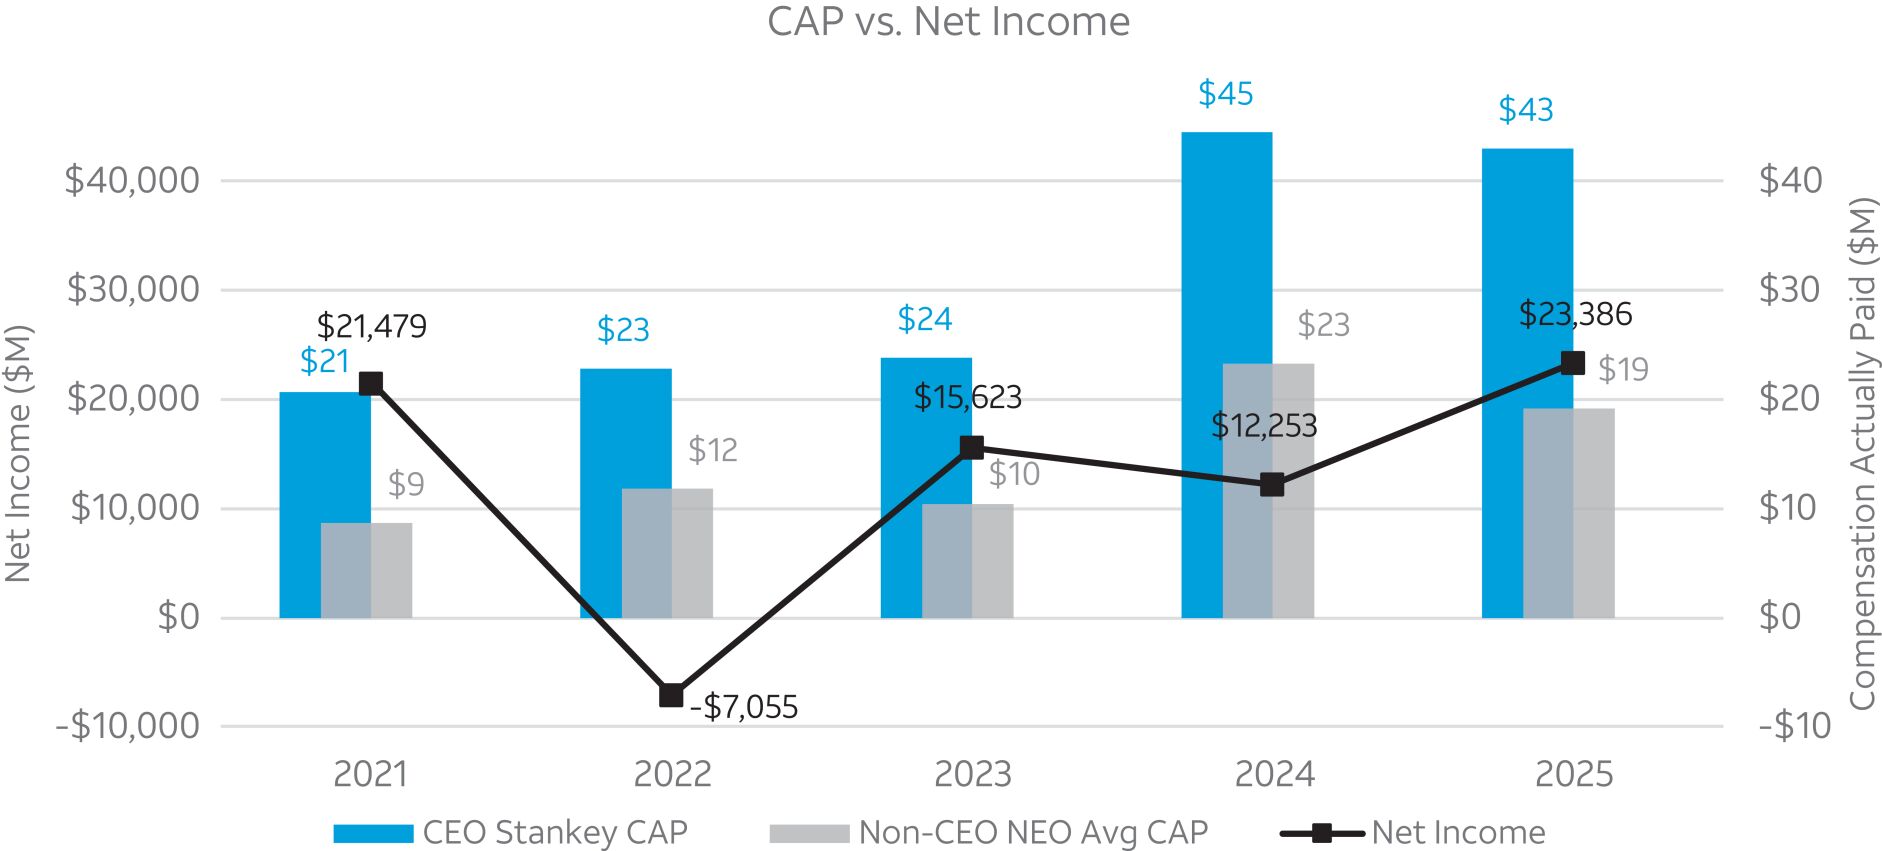
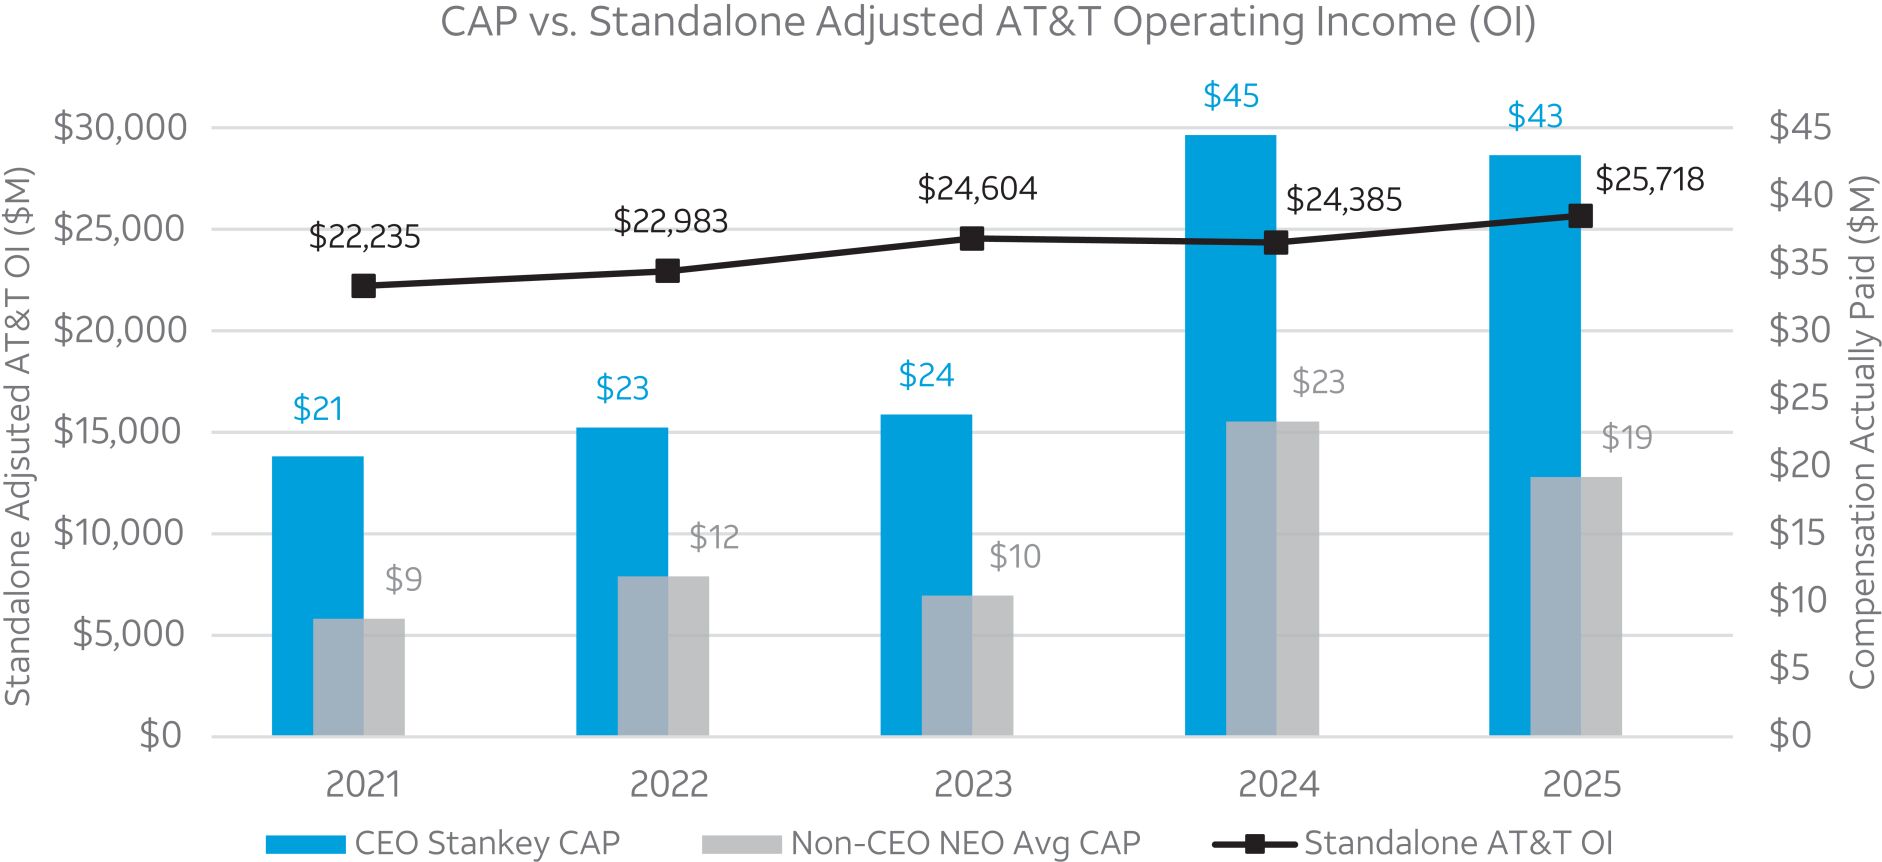
$ | 29,906,872 | $ | 43,038,808 | $ | 12,716,814 | $ | 19,240,076 | $ | 155 | $ | 213 | $ | 23,386 | $ | 25,718 | ||||||||||||||||
2024 |
$ | 26,410,845 | $ | 44,542,542 | $ | 13,656,225 | $ | 23,344,356 | $ | 136 | $ | 160 | $ | 12,253 | $ | 24,385 | ||||||||||||||||
2023 |
$ | 26,450,157 | $ | 23,872,707 | $ | 11,679,630 | $ | 10,454,047 | $ | 95 | $ | 114 | $ | 15,623 | $ | 24,604 | ||||||||||||||||
2022 |
$ | 22,915,526 | $ | 22,874,696 | $ | 11,526,718 | $ | 11,866,965 | $ | 97 | $ | 73 | ($ | 7,055 | ) | $ | 22,983 | |||||||||||||||
2021 |
$ | 24,820,879 | $ | 20,751,888 | $ | 10,436,274 | $ | 8,724,822 | $ | 92 | $ | 122 | $ | 21,479 | $ | 22,235 | ||||||||||||||||
Note 1.
Non-CEO
NEOs for each year are presented as follows: • |
2022 – 2025: Pascal Desroches, Lori Lee, David McAtee, and Jeff McElfresh |
• |
2021: Pascal Desroches, Lori Lee, David McAtee, Jeff McElfresh, John Stephens, and Randall Stephenson |
Note 2.
mark-to-market
Compensation – Stock Compensation
Note 3.
Note 4.
mark-to-market
in-excess
of $300 million for 2023-25;
additionally, for 2023-25,
the actuarial and mark-to-market
2023-25;
and (4) for 2024 and 2025, costs related to a legal matter in excess of $300 million. Standalone AT&T Adjusted Operating Income also removes the results from U.S. Video operations and other dispositions that did not meet the criteria for discontinued operations, which impacts 2021. Compensation Actually Paid (CAP) calculations are as
follows
: CEO SCT Total to CAP Reconciliation |
||||||||||||||||||||||||
Year |
Summary Compensation Table Total |
Deductions from SCT Total for Equity Awards |
Deductions from SCT Total for Pension Benefits |
Additions to SCT Total for Equity Awards 1 |
Additions to SCT Total for Pension Service Costs 1,2 |
CAP |
||||||||||||||||||
2025 |
$ | 29,906,872 | $ | 19,500,012 | $ | 1,496,923 | $ | 34,129,081 | ($ | 210 | ) | $ | 43,038,808 | |||||||||||
2024 |
$ | 26,410,845 | $ | 16,499,998 | $ | 1,203,091 | $ | 35,833,627 | $ | 1,159 | $ | 44,542,542 | ||||||||||||
2023 |
$ | 26,450,157 | $ | 16,500,000 | $ | 746,941 | $ | 14,669,708 | ($ | 217 | ) | $ | 23,872,707 | |||||||||||
2022 |
$ | 22,915,526 | $ | 13,499,988 | $ | 1,262,050 | $ | 14,718,993 | $ | 2,215 | $ | 22,874,696 | ||||||||||||
2021 |
$ | 24,820,879 | $ | 13,420,341 | $ | 1,464,778 | $ | 10,877,758 | ($ | 61,630 | ) | $ | 20,751,888 | |||||||||||
Note 1.
Equity |
Pension |
|||||||||||||||||||||||||||||||||||
Year |
Year End Fair Value of Equity Awards Granted in the Year |
Year over Year Change in Fair Value of Outstanding Unvested Equity Awards Granted in Prior Years |
Fair Value as of Vesting Date of Equity Awards Granted and Vested in the Year |
Year over Year Change in Fair Value of Equity Awards Granted in Prior Years that Vested in the Year |
Value of Dividends or other Earnings Paid on Equity Awards not Otherwise Reflected in Fair Value or Total Compensation |
Total Equity Award Adjustments |
Service Cost |
Prior Service Cost |
Total Service Cost |
|||||||||||||||||||||||||||
2025 |
$ | 21,627,722 | $ | 3,660,767 | $ | 4,875,003 | $ | 1,810,295 | $ | 2,155,294 | $ | 34,129,081 | ($ | 210 | ) | $0 | ($ | 210 | ) | |||||||||||||||||
2024 |
$ | 22,142,092 | $ | 7,426,648 | $ | 4,125,004 | $ | 150,283 | $ | 1,989,600 | $ | 35,833,627 | $ | 1,159 | $0 | $ | 1,159 | |||||||||||||||||||
2023 |
$ | 10,278,799 | ($ | 1,708,660 | ) | $ | 4,125,000 | $ | 311,691 | $ | 1,662,878 | $ | 14,669,708 | ($ | 217 | ) | $0 | ($ | 217 | ) | ||||||||||||||||
2022 |
$ | 11,316,638 | ($ | 1,436,890 | ) | $ | 3,374,991 | ($ | 53,056 | ) | $ | 1,517,311 | $ | 14,718,993 | $ | 2,215 | $0 | $ | 2,215 | |||||||||||||||||
2021 |
$ | 7,783,605 | ($ | 1,978,709 | ) | $ | 3,375,014 | $ | 5,389 | $ | 1,692,459 | $ | 10,877,758 | ($ | 61,630 | ) | $0 | ($ | 61,630 | ) | ||||||||||||||||
Note 2.
Average Non-CEO NEO’s SCT Total to CAP Reconciliation |
||||||||||||||||||||||||
Year |
Summary Compensation Table Total |
Deductions from SCT Total for Equity Awards |
Deductions from SCT Total for Pension Benefits |
Additions to SCT Total for Equity Award 1 |
Additions to SCT Total for Pension Costs 1 |
CAP |
||||||||||||||||||
2025 |
$ | 12,716,814 | $ | 8,025,007 | $ | 309,001 | $ | 14,801,763 | $ | 55,507 | $ | 19,240,076 | ||||||||||||
2024 |
$ | 13,656,225 | $ | 9,406,249 | $ | 197,153 | $ | 19,227,852 | $ | 63,681 | $ | 23,344,356 | ||||||||||||
2023 |
$ | 11,679,630 | $ | 7,156,255 | $ | 145,620 | $ | 6,025,311 | $ | 50,981 | $ | 10,454,047 | ||||||||||||
2022 |
$ | 11,526,718 | $ | 7,468,746 | $ | 528,796 | $ | 8,150,222 | $ | 187,567 | $ | 11,866,965 | ||||||||||||
2021 |
$ | 10,436,274 | $ | 3,979,166 | $ | 785,922 | $ | 2,760,131 | $ | 293,505 | $ | 8,724,822 | ||||||||||||
Note 1.
Non-CEO
NEOs: Equity |
Pension |
|||||||||||||||||||||||||||||||||||
Year |
Year End Fair Value of Equity Awards Granted in the Year |
Year over Year Change in Fair Value of Outstanding Unvested Equity Awards Granted in Prior Years |
Fair Value as of Vesting Date of Equity Awards Granted and Vested in the Year |
Year over Year Change in Fair Value of Equity Awards Granted in Prior Years that Vested in the Year |
Value of Dividends or other Earnings Paid on Equity Awards not Otherwise Reflected in Fair Value or Total Compensation |
Total Equity Award Adjustments |
Service Cost |
Prior Service Cost |
Total Service Cost |
|||||||||||||||||||||||||||
2025 |
$ | 8,777,481 | $ | 1,993,762 | $ | 1,881,252 | $ | 1,001,529 | $ | 1,147,739 | $ | 14,801,763 | $ | 55,507 | $ | 0 | $ | 55,507 | ||||||||||||||||||
2024 |
$ | 11,940,544 | $ | 4,196,645 | $ | 1,851,562 | $ | 176,810 | $ | 1,062,292 | $ | 19,227,852 | $ | 63,681 | $ | 0 | $ | 63,681 | ||||||||||||||||||
2023 |
$ | 4,358,935 | ($ | 1,035,474 | ) | $ | 1,706,159 | $ | 41,327 | $ | 954,364 | $ | 6,025,311 | $ | 50,981 | $ | 0 | $ | 50,981 | |||||||||||||||||
2022 |
$ | 6,659,592 | ($ | 762,402 | ) | $ | 1,439,060 | ($ | 11,723 | ) | $ | 825,696 | $ | 8,150,222 | $ | 187,567 | $ | 0 | $ | 187,567 | ||||||||||||||||
2021 |
$ | 2,484,647 | ($ | 1,586,659 | ) | $ | 771,874 | $ | 8,166 | $ | 1,082,103 | $ | 2,760,131 | $ | 126,293 | $ | 167,212 | $ | 293,505 | |||||||||||||||||
Note 1.
Non-CEO
NEOs for each year are presented as follows: • |
2022 – 2025: Pascal Desroches, Lori Lee, David McAtee, and Jeff McElfresh |
• |
2021: Pascal Desroches, Lori Lee, David McAtee, Jeff McElfresh, John Stephens, and Randall Stephenson |
Compensation Actually Paid (CAP) calculations are as
follows
: CEO SCT Total to CAP Reconciliation |
||||||||||||||||||||||||
Year |
Summary Compensation Table Total |
Deductions from SCT Total for Equity Awards |
Deductions from SCT Total for Pension Benefits |
Additions to SCT Total for Equity Awards 1 |
Additions to SCT Total for Pension Service Costs 1,2 |
CAP |
||||||||||||||||||
2025 |
$ | 29,906,872 | $ | 19,500,012 | $ | 1,496,923 | $ | 34,129,081 | ($ | 210 | ) | $ | 43,038,808 | |||||||||||
2024 |
$ | 26,410,845 | $ | 16,499,998 | $ | 1,203,091 | $ | 35,833,627 | $ | 1,159 | $ | 44,542,542 | ||||||||||||
2023 |
$ | 26,450,157 | $ | 16,500,000 | $ | 746,941 | $ | 14,669,708 | ($ | 217 | ) | $ | 23,872,707 | |||||||||||
2022 |
$ | 22,915,526 | $ | 13,499,988 | $ | 1,262,050 | $ | 14,718,993 | $ | 2,215 | $ | 22,874,696 | ||||||||||||
2021 |
$ | 24,820,879 | $ | 13,420,341 | $ | 1,464,778 | $ | 10,877,758 | ($ | 61,630 | ) | $ | 20,751,888 | |||||||||||
Note 1.
Equity |
Pension |
|||||||||||||||||||||||||||||||||||
Year |
Year End Fair Value of Equity Awards Granted in the Year |
Year over Year Change in Fair Value of Outstanding Unvested Equity Awards Granted in Prior Years |
Fair Value as of Vesting Date of Equity Awards Granted and Vested in the Year |
Year over Year Change in Fair Value of Equity Awards Granted in Prior Years that Vested in the Year |
Value of Dividends or other Earnings Paid on Equity Awards not Otherwise Reflected in Fair Value or Total Compensation |
Total Equity Award Adjustments |
Service Cost |
Prior Service Cost |
Total Service Cost |
|||||||||||||||||||||||||||
2025 |
$ | 21,627,722 | $ | 3,660,767 | $ | 4,875,003 | $ | 1,810,295 | $ | 2,155,294 | $ | 34,129,081 | ($ | 210 | ) | $0 | ($ | 210 | ) | |||||||||||||||||
2024 |
$ | 22,142,092 | $ | 7,426,648 | $ | 4,125,004 | $ | 150,283 | $ | 1,989,600 | $ | 35,833,627 | $ | 1,159 | $0 | $ | 1,159 | |||||||||||||||||||
2023 |
$ | 10,278,799 | ($ | 1,708,660 | ) | $ | 4,125,000 | $ | 311,691 | $ | 1,662,878 | $ | 14,669,708 | ($ | 217 | ) | $0 | ($ | 217 | ) | ||||||||||||||||
2022 |
$ | 11,316,638 | ($ | 1,436,890 | ) | $ | 3,374,991 | ($ | 53,056 | ) | $ | 1,517,311 | $ | 14,718,993 | $ | 2,215 | $0 | $ | 2,215 | |||||||||||||||||
2021 |
$ | 7,783,605 | ($ | 1,978,709 | ) | $ | 3,375,014 | $ | 5,389 | $ | 1,692,459 | $ | 10,877,758 | ($ | 61,630 | ) | $0 | ($ | 61,630 | ) | ||||||||||||||||
Note 2.
Average Non-CEO NEO’s SCT Total to CAP Reconciliation |
||||||||||||||||||||||||
Year |
Summary Compensation Table Total |
Deductions from SCT Total for Equity Awards |
Deductions from SCT Total for Pension Benefits |
Additions to SCT Total for Equity Award 1 |
Additions to SCT Total for Pension Costs 1 |
CAP |
||||||||||||||||||
2025 |
$ | 12,716,814 | $ | 8,025,007 | $ | 309,001 | $ | 14,801,763 | $ | 55,507 | $ | 19,240,076 | ||||||||||||
2024 |
$ | 13,656,225 | $ | 9,406,249 | $ | 197,153 | $ | 19,227,852 | $ | 63,681 | $ | 23,344,356 | ||||||||||||
2023 |
$ | 11,679,630 | $ | 7,156,255 | $ | 145,620 | $ | 6,025,311 | $ | 50,981 | $ | 10,454,047 | ||||||||||||
2022 |
$ | 11,526,718 | $ | 7,468,746 | $ | 528,796 | $ | 8,150,222 | $ | 187,567 | $ | 11,866,965 | ||||||||||||
2021 |
$ | 10,436,274 | $ | 3,979,166 | $ | 785,922 | $ | 2,760,131 | $ | 293,505 | $ | 8,724,822 | ||||||||||||
Note 1.
Non-CEO
NEOs: Equity |
Pension |
|||||||||||||||||||||||||||||||||||
Year |
Year End Fair Value of Equity Awards Granted in the Year |
Year over Year Change in Fair Value of Outstanding Unvested Equity Awards Granted in Prior Years |
Fair Value as of Vesting Date of Equity Awards Granted and Vested in the Year |
Year over Year Change in Fair Value of Equity Awards Granted in Prior Years that Vested in the Year |
Value of Dividends or other Earnings Paid on Equity Awards not Otherwise Reflected in Fair Value or Total Compensation |
Total Equity Award Adjustments |
Service Cost |
Prior Service Cost |
Total Service Cost |
|||||||||||||||||||||||||||
2025 |
$ | 8,777,481 | $ | 1,993,762 | $ | 1,881,252 | $ | 1,001,529 | $ | 1,147,739 | $ | 14,801,763 | $ | 55,507 | $ | 0 | $ | 55,507 | ||||||||||||||||||
2024 |
$ | 11,940,544 | $ | 4,196,645 | $ | 1,851,562 | $ | 176,810 | $ | 1,062,292 | $ | 19,227,852 | $ | 63,681 | $ | 0 | $ | 63,681 | ||||||||||||||||||
2023 |
$ | 4,358,935 | ($ | 1,035,474 | ) | $ | 1,706,159 | $ | 41,327 | $ | 954,364 | $ | 6,025,311 | $ | 50,981 | $ | 0 | $ | 50,981 | |||||||||||||||||
2022 |
$ | 6,659,592 | ($ | 762,402 | ) | $ | 1,439,060 | ($ | 11,723 | ) | $ | 825,696 | $ | 8,150,222 | $ | 187,567 | $ | 0 | $ | 187,567 | ||||||||||||||||
2021 |
$ | 2,484,647 | ($ | 1,586,659 | ) | $ | 771,874 | $ | 8,166 | $ | 1,082,103 | $ | 2,760,131 | $ | 126,293 | $ | 167,212 | $ | 293,505 | |||||||||||||||||
In addition to the tabular disclosure, the following is an unranked list of the most important performance measures that link CAP to Company
performance
. Most Important Performance Measures | ||
Long Term Measures (page 51) |
Compensation Adjusted Earnings Per Share | |
Return on Invested Capital | ||
Total Shareholder Return | ||
Short Term Measures (page 45) |
Free Cash Flow | |
Compensation Adjusted Operating Income | ||