Pay Versus Performance
The following table provides information about the relationship between the compensation paid to Hubbell’s executives and the Company’s financial performance.
| Average Summary Compensation Table Total for Non-PEO Named Executive Officers ($)(1) | Average Compensation Actually Paid to Non-PEO Named Executive Officers ($)(1)(2) | Value
of Initial Fixed $100 Investment Based on:(3) | ||||||||||||||
| Year | Summary Compensation Table Total for PEO ($)(1) | Compensation Actually Paid to PEO ($)(1)(2) | Total Shareholder Return ($) | Peer Group Total Shareholder Return ($)(4) | Net Income Attributable to Hubbell ($ millions)(5) | Adjusted Diluted EPS(5)(6) | ||||||||||
| 2025 | 10,346,752 | 11,636,745 | 2,830,219 | 3,144,443 | 307.70 | 222.79 | 887.1 | 18.21 | ||||||||
| 2024 | 9,321,451 | 23,267,814 | 2,724,290 | 5,336,496 | 286.40 | 167.74 | 777.8 | 16.57 | ||||||||
| 2023 | 9,666,284 | 25,195,604 | 2,755,598 | 4,109,289 | 222.14 | 126.87 | 759.8 | 15.33 | ||||||||
| 2022 | 8,145,111 | 16,337,722 | 2,343,695 | 4,107,995 | 155.99 | 100.61 | 511.3 | 10.62 | ||||||||
| 2021 | 6,088,700 | 12,169,471 | 2,180,790 | 3,924,025 | 135.59 | 123.73 | 365.0 | 8.05 | ||||||||
| (1) | Gerben W. Bakker became Chief Executive Officer, effective October 1, 2020, and is reflected in the tables above and below as Principal Executive Officer (“PEO”) for all years presented. The non-PEO NEOs for 2025 and 2024 were William R. Sperry, Mark E. Mikes, Gregory A. Gumbs, and Katherine A. Lane. The non-PEO NEOs for 2023 were William R. Sperry, Allan J. Connolly, Mark E. Mikes, Katherine A. Lane, and Gregory A. Gumbs. The non-PEO NEOs for 2022 were William R. Sperry, Allan J. Connolly, Peter J. Lau, Katherine A. Lane and Alyssa R. Flynn. The non-PEO NEOs for 2021 were William R. Sperry, Allan J. Connolly, Peter J. Lau and Katherine A. Lane. |
| (2) | Compensation Actually Paid (“CAP”) reflects the exclusions and inclusions for the PEOs and NEOs set forth below. |
| PEO: Gerben W. Bakker | 2025 | 2024 | 2023 | 2022 | 2021 | |||||||
| Summary Compensation Table Total ($) | 10,346,752 | 9,321,451 | 9,666,284 | 8,145,111 | 6,088,700 | |||||||
| Less: | Aggregate grant date fair value of restricted stock and performance shares granted in the applicable year as calculated in accordance with FASB ASC Topic 718 | (5,526,100) | (4,692,033) | (4,249,556) | (3,579,025) | (3,130,670) | ||||||
| Less: | Aggregate grant date fair value of SARs granted in the applicable year as calculated in accordance with FASB ASC Topic 718 | (1,838,754) | (1,464,957) | (1,394,918) | (1,174,988) | (1,025,488) | ||||||
| Plus: | The fair value as of the end of the fiscal year of unvested equity awards granted in that year | 9,883,153 | 10,459,480 | 10,631,950 | 8,505,609 | 6,411,661 | ||||||
| Plus: | The change in fair value during the year of equity awards granted in prior years that remained outstanding and unvested at the end of the year | (353,642) | 8,810,234 | 6,757,770 | 2,784,556 | 3,216,228 | ||||||
| Plus: | The change in fair value during the year through the vesting date of equity awards granted in prior years that vested during that year | (596,019) | 1,026,927 | 3,784,074 | 1,656,459 | 601,582 | ||||||
| Plus: | Dividends or other earnings paid in stock or option awards in the covered fiscal year prior to the vesting date that are not otherwise included in the total compensation for the covered fiscal year | — | — | — | — | — | ||||||
| Plus: | Awards that are granted and vest in the same year, the fair value as of the vesting date | — | — | — | — | — | ||||||
| Less: | Aggregate change in the actuarial present value of accumulated benefit under the retirement plans in which they participate | (278,645) | (193,288) | — | — | — | ||||||
| Less: | Awards granted in any prior fiscal year that fail to meet the applicable vesting conditions during the covered fiscal year, the amount equal to the fair value at the end of the prior fiscal year | — | — | — | — | — | ||||||
| Plus: | Service costs, or the actuarial present value of applicable benefit under all such plans attributable to services rendered during the applicable fiscal year and any prior service costs, where applicable | — | — | — | — | 7,458 | ||||||
| Compensation Actually Paid to PEO ($) | 11,636,745 | 23,267,814 | 25,195,604 | 16,337,722 | 12,169,471 | |||||||
| Non-PEO Named Executive Officers | 2025 | 2024 | 2023 | 2022 | 2021 | |||||||
| Summary Compensation Table Total ($) | 2,830,219 | 2,724,290 | 2,755,598 | 2,343,695 | 2,180,790 | |||||||
| Less: | Aggregate grant date fair value of restricted stock and performance shares granted in the applicable year as calculated in accordance with FASB ASC Topic 718 | (1,120,357) | (1,052,082) | (645,123) | (776,747) | (834,774) | ||||||
| Less: | Aggregate grant date fair value of SARs granted in the applicable year as calculated in accordance with FASB ASC Topic 718 | (456,284) | (350,019) | (307,501) | (254,992) | (273,441) | ||||||
| Plus: | The fair value as of the end of the fiscal year of unvested equity awards granted in that year | 2,100,901 | 2,365,188 | 1,597,127 | 1,845,901 | 1,709,616 | ||||||
| Plus: | The change in fair value during the year of equity awards granted in prior years that remained outstanding and unvested at the end of the year | (69,319) | 1,488,421 | 890,754 | 623,409 | 884,446 | ||||||
| Plus: | The change in fair value during the year through the vesting date of equity awards granted in prior years that vested during that year | (106,199) | 186,795 | 521,081 | 326,729 | 257,388 | ||||||
| Plus: | Dividends or other earnings paid in stock or option awards in the covered fiscal year prior to the vesting date that are not otherwise included in the total compensation for the covered fiscal year | — | — | — | — | — | ||||||
| Plus: | Awards that are granted and vest in the same year, the fair value as of the vesting date | — | — | — | — | — | ||||||
| Less: | Aggregate change in the actuarial present value of accumulated benefit under the retirement plans in which they participate | (34,518) | (26,097) | — | — | — | ||||||
| Less: | Awards granted in any prior fiscal year that fail to meet the applicable vesting conditions during the covered fiscal year, the amount equal to the fair value at the end of the prior fiscal year | — | — | (702,647) | — | — | ||||||
| Plus: | Service costs, or the actuarial present value of applicable benefit under all such plans attributable to services rendered during the applicable fiscal year and any prior service costs, where applicable | — | — | — | — | — | ||||||
| Compensation Actually Paid to Non-PEO Named Executive Officers ($) | 3,144,443 | 5,336,496 | 4,109,289 | 4,107,995 | 3,924,025 | |||||||
| (3) | Dollar values assume $100 was invested for the cumulative period from December 31, 2020 through December 31, 2025, in either the Company or the Peer Group, and reinvestment of the pre-tax value of dividends paid. Historical stock performance is not necessarily indicative of future stock performance. |
| (4) | For purposes of this disclosure, the Peer Group used is the Dow Jones U.S. Electrical Components & Equipment Index. |
| (5) | Net Income Attributable to Hubbell and Adjusted Diluted EPS are calculated as set forth in our Annual Report on Form 10-K for the applicable year. |
| (6) | “Adjusted Diluted EPS” was determined to be the “most important” financial performance metric used to link performance to CAP for 2025. Adjusted Diluted EPS is a non-GAAP financial measure. A reconciliation to the comparable GAAP financial measure can be found in Management’s Discussion and Analysis of Financial Condition and Results of Operations in our Annual Report on Form 10-K for the year ended December 31, 2025, filed with the SEC on February 12, 2026. |
| (1) | Gerben W. Bakker became Chief Executive Officer, effective October 1, 2020, and is reflected in the tables above and below as Principal Executive Officer (“PEO”) for all years presented. The non-PEO NEOs for 2025 and 2024 were William R. Sperry, Mark E. Mikes, Gregory A. Gumbs, and Katherine A. Lane. The non-PEO NEOs for 2023 were William R. Sperry, Allan J. Connolly, Mark E. Mikes, Katherine A. Lane, and Gregory A. Gumbs. The non-PEO NEOs for 2022 were William R. Sperry, Allan J. Connolly, Peter J. Lau, Katherine A. Lane and Alyssa R. Flynn. The non-PEO NEOs for 2021 were William R. Sperry, Allan J. Connolly, Peter J. Lau and Katherine A. Lane. |
| (4) | For purposes of this disclosure, the Peer Group used is the Dow Jones U.S. Electrical Components & Equipment Index. |
| (2) | Compensation Actually Paid (“CAP”) reflects the exclusions and inclusions for the PEOs and NEOs set forth below. |
| PEO: Gerben W. Bakker | 2025 | 2024 | 2023 | 2022 | 2021 | |||||||
| Summary Compensation Table Total ($) | 10,346,752 | 9,321,451 | 9,666,284 | 8,145,111 | 6,088,700 | |||||||
| Less: | Aggregate grant date fair value of restricted stock and performance shares granted in the applicable year as calculated in accordance with FASB ASC Topic 718 | (5,526,100) | (4,692,033) | (4,249,556) | (3,579,025) | (3,130,670) | ||||||
| Less: | Aggregate grant date fair value of SARs granted in the applicable year as calculated in accordance with FASB ASC Topic 718 | (1,838,754) | (1,464,957) | (1,394,918) | (1,174,988) | (1,025,488) | ||||||
| Plus: | The fair value as of the end of the fiscal year of unvested equity awards granted in that year | 9,883,153 | 10,459,480 | 10,631,950 | 8,505,609 | 6,411,661 | ||||||
| Plus: | The change in fair value during the year of equity awards granted in prior years that remained outstanding and unvested at the end of the year | (353,642) | 8,810,234 | 6,757,770 | 2,784,556 | 3,216,228 | ||||||
| Plus: | The change in fair value during the year through the vesting date of equity awards granted in prior years that vested during that year | (596,019) | 1,026,927 | 3,784,074 | 1,656,459 | 601,582 | ||||||
| Plus: | Dividends or other earnings paid in stock or option awards in the covered fiscal year prior to the vesting date that are not otherwise included in the total compensation for the covered fiscal year | — | — | — | — | — | ||||||
| Plus: | Awards that are granted and vest in the same year, the fair value as of the vesting date | — | — | — | — | — | ||||||
| Less: | Aggregate change in the actuarial present value of accumulated benefit under the retirement plans in which they participate | (278,645) | (193,288) | — | — | — | ||||||
| Less: | Awards granted in any prior fiscal year that fail to meet the applicable vesting conditions during the covered fiscal year, the amount equal to the fair value at the end of the prior fiscal year | — | — | — | — | — | ||||||
| Plus: | Service costs, or the actuarial present value of applicable benefit under all such plans attributable to services rendered during the applicable fiscal year and any prior service costs, where applicable | — | — | — | — | 7,458 | ||||||
| Compensation Actually Paid to PEO ($) | 11,636,745 | 23,267,814 | 25,195,604 | 16,337,722 | 12,169,471 | |||||||
| Non-PEO Named Executive Officers | 2025 | 2024 | 2023 | 2022 | 2021 | |||||||
| Summary Compensation Table Total ($) | 2,830,219 | 2,724,290 | 2,755,598 | 2,343,695 | 2,180,790 | |||||||
| Less: | Aggregate grant date fair value of restricted stock and performance shares granted in the applicable year as calculated in accordance with FASB ASC Topic 718 | (1,120,357) | (1,052,082) | (645,123) | (776,747) | (834,774) | ||||||
| Less: | Aggregate grant date fair value of SARs granted in the applicable year as calculated in accordance with FASB ASC Topic 718 | (456,284) | (350,019) | (307,501) | (254,992) | (273,441) | ||||||
| Plus: | The fair value as of the end of the fiscal year of unvested equity awards granted in that year | 2,100,901 | 2,365,188 | 1,597,127 | 1,845,901 | 1,709,616 | ||||||
| Plus: | The change in fair value during the year of equity awards granted in prior years that remained outstanding and unvested at the end of the year | (69,319) | 1,488,421 | 890,754 | 623,409 | 884,446 | ||||||
| Plus: | The change in fair value during the year through the vesting date of equity awards granted in prior years that vested during that year | (106,199) | 186,795 | 521,081 | 326,729 | 257,388 | ||||||
| Plus: | Dividends or other earnings paid in stock or option awards in the covered fiscal year prior to the vesting date that are not otherwise included in the total compensation for the covered fiscal year | — | — | — | — | — | ||||||
| Plus: | Awards that are granted and vest in the same year, the fair value as of the vesting date | — | — | — | — | — | ||||||
| Less: | Aggregate change in the actuarial present value of accumulated benefit under the retirement plans in which they participate | (34,518) | (26,097) | — | — | — | ||||||
| Less: | Awards granted in any prior fiscal year that fail to meet the applicable vesting conditions during the covered fiscal year, the amount equal to the fair value at the end of the prior fiscal year | — | — | (702,647) | — | — | ||||||
| Plus: | Service costs, or the actuarial present value of applicable benefit under all such plans attributable to services rendered during the applicable fiscal year and any prior service costs, where applicable | — | — | — | — | — | ||||||
| Compensation Actually Paid to Non-PEO Named Executive Officers ($) | 3,144,443 | 5,336,496 | 4,109,289 | 4,107,995 | 3,924,025 | |||||||
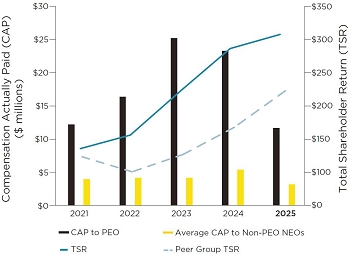
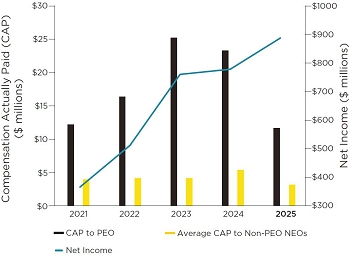
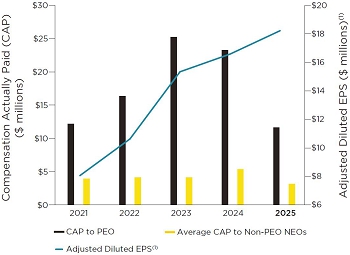
The following is a graphic illustration of the connection between pay and performance:
| Compensation Actually Paid vs. Total Shareholder Return |
Compensation Actually Paid vs. Net Income Attributable to Hubbell | |
 |
 |
| Compensation Actually Paid vs. Adjusted Diluted EPS(1) |
||
 |
The following is a graphic illustration of the connection between pay and performance:
| Compensation Actually Paid vs. Total Shareholder Return |
Compensation Actually Paid vs. Net Income Attributable to Hubbell | |
|
|
| Compensation Actually Paid vs. Adjusted Diluted EPS(1) |
||
|
The following is a graphic illustration of the connection between pay and performance:
| Compensation Actually Paid vs. Total Shareholder Return |
Compensation Actually Paid vs. Net Income Attributable to Hubbell | |
|
|
| Compensation Actually Paid vs. Adjusted Diluted EPS(1) |
||
|
The following is a graphic illustration of the connection between pay and performance:
| Compensation Actually Paid vs. Total Shareholder Return |
Compensation Actually Paid vs. Net Income Attributable to Hubbell | |
|
|
| Compensation Actually Paid vs. Adjusted Diluted EPS(1) |
||
|
Most Important Measures to Determine CAP for the fiscal year ended December 31, 2025
The four measures listed in the table below represent the most important metrics we used to determine CAP for the fiscal year ended December 31, 2025, as further described in the CD&A section beginning on page 36.
| Most Important Measures |
| Adjusted Diluted Earnings Per Share (EPS)(1) |
| Relative Sales Growth |
| Adjusted Operating Profit Margin(1) |
| Relative Total Shareholder Return |
| (1) | Adjusted diluted earnings per share and adjusted operating profit margin are non-GAAP financial measures. A reconciliation to the comparable GAAP financial measures can be found in Management’s Discussion and Analysis of Financial Condition and Results of Operations in our Annual Report on Form 10-K for the year ended December 31, 2025, filed with the SEC on February 12, 2026. |
| (6) | “Adjusted Diluted EPS” was determined to be the “most important” financial performance metric used to link performance to CAP for 2025. Adjusted Diluted EPS is a non-GAAP financial measure. A reconciliation to the comparable GAAP financial measure can be found in Management’s Discussion and Analysis of Financial Condition and Results of Operations in our Annual Report on Form 10-K for the year ended December 31, 2025, filed with the SEC on February 12, 2026. |
| [1] | Gerben W. Bakker became Chief Executive Officer, effective October 1, 2020, and is reflected in the tables above and below as Principal Executive Officer (“PEO”) for all years presented. The non-PEO NEOs for 2025 and 2024 were William R. Sperry, Mark E. Mikes, Gregory A. Gumbs, and Katherine A. Lane. The non-PEO NEOs for 2023 were William R. Sperry, Allan J. Connolly, Mark E. Mikes, Katherine A. Lane, and Gregory A. Gumbs. The non-PEO NEOs for 2022 were William R. Sperry, Allan J. Connolly, Peter J. Lau, Katherine A. Lane and Alyssa R. Flynn. The non-PEO NEOs for 2021 were William R. Sperry, Allan J. Connolly, Peter J. Lau and Katherine A. Lane. |
| [2] | Compensation Actually Paid (“CAP”) reflects the exclusions and inclusions for the PEOs and NEOs set forth below. |
| [3] | Dollar values assume $100 was invested for the cumulative period from December 31, 2020 through December 31, 2025, in either the Company or the Peer Group, and reinvestment of the pre-tax value of dividends paid. Historical stock performance is not necessarily indicative of future stock performance. |
| [4] | For purposes of this disclosure, the Peer Group used is the Dow Jones U.S. Electrical Components & Equipment Index. |
| [5] | Net Income Attributable to Hubbell and Adjusted Diluted EPS are calculated as set forth in our Annual Report on Form 10-K for the applicable year. |
| [6] | “Adjusted Diluted EPS” was determined to be the “most important” financial performance metric used to link performance to CAP for 2025. Adjusted Diluted EPS is a non-GAAP financial measure. A reconciliation to the comparable GAAP financial measure can be found in Management’s Discussion and Analysis of Financial Condition and Results of Operations in our Annual Report on Form 10-K for the year ended December 31, 2025, filed with the SEC on February 12, 2026. |
| [7] | Adjusted diluted earnings per share and adjusted operating profit margin are non-GAAP financial measures. A reconciliation to the comparable GAAP financial measures can be found in Management’s Discussion and Analysis of Financial Condition and Results of Operations in our Annual Report on Form 10-K for the year ended December 31, 2025, filed with the SEC on February 12, 2026. |