Shareholder Report
|
12 Months Ended |
|
Dec. 31, 2025
USD ($)
Holding
|
|---|
| Shareholder Report [Line Items] |
|
|
| Document Type |
N-CSR
|
|
| Amendment Flag |
false
|
|
| Registrant Name |
VanEck Funds
|
|
| Entity Central Index Key |
0000768847
|
|
| Entity Investment Company Type |
N-1A
|
|
| Document Period End Date |
Dec. 31, 2025
|
|
| C000090895 |
|
|
| Shareholder Report [Line Items] |
|
|
| Fund Name |
CM Commodity Index Fund
|
|
| Class Name |
Class A
|
|
| Trading Symbol |
CMCAX
|
|
| Annual or Semi-Annual Statement [Text Block] |
This annual shareholder report contains important information about the CM Commodity Index Fund (the "Fund") for the period January 1, 2025 to December 31, 2025.
|
|
| Shareholder Report Annual or Semi-Annual |
Annual Shareholder Report
|
|
| Additional Information [Text Block] |
You can find additional information about the Fund at https://www.vaneck.com/us/en/etf-mutual-fund-finder/mutual-funds/documents/. You can also request this information by contacting us at 800.826.2333 or info@vaneck.com.
|
|
| Additional Information Phone Number |
800.826.2333
|
|
| Additional Information Email |
<span style="box-sizing: border-box; color: rgb(0, 0, 0); display: inline; flex-wrap: nowrap; font-size: 10.6667px; font-weight: 400; grid-area: auto; line-height: 16px; margin: 0px; overflow: visible; text-align: left; text-align-last: auto; white-space-collapse: preserve-breaks;">info@vaneck.com</span>
|
|
| Additional Information Website |
<span style="box-sizing: border-box; color: rgb(0, 0, 0); display: inline; flex-wrap: nowrap; font-size: 10.6667px; font-weight: 400; grid-area: auto; line-height: 16px; margin: 0px; overflow: visible; text-align: left; text-align-last: auto; white-space-collapse: preserve-breaks;">https://www.vaneck.com/us/en/etf-mutual-fund-finder/mutual-funds/documents/</span>
|
|
| Expenses [Text Block] |
What were the Fund costs for the last year?(based on a hypothetical $10,000 investment) Class Name | Costs of a $10,000 investment | Costs paid as a % of a $10,000 investment |
|---|
Class A | $99 | 0.95% |
|---|
|
|
| Expenses Paid, Amount |
$ 99
|
|
| Expense Ratio, Percent |
0.95%
|
|
| Factors Affecting Performance [Text Block] |
How did the Fund perform last year?The Fund utilized commodity index-linked swaps as an effective means of gaining exposure to the UBS Constant Maturity Commodity Total Return Index. Commodities showed mixed performance with metals standing out on the upside and some energy and agricultural commodities lagging. Inflationary pressures, demand, and geopolitical risks supported prices, while weaker-than-expected economic conditions in China and softer global growth expectations weighed on certain commodity markets at points during the period. Industrial metals and precious metals were the Fund’s largest contributors, particularly copper and aluminum, while gold and silver also contributed meaningfully. Energy and agricultural commodities were the Fund’s largest detractors, as declining oil prices and weakness in key crops reflected ample global supply and favorable growing conditions.
|
|
| Performance Past Does Not Indicate Future [Text] |
The performance data quoted represents past performance. Past performance is no guarantee of future results.
|
|
| Average Annual Return [Table Text Block] |
Average Annual Total Returns . | 1 Year | 5 Years | 10 Years |
|---|
Class A Before Sales Charge | 8.01% | 10.94% | 7.17% |
|---|
Class A After Maximum Sales Charge | 1.80% | 9.64% | 6.54% |
|---|
UBS CM Commodity Index | 9.55% | 12.63% | 8.71% |
|---|
S&P 500 Index | 17.88% | 14.42% | 14.82% |
|---|
The performance data quoted represents past performance. Past performance is no guarantee of future results. Performance information for the Fund may reflect temporary fee waivers, if applicable. These returns do not reflect the deduction of taxes that a shareholder would pay on Fund dividends and distributions or the sale of Fund shares. Visit vaneck.com for more recent performance information. |
|
| No Deduction of Taxes [Text Block] |
|
|
| Performance Table Market Index Changed [Text Block] |
|
|
| Material Change Description [Text Block] |
|
|
| Updated Performance Information Location [Text Block] |
|
|
| AssetsNet |
$ 578,569,238
|
|
| Holdings Count | Holding |
20
|
|
| Advisory Fees Paid, Amount |
$ 2,526,246
|
|
| InvestmentCompanyPortfolioTurnover |
0.00%
|
|
| Additional Fund Statistics [Text Block] |
- Total Net Assets$578,569,238
- Number of Portfolio Holdings20
- Portfolio Turnover Rate-%
- Advisory Fees Paid$2,526,246
|
|
| Additional Fund Statistics Significance or Limits [Text Block] |
|
|
| Holdings [Text Block] |
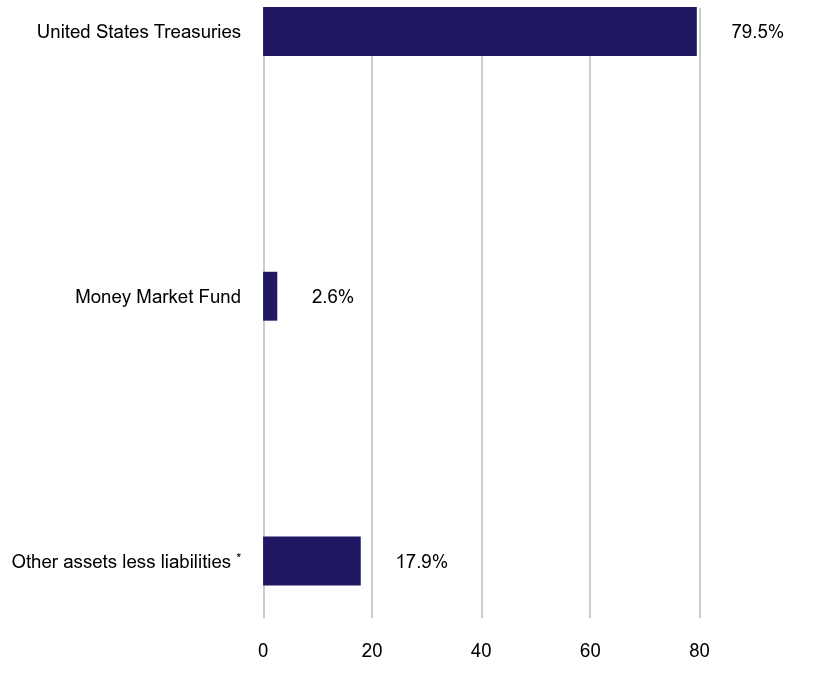
Portfolio Composition (% of Total Net Assets)Value | Value | Value |
|---|
Other assets less liabilitiesFootnote Reference* | | 17.9% | Money Market Fund | | 2.6% | United States Treasuries | | 79.5% |
| Footnote | Description | Footnote* | Includes net unrealized appreciation (depreciation) on total return swap contracts of 0.4% |
|
|
| Exposure Basis Explanation [Text Block] |
Includes net unrealized appreciation (depreciation) on total return swap contracts of 0.4%
|
|
| Material Fund Change [Text Block] |
|
|
| Summary of Change Legend [Text Block] |
|
|
| Updated Prospectus Web Address |
<span style="box-sizing: border-box; color: rgb(0, 0, 0); display: inline; flex-wrap: nowrap; font-size: 10.6667px; font-weight: 400; grid-area: auto; line-height: 16px; margin: 0px; overflow: visible; text-align: left; text-align-last: auto; white-space-collapse: preserve-breaks;">https://www.vaneck.com/us/en/etf-mutual-fund-finder/mutual-funds/documents/</span>
|
|
| C000090897 |
|
|
| Shareholder Report [Line Items] |
|
|
| Fund Name |
CM Commodity Index Fund
|
|
| Class Name |
Class I
|
|
| Trading Symbol |
COMIX
|
|
| Annual or Semi-Annual Statement [Text Block] |
This annual shareholder report contains important information about the CM Commodity Index Fund (the "Fund") for the period January 1, 2025 to December 31, 2025.
|
|
| Shareholder Report Annual or Semi-Annual |
Annual Shareholder Report
|
|
| Additional Information [Text Block] |
You can find additional information about the Fund at https://www.vaneck.com/us/en/etf-mutual-fund-finder/mutual-funds/documents/. You can also request this information by contacting us at 800.826.2333 or info@vaneck.com.
|
|
| Additional Information Phone Number |
800.826.2333
|
|
| Additional Information Email |
<span style="box-sizing: border-box; color: rgb(0, 0, 0); display: inline; flex-wrap: nowrap; font-size: 10.6667px; font-weight: 400; grid-area: auto; line-height: 16px; margin: 0px; overflow: visible; text-align: left; text-align-last: auto; white-space-collapse: preserve-breaks;">info@vaneck.com</span>
|
|
| Additional Information Website |
<span style="box-sizing: border-box; color: rgb(0, 0, 0); display: inline; flex-wrap: nowrap; font-size: 10.6667px; font-weight: 400; grid-area: auto; line-height: 16px; margin: 0px; overflow: visible; text-align: left; text-align-last: auto; white-space-collapse: preserve-breaks;">https://www.vaneck.com/us/en/etf-mutual-fund-finder/mutual-funds/documents/</span>
|
|
| Expenses [Text Block] |
What were the Fund costs for the last year?(based on a hypothetical $10,000 investment) Class Name | Costs of a $10,000 investment | Costs paid as a % of a $10,000 investment |
|---|
Class I | $68 | 0.65% |
|---|
|
|
| Expenses Paid, Amount |
$ 68
|
|
| Expense Ratio, Percent |
0.65%
|
|
| Factors Affecting Performance [Text Block] |
How did the Fund perform last year?The Fund utilized commodity index-linked swaps as an effective means of gaining exposure to the UBS Constant Maturity Commodity Total Return Index. Commodities showed mixed performance with metals standing out on the upside and some energy and agricultural commodities lagging. Inflationary pressures, demand, and geopolitical risks supported prices, while weaker-than-expected economic conditions in China and softer global growth expectations weighed on certain commodity markets at points during the period. Industrial metals and precious metals were the Fund’s largest contributors, particularly copper and aluminum, while gold and silver also contributed meaningfully. Energy and agricultural commodities were the Fund’s largest detractors, as declining oil prices and weakness in key crops reflected ample global supply and favorable growing conditions.
|
|
| Performance Past Does Not Indicate Future [Text] |
The performance data quoted represents past performance. Past performance is no guarantee of future results.
|
|
| Average Annual Return [Table Text Block] |
Average Annual Total Returns . | 1 Year | 5 Years | 10 Years |
|---|
Class I | 8.32% | 11.26% | 7.48% |
|---|
UBS CM Commodity Index | 9.55% | 12.63% | 8.71% |
|---|
S&P 500 Index | 17.88% | 14.42% | 14.82% |
|---|
The performance data quoted represents past performance. Past performance is no guarantee of future results. Performance information for the Fund may reflect temporary fee waivers, if applicable. These returns do not reflect the deduction of taxes that a shareholder would pay on Fund dividends and distributions or the sale of Fund shares. Visit vaneck.com for more recent performance information. |
|
| No Deduction of Taxes [Text Block] |
|
|
| Performance Table Market Index Changed [Text Block] |
|
|
| Material Change Description [Text Block] |
|
|
| Updated Performance Information Location [Text Block] |
|
|
| AssetsNet |
$ 578,569,238
|
|
| Holdings Count | Holding |
20
|
|
| Advisory Fees Paid, Amount |
$ 2,526,246
|
|
| InvestmentCompanyPortfolioTurnover |
0.00%
|
|
| Additional Fund Statistics [Text Block] |
- Total Net Assets$578,569,238
- Number of Portfolio Holdings20
- Portfolio Turnover Rate-%
- Advisory Fees Paid$2,526,246
|
|
| Additional Fund Statistics Significance or Limits [Text Block] |
|
|
| Holdings [Text Block] |
Portfolio Composition (% of Total Net Assets)Value | Value | Value |
|---|
Other assets less liabilitiesFootnote Reference* | | 17.9% | Money Market Fund | | 2.6% | United States Treasuries | | 79.5% |
| Footnote | Description | Footnote* | Includes net unrealized appreciation (depreciation) on total return swap contracts of 0.4% |
|
|
| Exposure Basis Explanation [Text Block] |
Includes net unrealized appreciation (depreciation) on total return swap contracts of 0.4%
|
|
| Material Fund Change [Text Block] |
|
|
| Summary of Change Legend [Text Block] |
|
|
| Updated Prospectus Web Address |
<span style="box-sizing: border-box; color: rgb(0, 0, 0); display: inline; flex-wrap: nowrap; font-size: 10.6667px; font-weight: 400; grid-area: auto; line-height: 16px; margin: 0px; overflow: visible; text-align: left; text-align-last: auto; white-space-collapse: preserve-breaks;">https://www.vaneck.com/us/en/etf-mutual-fund-finder/mutual-funds/documents/</span>
|
|
| C000090898 |
|
|
| Shareholder Report [Line Items] |
|
|
| Fund Name |
CM Commodity Index Fund
|
|
| Class Name |
Class Y
|
|
| Trading Symbol |
CMCYX
|
|
| Annual or Semi-Annual Statement [Text Block] |
This annual shareholder report contains important information about the CM Commodity Index Fund (the "Fund") for the period January 1, 2025 to December 31, 2025.
|
|
| Shareholder Report Annual or Semi-Annual |
Annual Shareholder Report
|
|
| Additional Information [Text Block] |
You can find additional information about the Fund at https://www.vaneck.com/us/en/etf-mutual-fund-finder/mutual-funds/documents/. You can also request this information by contacting us at 800.826.2333 or info@vaneck.com.
|
|
| Additional Information Phone Number |
800.826.2333
|
|
| Additional Information Email |
<span style="box-sizing: border-box; color: rgb(0, 0, 0); display: inline; flex-wrap: nowrap; font-size: 10.6667px; font-weight: 400; grid-area: auto; line-height: 16px; margin: 0px; overflow: visible; text-align: left; text-align-last: auto; white-space-collapse: preserve-breaks;">info@vaneck.com</span>
|
|
| Additional Information Website |
<span style="box-sizing: border-box; color: rgb(0, 0, 0); display: inline; flex-wrap: nowrap; font-size: 10.6667px; font-weight: 400; grid-area: auto; line-height: 16px; margin: 0px; overflow: visible; text-align: left; text-align-last: auto; white-space-collapse: preserve-breaks;">https://www.vaneck.com/us/en/etf-mutual-fund-finder/mutual-funds/documents/</span>
|
|
| Expenses [Text Block] |
What were the Fund costs for the last year?(based on a hypothetical $10,000 investment) Class Name | Costs of a $10,000 investment | Costs paid as a % of a $10,000 investment |
|---|
Class Y | $73 | 0.70% |
|---|
|
|
| Expenses Paid, Amount |
$ 73
|
|
| Expense Ratio, Percent |
0.70%
|
|
| Factors Affecting Performance [Text Block] |
How did the Fund perform last year?The Fund utilized commodity index-linked swaps as an effective means of gaining exposure to the UBS Constant Maturity Commodity Total Return Index. Commodities showed mixed performance with metals standing out on the upside and some energy and agricultural commodities lagging. Inflationary pressures, demand, and geopolitical risks supported prices, while weaker-than-expected economic conditions in China and softer global growth expectations weighed on certain commodity markets at points during the period. Industrial metals and precious metals were the Fund’s largest contributors, particularly copper and aluminum, while gold and silver also contributed meaningfully. Energy and agricultural commodities were the Fund’s largest detractors, as declining oil prices and weakness in key crops reflected ample global supply and favorable growing conditions.
|
|
| Performance Past Does Not Indicate Future [Text] |
The performance data quoted represents past performance. Past performance is no guarantee of future results.
|
|
| Average Annual Return [Table Text Block] |
Average Annual Total Returns . | 1 Year | 5 Years | 10 Years |
|---|
Class Y | 8.28% | 11.22% | 7.42% |
|---|
UBS CM Commodity Index | 9.55% | 12.63% | 8.71% |
|---|
S&P 500 Index | 17.88% | 14.42% | 14.82% |
|---|
The performance data quoted represents past performance. Past performance is no guarantee of future results. Performance information for the Fund may reflect temporary fee waivers, if applicable. These returns do not reflect the deduction of taxes that a shareholder would pay on Fund dividends and distributions or the sale of Fund shares. Visit vaneck.com for more recent performance information. |
|
| No Deduction of Taxes [Text Block] |
|
|
| Performance Table Market Index Changed [Text Block] |
|
|
| Material Change Description [Text Block] |
|
|
| Updated Performance Information Location [Text Block] |
|
|
| AssetsNet |
$ 578,569,238
|
|
| Holdings Count | Holding |
20
|
|
| Advisory Fees Paid, Amount |
$ 2,526,246
|
|
| InvestmentCompanyPortfolioTurnover |
0.00%
|
|
| Additional Fund Statistics [Text Block] |
- Total Net Assets$578,569,238
- Number of Portfolio Holdings20
- Portfolio Turnover Rate-%
- Advisory Fees Paid$2,526,246
|
|
| Additional Fund Statistics Significance or Limits [Text Block] |
|
|
| Holdings [Text Block] |
Portfolio Composition (% of Total Net Assets)Value | Value | Value |
|---|
Other assets less liabilitiesFootnote Reference* | | 17.9% | Money Market Fund | | 2.6% | United States Treasuries | | 79.5% |
| Footnote | Description | Footnote* | Includes net unrealized appreciation (depreciation) on total return swap contracts of 0.4% |
|
|
| Exposure Basis Explanation [Text Block] |
Includes net unrealized appreciation (depreciation) on total return swap contracts of 0.4%
|
|
| Material Fund Change [Text Block] |
|
|
| Summary of Change Legend [Text Block] |
|
|
| Updated Prospectus Web Address |
<span style="box-sizing: border-box; color: rgb(0, 0, 0); display: inline; flex-wrap: nowrap; font-size: 10.6667px; font-weight: 400; grid-area: auto; line-height: 16px; margin: 0px; overflow: visible; text-align: left; text-align-last: auto; white-space-collapse: preserve-breaks;">https://www.vaneck.com/us/en/etf-mutual-fund-finder/mutual-funds/documents/</span>
|
|
| C000024992 |
|
|
| Shareholder Report [Line Items] |
|
|
| Fund Name |
Emerging Markets Fund
|
|
| Class Name |
Class A
|
|
| Trading Symbol |
GBFAX
|
|
| Annual or Semi-Annual Statement [Text Block] |
This annual shareholder report contains important information about the Emerging Markets Fund (the "Fund") for the period January 1, 2025 to December 31, 2025.
|
|
| Shareholder Report Annual or Semi-Annual |
Annual Shareholder Report
|
|
| Additional Information [Text Block] |
You can find additional information about the Fund at https://www.vaneck.com/us/en/etf-mutual-fund-finder/mutual-funds/documents/. You can also request this information by contacting us at 800.826.2333 or info@vaneck.com.
|
|
| Material Fund Change Notice [Text Block] |
This report describes material changes to the Fund that occurred during the reporting period.
|
|
| Additional Information Phone Number |
800.826.2333
|
|
| Additional Information Email |
<span style="box-sizing: border-box; color: rgb(0, 0, 0); display: inline; flex-wrap: nowrap; font-size: 10.6667px; font-weight: 400; grid-area: auto; line-height: 16px; margin: 0px; overflow: visible; text-align: left; text-align-last: auto; white-space-collapse: preserve-breaks;">info@vaneck.com</span>
|
|
| Additional Information Website |
<span style="box-sizing: border-box; color: rgb(0, 0, 0); display: inline; flex-wrap: nowrap; font-size: 10.6667px; font-weight: 400; grid-area: auto; line-height: 16px; margin: 0px; overflow: visible; text-align: left; text-align-last: auto; white-space-collapse: preserve-breaks;">https://www.vaneck.com/us/en/etf-mutual-fund-finder/mutual-funds/documents/</span>
|
|
| Expenses [Text Block] |
What were the Fund costs for the last year?(based on a hypothetical $10,000 investment) Class Name | Costs of a $10,000 investment | Costs paid as a % of a $10,000 investment |
|---|
Class A | $185 | 1.61% |
|---|
|
|
| Expenses Paid, Amount |
$ 185
|
|
| Expense Ratio, Percent |
1.61%
|
|
| Factors Affecting Performance [Text Block] |
How did the Fund perform last year?Emerging market equities delivered strong performance in 2025, outperforming U.S. and global equities as moderating inflation, supportive policy shifts, a weaker U.S. dollar, and accelerating structural growth drivers underpinned a broad, durable recovery. Relative to its benchmark, the MSCI Emerging Markets Investable Markets Index, during the period the Fund underperformed primarily due to stock selection within China. From a country perspective, South Korea contributed the most to the Fund’s performance during the period, followed by Taiwan and Brazil. Turkey detracted the most from the Fund’s performance during the period, followed by Kazakhstan and Argentina. From a sector perspective, information technology contributed the most to the Fund’s performance during the period, followed by financials and consumer discretionary. Real estate was the only detracting sector. The leading individual contributors to performance were SK hynix, Inc., Taiwan Semiconductor Manufacturing Co. Ltd. and Lion Finance Group PLC. The leading individual detractors from performance were Oberoi Realty Ltd., Sterling And Wilson Renewable Energy Ltd. and MLP Saglik Hizmetleri AS.
|
|
| Performance Past Does Not Indicate Future [Text] |
The performance data quoted represents past performance. Past performance is no guarantee of future results.
|
|
| Average Annual Return [Table Text Block] |
Average Annual Total Returns . | 1 Year | 5 Years | 10 Years |
|---|
Class A Before Sales Charge | 30.26% | (1.15)% | 4.99% |
|---|
Class A After Maximum Sales Charge | 22.77% | (2.31)% | 4.37% |
|---|
MSCI Emerging Markets IMI Index | 31.38% | 4.66% | 8.37% |
|---|
The performance data quoted represents past performance. Past performance is no guarantee of future results. Performance information for the Fund may reflect temporary fee waivers, if applicable. These returns do not reflect the deduction of taxes that a shareholder would pay on Fund dividends and distributions or the sale of Fund shares. Visit vaneck.com for more recent performance information. |
|
| No Deduction of Taxes [Text Block] |
|
|
| Performance Table Market Index Changed [Text Block] |
|
|
| Material Change Description [Text Block] |
|
|
| Material Change Date |
Dec. 31, 2025
|
|
| Updated Performance Information Location [Text Block] |
|
|
| AssetsNet |
$ 320,774,046
|
|
| Holdings Count | Holding |
75
|
|
| Advisory Fees Paid, Amount |
$ 2,065,074
|
|
| InvestmentCompanyPortfolioTurnover |
29.00%
|
|
| Additional Fund Statistics [Text Block] |
- Total Net Assets$320,774,046
- Number of Portfolio Holdings75
- Portfolio Turnover Rate29%
- Advisory Fees Paid$2,065,074
|
|
| Additional Fund Statistics Significance or Limits [Text Block] |
|
|
| Holdings [Text Block] |
Portfolio Composition (% of Total Net Assets)Value | Value | Value |
|---|
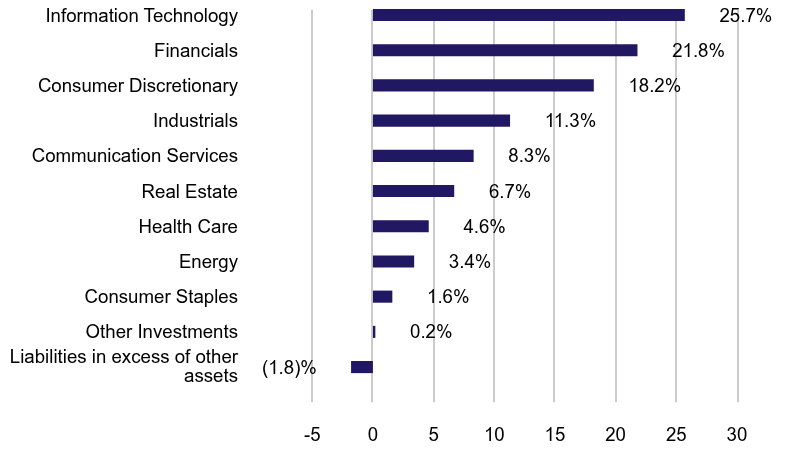
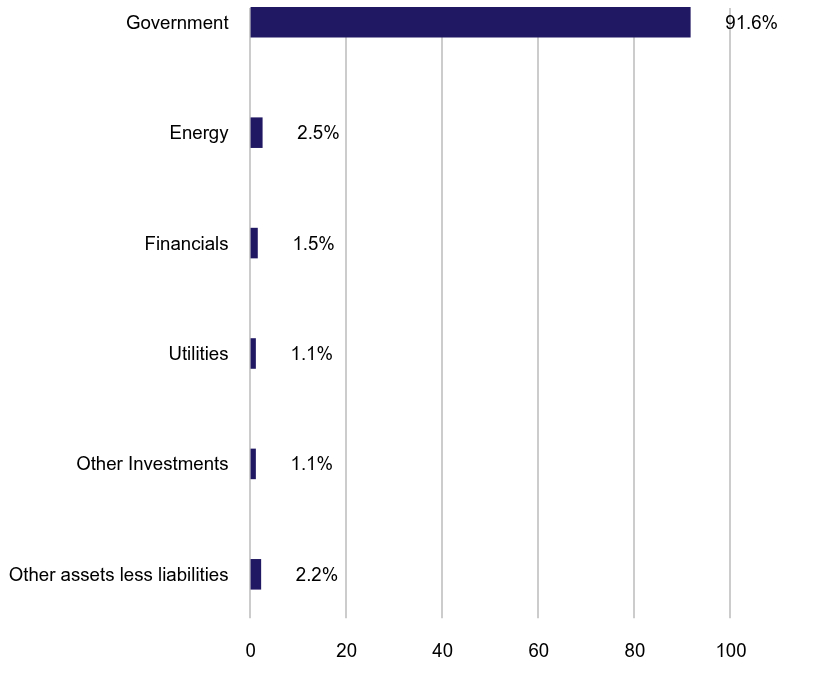
Liabilities in excess of other assets | | (1.8)% | Other Investments | | 0.2% | Consumer Staples | | 1.6% | Energy | | 3.4% | Health Care | | 4.6% | Real Estate | | 6.7% | Communication Services | | 8.3% | Industrials | | 11.3% | Consumer Discretionary | | 18.2% | Financials | | 21.8% | Information Technology | | 25.7% |
|
|
| Largest Holdings [Text Block] |
Top Ten Holdings (% of Total Net Assets)Taiwan Semiconductor Manufacturing Co. Ltd. | | 10.9% |
|---|
SK Hynix, Inc. | | 6.4% |
|---|
Tencent Holdings Ltd. | | 4.2% |
|---|
Samsung Electronics Co. Ltd. | | 3.8% |
|---|
Alibaba Group Holding Ltd. | | 3.1% |
|---|
Reliance Industries Ltd. | | 2.9% |
|---|
Chroma ATE, Inc. | | 2.5% |
|---|
Prosus NV | | 1.9% |
|---|
HDFC Bank Ltd. | | 1.9% |
|---|
International Container Terminal Services, Inc. | | 1.8% |
|---|
|
|
| Material Fund Change [Text Block] |
The following material fund change occurred during the period ended December 31, 2025: Effective April 30, 2025, the Class C shares of VanEck Emerging Markets Fund were converted into Class A shares of the Fund and Class C shares of the Fund were terminated effective immediately after such conversion. |
|
| Summary of Change Legend [Text Block] |
The following material fund change occurred during the period ended December 31, 2025:
|
|
| Updated Prospectus Web Address |
<span style="box-sizing: border-box; color: rgb(0, 0, 0); display: inline; flex-wrap: nowrap; font-size: 10.6667px; font-weight: 400; grid-area: auto; line-height: 16px; margin: 0px; overflow: visible; text-align: left; text-align-last: auto; white-space-collapse: preserve-breaks;">https://www.vaneck.com/us/en/etf-mutual-fund-finder/mutual-funds/documents/</span>
|
|
| C000033045 |
|
|
| Shareholder Report [Line Items] |
|
|
| Fund Name |
Emerging Markets Fund
|
|
| Class Name |
Class I
|
|
| Trading Symbol |
EMRIX
|
|
| Annual or Semi-Annual Statement [Text Block] |
This annual shareholder report contains important information about the Emerging Markets Fund (the "Fund") for the period January 1, 2025 to December 31, 2025.
|
|
| Shareholder Report Annual or Semi-Annual |
Annual Shareholder Report
|
|
| Additional Information [Text Block] |
You can find additional information about the Fund at https://www.vaneck.com/us/en/etf-mutual-fund-finder/mutual-funds/documents/. You can also request this information by contacting us at 800.826.2333 or info@vaneck.com.
|
|
| Material Fund Change Notice [Text Block] |
This report describes material changes to the Fund that occurred during the reporting period.
|
|
| Additional Information Phone Number |
800.826.2333
|
|
| Additional Information Email |
<span style="box-sizing: border-box; color: rgb(0, 0, 0); display: inline; flex-wrap: nowrap; font-size: 10.6667px; font-weight: 400; grid-area: auto; line-height: 16px; margin: 0px; overflow: visible; text-align: left; text-align-last: auto; white-space-collapse: preserve-breaks;">info@vaneck.com</span>
|
|
| Additional Information Website |
<span style="box-sizing: border-box; color: rgb(0, 0, 0); display: inline; flex-wrap: nowrap; font-size: 10.6667px; font-weight: 400; grid-area: auto; line-height: 16px; margin: 0px; overflow: visible; text-align: left; text-align-last: auto; white-space-collapse: preserve-breaks;">https://www.vaneck.com/us/en/etf-mutual-fund-finder/mutual-funds/documents/</span>
|
|
| Expenses [Text Block] |
What were the Fund costs for the last year?(based on a hypothetical $10,000 investment) Class Name | Costs of a $10,000 investment | Costs paid as a % of a $10,000 investment |
|---|
Class I | $116 | 1.01% |
|---|
|
|
| Expenses Paid, Amount |
$ 116
|
|
| Expense Ratio, Percent |
1.01%
|
|
| Factors Affecting Performance [Text Block] |
How did the Fund perform last year?Emerging market equities delivered strong performance in 2025, outperforming U.S. and global equities as moderating inflation, supportive policy shifts, a weaker U.S. dollar, and accelerating structural growth drivers underpinned a broad, durable recovery. Relative to its benchmark, the MSCI Emerging Markets Investable Markets Index, during the period the Fund underperformed primarily due to stock selection within China. From a country perspective, South Korea contributed the most to the Fund’s performance during the period, followed by Taiwan and Brazil. Turkey detracted the most from the Fund’s performance during the period, followed by Kazakhstan and Argentina. From a sector perspective, information technology contributed the most to the Fund’s performance during the period, followed by financials and consumer discretionary. Real estate was the only detracting sector. The leading individual contributors to performance were SK hynix, Inc., Taiwan Semiconductor Manufacturing Co. Ltd. and Lion Finance Group PLC. The leading individual detractors from performance were Oberoi Realty Ltd., Sterling And Wilson Renewable Energy Ltd. and MLP Saglik Hizmetleri AS.
|
|
| Performance Past Does Not Indicate Future [Text] |
The performance data quoted represents past performance. Past performance is no guarantee of future results.
|
|
| Average Annual Return [Table Text Block] |
Average Annual Total Returns . | 1 Year | 5 Years | 10 Years |
|---|
Class I | 31.00% | (0.61)% | 5.53% |
|---|
MSCI Emerging Markets IMI Index | 31.38% | 4.66% | 8.37% |
|---|
The performance data quoted represents past performance. Past performance is no guarantee of future results. Performance information for the Fund may reflect temporary fee waivers, if applicable. These returns do not reflect the deduction of taxes that a shareholder would pay on Fund dividends and distributions or the sale of Fund shares. Visit vaneck.com for more recent performance information. |
|
| No Deduction of Taxes [Text Block] |
|
|
| Performance Table Market Index Changed [Text Block] |
|
|
| Material Change Description [Text Block] |
|
|
| Material Change Date |
Dec. 31, 2025
|
|
| Updated Performance Information Location [Text Block] |
|
|
| AssetsNet |
$ 320,774,046
|
|
| Holdings Count | Holding |
75
|
|
| Advisory Fees Paid, Amount |
$ 2,065,074
|
|
| InvestmentCompanyPortfolioTurnover |
29.00%
|
|
| Additional Fund Statistics [Text Block] |
- Total Net Assets$320,774,046
- Number of Portfolio Holdings75
- Portfolio Turnover Rate29%
- Advisory Fees Paid$2,065,074
|
|
| Additional Fund Statistics Significance or Limits [Text Block] |
|
|
| Holdings [Text Block] |
Portfolio Composition (% of Total Net Assets)Value | Value | Value |
|---|
Liabilities in excess of other assets | | (1.8)% | Other Investments | | 0.2% | Consumer Staples | | 1.6% | Energy | | 3.4% | Health Care | | 4.6% | Real Estate | | 6.7% | Communication Services | | 8.3% | Industrials | | 11.3% | Consumer Discretionary | | 18.2% | Financials | | 21.8% | Information Technology | | 25.7% |
|
|
| Largest Holdings [Text Block] |
Top Ten Holdings (% of Total Net Assets)Taiwan Semiconductor Manufacturing Co. Ltd. | | 10.9% |
|---|
SK Hynix, Inc. | | 6.4% |
|---|
Tencent Holdings Ltd. | | 4.2% |
|---|
Samsung Electronics Co. Ltd. | | 3.8% |
|---|
Alibaba Group Holding Ltd. | | 3.1% |
|---|
Reliance Industries Ltd. | | 2.9% |
|---|
Chroma ATE, Inc. | | 2.5% |
|---|
Prosus NV | | 1.9% |
|---|
HDFC Bank Ltd. | | 1.9% |
|---|
International Container Terminal Services, Inc. | | 1.8% |
|---|
|
|
| Material Fund Change [Text Block] |
The following material fund change occurred during the period ended December 31, 2025: Effective April 30, 2025, the Class C shares of VanEck Emerging Markets Fund were converted into Class A shares of the Fund and Class C shares of the Fund were terminated effective immediately after such conversion. |
|
| Summary of Change Legend [Text Block] |
The following material fund change occurred during the period ended December 31, 2025:
|
|
| Updated Prospectus Web Address |
<span style="box-sizing: border-box; color: rgb(0, 0, 0); display: inline; flex-wrap: nowrap; font-size: 10.6667px; font-weight: 400; grid-area: auto; line-height: 16px; margin: 0px; overflow: visible; text-align: left; text-align-last: auto; white-space-collapse: preserve-breaks;">https://www.vaneck.com/us/en/etf-mutual-fund-finder/mutual-funds/documents/</span>
|
|
| C000088110 |
|
|
| Shareholder Report [Line Items] |
|
|
| Fund Name |
Emerging Markets Fund
|
|
| Class Name |
Class Y
|
|
| Trading Symbol |
EMRYX
|
|
| Annual or Semi-Annual Statement [Text Block] |
This annual shareholder report contains important information about the Emerging Markets Fund (the "Fund") for the period January 1, 2025 to December 31, 2025.
|
|
| Shareholder Report Annual or Semi-Annual |
Annual Shareholder Report
|
|
| Additional Information [Text Block] |
You can find additional information about the Fund at https://www.vaneck.com/us/en/etf-mutual-fund-finder/mutual-funds/documents/. You can also request this information by contacting us at 800.826.2333 or info@vaneck.com.
|
|
| Material Fund Change Notice [Text Block] |
This report describes material changes to the Fund that occurred during the reporting period.
|
|
| Additional Information Phone Number |
800.826.2333
|
|
| Additional Information Email |
<span style="box-sizing: border-box; color: rgb(0, 0, 0); display: inline; flex-wrap: nowrap; font-size: 10.6667px; font-weight: 400; grid-area: auto; line-height: 16px; margin: 0px; overflow: visible; text-align: left; text-align-last: auto; white-space-collapse: preserve-breaks;">info@vaneck.com</span>
|
|
| Additional Information Website |
<span style="box-sizing: border-box; color: rgb(0, 0, 0); display: inline; flex-wrap: nowrap; font-size: 10.6667px; font-weight: 400; grid-area: auto; line-height: 16px; margin: 0px; overflow: visible; text-align: left; text-align-last: auto; white-space-collapse: preserve-breaks;">https://www.vaneck.com/us/en/etf-mutual-fund-finder/mutual-funds/documents/</span>
|
|
| Expenses [Text Block] |
What were the Fund costs for the last year?(based on a hypothetical $10,000 investment) Class Name | Costs of a $10,000 investment | Costs paid as a % of a $10,000 investment |
|---|
Class Y | $128 | 1.11% |
|---|
|
|
| Expenses Paid, Amount |
$ 128
|
|
| Expense Ratio, Percent |
1.11%
|
|
| Factors Affecting Performance [Text Block] |
How did the Fund perform last year?Emerging market equities delivered strong performance in 2025, outperforming U.S. and global equities as moderating inflation, supportive policy shifts, a weaker U.S. dollar, and accelerating structural growth drivers underpinned a broad, durable recovery. Relative to its benchmark, the MSCI Emerging Markets Investable Markets Index, during the period the Fund underperformed primarily due to stock selection within China. From a country perspective, South Korea contributed the most to the Fund’s performance during the period, followed by Taiwan and Brazil. Turkey detracted the most from the Fund’s performance during the period, followed by Kazakhstan and Argentina. From a sector perspective, information technology contributed the most to the Fund’s performance during the period, followed by financials and consumer discretionary. Real estate was the only detracting sector. The leading individual contributors to performance were SK hynix, Inc., Taiwan Semiconductor Manufacturing Co. Ltd. and Lion Finance Group PLC. The leading individual detractors from performance were Oberoi Realty Ltd., Sterling And Wilson Renewable Energy Ltd. and MLP Saglik Hizmetleri AS.
|
|
| Performance Past Does Not Indicate Future [Text] |
The performance data quoted represents past performance. Past performance is no guarantee of future results.
|
|
| Average Annual Return [Table Text Block] |
Average Annual Total Returns . | 1 Year | 5 Years | 10 Years |
|---|
Class Y | 30.93% | (0.71)% | 5.43% |
|---|
MSCI Emerging Markets IMI Index | 31.38% | 4.66% | 8.37% |
|---|
The performance data quoted represents past performance. Past performance is no guarantee of future results. Performance information for the Fund may reflect temporary fee waivers, if applicable. These returns do not reflect the deduction of taxes that a shareholder would pay on Fund dividends and distributions or the sale of Fund shares. Visit vaneck.com for more recent performance information. |
|
| No Deduction of Taxes [Text Block] |
|
|
| Performance Table Market Index Changed [Text Block] |
|
|
| Material Change Description [Text Block] |
|
|
| Material Change Date |
Dec. 31, 2025
|
|
| Updated Performance Information Location [Text Block] |
|
|
| AssetsNet |
$ 320,774,046
|
|
| Holdings Count | Holding |
75
|
|
| Advisory Fees Paid, Amount |
$ 2,065,074
|
|
| InvestmentCompanyPortfolioTurnover |
29.00%
|
|
| Additional Fund Statistics [Text Block] |
- Total Net Assets$320,774,046
- Number of Portfolio Holdings75
- Portfolio Turnover Rate29%
- Advisory Fees Paid$2,065,074
|
|
| Additional Fund Statistics Significance or Limits [Text Block] |
|
|
| Holdings [Text Block] |
Portfolio Composition (% of Total Net Assets)Value | Value | Value |
|---|
Liabilities in excess of other assets | | (1.8)% | Other Investments | | 0.2% | Consumer Staples | | 1.6% | Energy | | 3.4% | Health Care | | 4.6% | Real Estate | | 6.7% | Communication Services | | 8.3% | Industrials | | 11.3% | Consumer Discretionary | | 18.2% | Financials | | 21.8% | Information Technology | | 25.7% |
|
|
| Largest Holdings [Text Block] |
Top Ten Holdings (% of Total Net Assets)Taiwan Semiconductor Manufacturing Co. Ltd. | | 10.9% |
|---|
SK Hynix, Inc. | | 6.4% |
|---|
Tencent Holdings Ltd. | | 4.2% |
|---|
Samsung Electronics Co. Ltd. | | 3.8% |
|---|
Alibaba Group Holding Ltd. | | 3.1% |
|---|
Reliance Industries Ltd. | | 2.9% |
|---|
Chroma ATE, Inc. | | 2.5% |
|---|
Prosus NV | | 1.9% |
|---|
HDFC Bank Ltd. | | 1.9% |
|---|
International Container Terminal Services, Inc. | | 1.8% |
|---|
|
|
| Material Fund Change [Text Block] |
The following material fund change occurred during the period ended December 31, 2025: Effective April 30, 2025, the Class C shares of VanEck Emerging Markets Fund were converted into Class A shares of the Fund and Class C shares of the Fund were terminated effective immediately after such conversion. |
|
| Summary of Change Legend [Text Block] |
The following material fund change occurred during the period ended December 31, 2025:
|
|
| Updated Prospectus Web Address |
<span style="box-sizing: border-box; color: rgb(0, 0, 0); display: inline; flex-wrap: nowrap; font-size: 10.6667px; font-weight: 400; grid-area: auto; line-height: 16px; margin: 0px; overflow: visible; text-align: left; text-align-last: auto; white-space-collapse: preserve-breaks;">https://www.vaneck.com/us/en/etf-mutual-fund-finder/mutual-funds/documents/</span>
|
|
| C000214759 |
|
|
| Shareholder Report [Line Items] |
|
|
| Fund Name |
Emerging Markets Fund
|
|
| Class Name |
Class Z
|
|
| Trading Symbol |
EMRZX
|
|
| Annual or Semi-Annual Statement [Text Block] |
This annual shareholder report contains important information about the Emerging Markets Fund (the "Fund") for the period January 1, 2025 to December 31, 2025.
|
|
| Shareholder Report Annual or Semi-Annual |
Annual Shareholder Report
|
|
| Additional Information [Text Block] |
You can find additional information about the Fund at https://www.vaneck.com/us/en/etf-mutual-fund-finder/mutual-funds/documents/. You can also request this information by contacting us at 800.826.2333 or info@vaneck.com.
|
|
| Material Fund Change Notice [Text Block] |
This report describes material changes to the Fund that occurred during the reporting period.
|
|
| Additional Information Phone Number |
800.826.2333
|
|
| Additional Information Email |
<span style="box-sizing: border-box; color: rgb(0, 0, 0); display: inline; flex-wrap: nowrap; font-size: 10.6667px; font-weight: 400; grid-area: auto; line-height: 16px; margin: 0px; overflow: visible; text-align: left; text-align-last: auto; white-space-collapse: preserve-breaks;">info@vaneck.com</span>
|
|
| Additional Information Website |
<span style="box-sizing: border-box; color: rgb(0, 0, 0); display: inline; flex-wrap: nowrap; font-size: 10.6667px; font-weight: 400; grid-area: auto; line-height: 16px; margin: 0px; overflow: visible; text-align: left; text-align-last: auto; white-space-collapse: preserve-breaks;">https://www.vaneck.com/us/en/etf-mutual-fund-finder/mutual-funds/documents/</span>
|
|
| Expenses [Text Block] |
What were the Fund costs for the last year?(based on a hypothetical $10,000 investment) Class Name | Costs of a $10,000 investment | Costs paid as a % of a $10,000 investment |
|---|
Class Z | $105 | 0.91% |
|---|
|
|
| Expenses Paid, Amount |
$ 105
|
|
| Expense Ratio, Percent |
0.91%
|
|
| Factors Affecting Performance [Text Block] |
How did the Fund perform last year?Emerging market equities delivered strong performance in 2025, outperforming U.S. and global equities as moderating inflation, supportive policy shifts, a weaker U.S. dollar, and accelerating structural growth drivers underpinned a broad, durable recovery. Relative to its benchmark, the MSCI Emerging Markets Investable Markets Index, during the period the Fund underperformed primarily due to stock selection within China. From a country perspective, South Korea contributed the most to the Fund’s performance during the period, followed by Taiwan and Brazil. Turkey detracted the most from the Fund’s performance during the period, followed by Kazakhstan and Argentina. From a sector perspective, information technology contributed the most to the Fund’s performance during the period, followed by financials and consumer discretionary. Real estate was the only detracting sector. The leading individual contributors to performance were SK hynix, Inc., Taiwan Semiconductor Manufacturing Co. Ltd. and Lion Finance Group PLC. The leading individual detractors from performance were Oberoi Realty Ltd., Sterling And Wilson Renewable Energy Ltd. and MLP Saglik Hizmetleri AS.
|
|
| Performance Past Does Not Indicate Future [Text] |
The performance data quoted represents past performance. Past performance is no guarantee of future results.
|
|
| Average Annual Return [Table Text Block] |
Average Annual Total Returns . | 1 Year | 5 Years | Life* |
|---|
Class Z | 31.05% | (0.52)% | 3.26% |
|---|
MSCI Emerging Markets IMI Index | 31.38% | 4.66% | 7.98% |
|---|
* Inception of Fund: 09/16/2019. The performance data quoted represents past performance. Past performance is no guarantee of future results. Performance information for the Fund may reflect temporary fee waivers, if applicable. These returns do not reflect the deduction of taxes that a shareholder would pay on Fund dividends and distributions or the sale of Fund shares. Visit vaneck.com for more recent performance information. |
|
| Performance Inception Date |
Sep. 16, 2019
|
|
| No Deduction of Taxes [Text Block] |
|
|
| Performance Table Market Index Changed [Text Block] |
|
|
| Material Change Description [Text Block] |
|
|
| Material Change Date |
Dec. 31, 2025
|
|
| Updated Performance Information Location [Text Block] |
|
|
| AssetsNet |
$ 320,774,046
|
|
| Holdings Count | Holding |
75
|
|
| Advisory Fees Paid, Amount |
$ 2,065,074
|
|
| InvestmentCompanyPortfolioTurnover |
29.00%
|
|
| Additional Fund Statistics [Text Block] |
- Total Net Assets$320,774,046
- Number of Portfolio Holdings75
- Portfolio Turnover Rate29%
- Advisory Fees Paid$2,065,074
|
|
| Additional Fund Statistics Significance or Limits [Text Block] |
|
|
| Holdings [Text Block] |
Portfolio Composition (% of Total Net Assets)Value | Value | Value |
|---|
Liabilities in excess of other assets | | (1.8)% | Other Investments | | 0.2% | Consumer Staples | | 1.6% | Energy | | 3.4% | Health Care | | 4.6% | Real Estate | | 6.7% | Communication Services | | 8.3% | Industrials | | 11.3% | Consumer Discretionary | | 18.2% | Financials | | 21.8% | Information Technology | | 25.7% |
|
|
| Largest Holdings [Text Block] |
Top Ten Holdings (% of Total Net Assets)Taiwan Semiconductor Manufacturing Co. Ltd. | | 10.9% |
|---|
SK Hynix, Inc. | | 6.4% |
|---|
Tencent Holdings Ltd. | | 4.2% |
|---|
Samsung Electronics Co. Ltd. | | 3.8% |
|---|
Alibaba Group Holding Ltd. | | 3.1% |
|---|
Reliance Industries Ltd. | | 2.9% |
|---|
Chroma ATE, Inc. | | 2.5% |
|---|
Prosus NV | | 1.9% |
|---|
HDFC Bank Ltd. | | 1.9% |
|---|
International Container Terminal Services, Inc. | | 1.8% |
|---|
|
|
| Material Fund Change [Text Block] |
The following material fund change occurred during the period ended December 31, 2025: Effective April 30, 2025, the Class C shares of VanEck Emerging Markets Fund were converted into Class A shares of the Fund and Class C shares of the Fund were terminated effective immediately after such conversion. |
|
| Summary of Change Legend [Text Block] |
The following material fund change occurred during the period ended December 31, 2025:
|
|
| Updated Prospectus Web Address |
<span style="box-sizing: border-box; color: rgb(0, 0, 0); display: inline; flex-wrap: nowrap; font-size: 10.6667px; font-weight: 400; grid-area: auto; line-height: 16px; margin: 0px; overflow: visible; text-align: left; text-align-last: auto; white-space-collapse: preserve-breaks;">https://www.vaneck.com/us/en/etf-mutual-fund-finder/mutual-funds/documents/</span>
|
|
| C000024996 |
|
|
| Shareholder Report [Line Items] |
|
|
| Fund Name |
Global Resources Fund
|
|
| Class Name |
Class A
|
|
| Trading Symbol |
GHAAX
|
|
| Annual or Semi-Annual Statement [Text Block] |
This annual shareholder report contains important information about the Global Resources Fund (the "Fund") for the period January 1, 2025 to December 31, 2025.
|
|
| Shareholder Report Annual or Semi-Annual |
Annual Shareholder Report
|
|
| Additional Information [Text Block] |
You can find additional information about the Fund at https://www.vaneck.com/us/en/etf-mutual-fund-finder/mutual-funds/documents/. You can also request this information by contacting us at 800.826.2333 or info@vaneck.com.
|
|
| Material Fund Change Notice [Text Block] |
This report describes material changes to the Fund that occurred during the reporting period.
|
|
| Additional Information Phone Number |
800.826.2333
|
|
| Additional Information Email |
<span style="box-sizing: border-box; color: rgb(0, 0, 0); display: inline; flex-wrap: nowrap; font-size: 10.6667px; font-weight: 400; grid-area: auto; line-height: 16px; margin: 0px; overflow: visible; text-align: left; text-align-last: auto; white-space-collapse: preserve-breaks;">info@vaneck.com</span>
|
|
| Additional Information Website |
<span style="box-sizing: border-box; color: rgb(0, 0, 0); display: inline; flex-wrap: nowrap; font-size: 10.6667px; font-weight: 400; grid-area: auto; line-height: 16px; margin: 0px; overflow: visible; text-align: left; text-align-last: auto; white-space-collapse: preserve-breaks;">https://www.vaneck.com/us/en/etf-mutual-fund-finder/mutual-funds/documents/</span>
|
|
| Expenses [Text Block] |
What were the Fund costs for the last year?(based on a hypothetical $10,000 investment) Class Name | Costs of a $10,000 investment | Costs paid as a % of a $10,000 investment |
|---|
Class A | $163 | 1.38% |
|---|
|
|
| Expenses Paid, Amount |
$ 163
|
|
| Expense Ratio, Percent |
1.38%
|
|
| Factors Affecting Performance [Text Block] |
How did the Fund perform last year?During the period, commodities and resource equities rebounded, supported by improving global growth expectations, easing financial conditions and tightening supply across several key commodity markets. Gold prices reached record highs amid persistent geopolitical uncertainty and sustained central bank demand, while base and industrial metals benefited from supply constraints and growing demand tied to electrification, infrastructure investment and data-center-driven power needs. While concerns around China’s uneven economic recovery periodically weighed on sentiment, markets increasingly responded to underlying fundamentals. On an absolute basis, the Fund’s exposure to Gold & Precious Metals and Base & Industrial Metals were the largest contributor to performance. Gold & Precious Metals companies benefited from significant margin expansion and Base & Industrial Metals companies advanced as copper and aluminum prices strengthened. Oil & Gas also contributed positively for much of the period, supported by capital discipline and shareholder return programs. From a sector standpoint, the Fund’s largest absolute detractors were Paper & Forest and Other Materials. On an individual security basis, the Fund’s largest contributors included gold mining companies Kinross Gold, Barrick Mining Corp. and Newmont Corp, all of which benefited from record gold prices, strong free cash flow generation and disciplined capital allocation. The largest individual detractors included International Paper Co, Graphic Packaging Holding and West Fraser Timber Co. Ltd., reflecting weaker crop protection demand, inventory normalization and softer packaging and construction-related activity. Relative to the benchmark, the S&P Global Natural Resources Index, the Fund outperformed primarily due to overweight positioning and strong security selection within Gold & Precious Metals, a substantial underweight allocation to Paper & Forest, and effective security selection within Base & Industrial Metals.
|
|
| Performance Past Does Not Indicate Future [Text] |
The performance data quoted represents past performance. Past performance is no guarantee of future results.
|
|
| Average Annual Return [Table Text Block] |
Average Annual Total Returns . | 1 Year | 5 Years | 10 Years |
|---|
Class A Before Sales Charge | 36.11% | 10.14% | 7.90% |
|---|
Class A After Maximum Sales Charge | 28.28% | 8.84% | 7.27% |
|---|
S&P Global Natural Resources Index | 28.86% | 10.61% | 10.38% |
|---|
MSCI ACWI Index | 22.34% | 11.19% | 11.72% |
|---|
The performance data quoted represents past performance. Past performance is no guarantee of future results. Performance information for the Fund may reflect temporary fee waivers, if applicable. These returns do not reflect the deduction of taxes that a shareholder would pay on Fund dividends and distributions or the sale of Fund shares. Visit vaneck.com for more recent performance information. |
|
| No Deduction of Taxes [Text Block] |
|
|
| Performance Table Market Index Changed [Text Block] |
|
|
| Material Change Description [Text Block] |
|
|
| Material Change Date |
Dec. 31, 2025
|
|
| Updated Performance Information Location [Text Block] |
|
|
| AssetsNet |
$ 648,610,375
|
|
| Holdings Count | Holding |
67
|
|
| Advisory Fees Paid, Amount |
$ 4,256,103
|
|
| InvestmentCompanyPortfolioTurnover |
58.00%
|
|
| Additional Fund Statistics [Text Block] |
- Total Net Assets$648,610,375
- Number of Portfolio Holdings67
- Portfolio Turnover Rate58%
- Advisory Fees Paid$4,256,103
|
|
| Additional Fund Statistics Significance or Limits [Text Block] |
|
|
| Holdings [Text Block] |
Portfolio Composition (% of Total Net Assets)Value | Value | Value |
|---|
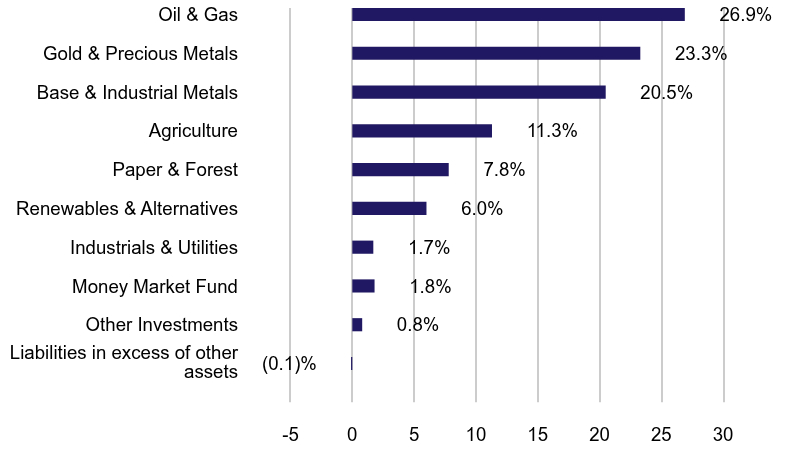
Liabilities in excess of other assets | | (0.1)% | Other Investments | | 0.8% | Money Market Fund | | 1.8% | Industrials & Utilities | | 1.7% | Renewables & Alternatives | | 6.0% | Paper & Forest | | 7.8% | Agriculture | | 11.3% | Base & Industrial Metals | | 20.5% | Gold & Precious Metals | | 23.3% | Oil & Gas | | 26.9% |
|
|
| Largest Holdings [Text Block] |
Top Ten Holdings (% of Total Net Assets)Shell PLC | | 4.3% |
|---|
Exxon Mobil Corp. | | 4.1% |
|---|
Barrick Mining Corp. | | 3.6% |
|---|
Newmont Corp. | | 3.4% |
|---|
Anglo American PLC | | 3.1% |
|---|
Agnico Eagle Mines Ltd. | | 3.1% |
|---|
Kinross Gold Corp. | | 3.1% |
|---|
Nutrien Ltd. | | 2.9% |
|---|
Glencore PLC | | 2.8% |
|---|
JBS NV | | 2.7% |
|---|
|
|
| Material Fund Change [Text Block] |
The following material fund change occurred during the period ended December 31, 2025: Effective April 30, 2025, the Class C shares of VanEck Global Resources Fund were converted into Class A shares of the Fund and Class C shares of the Fund were terminated effective immediately after such conversion. |
|
| Summary of Change Legend [Text Block] |
The following material fund change occurred during the period ended December 31, 2025:
|
|
| Updated Prospectus Web Address |
<span style="box-sizing: border-box; color: rgb(0, 0, 0); display: inline; flex-wrap: nowrap; font-size: 10.6667px; font-weight: 400; grid-area: auto; line-height: 16px; margin: 0px; overflow: visible; text-align: left; text-align-last: auto; white-space-collapse: preserve-breaks;">https://www.vaneck.com/us/en/etf-mutual-fund-finder/mutual-funds/documents/</span>
|
|
| C000033047 |
|
|
| Shareholder Report [Line Items] |
|
|
| Fund Name |
Global Resources Fund
|
|
| Class Name |
Class I
|
|
| Trading Symbol |
GHAIX
|
|
| Annual or Semi-Annual Statement [Text Block] |
This annual shareholder report contains important information about the Global Resources Fund (the "Fund") for the period January 1, 2025 to December 31, 2025.
|
|
| Shareholder Report Annual or Semi-Annual |
Annual Shareholder Report
|
|
| Additional Information [Text Block] |
You can find additional information about the Fund at https://www.vaneck.com/us/en/etf-mutual-fund-finder/mutual-funds/documents/. You can also request this information by contacting us at 800.826.2333 or info@vaneck.com.
|
|
| Material Fund Change Notice [Text Block] |
This report describes material changes to the Fund that occurred during the reporting period.
|
|
| Additional Information Phone Number |
800.826.2333
|
|
| Additional Information Email |
<span style="box-sizing: border-box; color: rgb(0, 0, 0); display: inline; flex-wrap: nowrap; font-size: 10.6667px; font-weight: 400; grid-area: auto; line-height: 16px; margin: 0px; overflow: visible; text-align: left; text-align-last: auto; white-space-collapse: preserve-breaks;">info@vaneck.com</span>
|
|
| Additional Information Website |
<span style="box-sizing: border-box; color: rgb(0, 0, 0); display: inline; flex-wrap: nowrap; font-size: 10.6667px; font-weight: 400; grid-area: auto; line-height: 16px; margin: 0px; overflow: visible; text-align: left; text-align-last: auto; white-space-collapse: preserve-breaks;">https://www.vaneck.com/us/en/etf-mutual-fund-finder/mutual-funds/documents/</span>
|
|
| Expenses [Text Block] |
What were the Fund costs for the last year?(based on a hypothetical $10,000 investment) Class Name | Costs of a $10,000 investment | Costs paid as a % of a $10,000 investment |
|---|
Class I | $113 | 0.96% |
|---|
|
|
| Expenses Paid, Amount |
$ 113
|
|
| Expense Ratio, Percent |
0.96%
|
|
| Factors Affecting Performance [Text Block] |
How did the Fund perform last year?During the period, commodities and resource equities rebounded, supported by improving global growth expectations, easing financial conditions and tightening supply across several key commodity markets. Gold prices reached record highs amid persistent geopolitical uncertainty and sustained central bank demand, while base and industrial metals benefited from supply constraints and growing demand tied to electrification, infrastructure investment and data-center-driven power needs. While concerns around China’s uneven economic recovery periodically weighed on sentiment, markets increasingly responded to underlying fundamentals. On an absolute basis, the Fund’s exposure to Gold & Precious Metals and Base & Industrial Metals were the largest contributor to performance. Gold & Precious Metals companies benefited from significant margin expansion and Base & Industrial Metals companies advanced as copper and aluminum prices strengthened. Oil & Gas also contributed positively for much of the period, supported by capital discipline and shareholder return programs. From a sector standpoint, the Fund’s largest absolute detractors were Paper & Forest and Other Materials. On an individual security basis, the Fund’s largest contributors included gold mining companies Kinross Gold, Barrick Mining Corp. and Newmont Corp, all of which benefited from record gold prices, strong free cash flow generation and disciplined capital allocation. The largest individual detractors included International Paper Co, Graphic Packaging Holding and West Fraser Timber Co. Ltd., reflecting weaker crop protection demand, inventory normalization and softer packaging and construction-related activity. Relative to the benchmark, the S&P Global Natural Resources Index, the Fund outperformed primarily due to overweight positioning and strong security selection within Gold & Precious Metals, a substantial underweight allocation to Paper & Forest, and effective security selection within Base & Industrial Metals.
|
|
| Performance Past Does Not Indicate Future [Text] |
The performance data quoted represents past performance. Past performance is no guarantee of future results.
|
|
| Average Annual Return [Table Text Block] |
Average Annual Total Returns . | 1 Year | 5 Years | 10 Years |
|---|
Class I | 36.67% | 10.61% | 8.36% |
|---|
S&P Global Natural Resources Index | 28.86% | 10.61% | 10.38% |
|---|
MSCI ACWI Index | 22.34% | 11.19% | 11.72% |
|---|
The performance data quoted represents past performance. Past performance is no guarantee of future results. Performance information for the Fund may reflect temporary fee waivers, if applicable. These returns do not reflect the deduction of taxes that a shareholder would pay on Fund dividends and distributions or the sale of Fund shares. Visit vaneck.com for more recent performance information. |
|
| No Deduction of Taxes [Text Block] |
|
|
| Performance Table Market Index Changed [Text Block] |
|
|
| Material Change Description [Text Block] |
|
|
| Material Change Date |
Dec. 31, 2025
|
|
| Updated Performance Information Location [Text Block] |
|
|
| AssetsNet |
$ 648,610,375
|
|
| Holdings Count | Holding |
67
|
|
| Advisory Fees Paid, Amount |
$ 4,256,103
|
|
| InvestmentCompanyPortfolioTurnover |
58.00%
|
|
| Additional Fund Statistics [Text Block] |
- Total Net Assets$648,610,375
- Number of Portfolio Holdings67
- Portfolio Turnover Rate58%
- Advisory Fees Paid$4,256,103
|
|
| Additional Fund Statistics Significance or Limits [Text Block] |
|
|
| Holdings [Text Block] |
Portfolio Composition (% of Total Net Assets)Value | Value | Value |
|---|
Liabilities in excess of other assets | | (0.1)% | Other Investments | | 0.8% | Money Market Fund | | 1.8% | Industrials & Utilities | | 1.7% | Renewables & Alternatives | | 6.0% | Paper & Forest | | 7.8% | Agriculture | | 11.3% | Base & Industrial Metals | | 20.5% | Gold & Precious Metals | | 23.3% | Oil & Gas | | 26.9% |
|
|
| Largest Holdings [Text Block] |
Top Ten Holdings (% of Total Net Assets)Shell PLC | | 4.3% |
|---|
Exxon Mobil Corp. | | 4.1% |
|---|
Barrick Mining Corp. | | 3.6% |
|---|
Newmont Corp. | | 3.4% |
|---|
Anglo American PLC | | 3.1% |
|---|
Agnico Eagle Mines Ltd. | | 3.1% |
|---|
Kinross Gold Corp. | | 3.1% |
|---|
Nutrien Ltd. | | 2.9% |
|---|
Glencore PLC | | 2.8% |
|---|
JBS NV | | 2.7% |
|---|
|
|
| Material Fund Change [Text Block] |
The following material fund change occurred during the period ended December 31, 2025: Effective April 30, 2025, the Class C shares of VanEck Global Resources Fund were converted into Class A shares of the Fund and Class C shares of the Fund were terminated effective immediately after such conversion. |
|
| Summary of Change Legend [Text Block] |
The following material fund change occurred during the period ended December 31, 2025:
|
|
| Updated Prospectus Web Address |
<span style="box-sizing: border-box; color: rgb(0, 0, 0); display: inline; flex-wrap: nowrap; font-size: 10.6667px; font-weight: 400; grid-area: auto; line-height: 16px; margin: 0px; overflow: visible; text-align: left; text-align-last: auto; white-space-collapse: preserve-breaks;">https://www.vaneck.com/us/en/etf-mutual-fund-finder/mutual-funds/documents/</span>
|
|
| C000088112 |
|
|
| Shareholder Report [Line Items] |
|
|
| Fund Name |
Global Resources Fund
|
|
| Class Name |
Class Y
|
|
| Trading Symbol |
GHAYX
|
|
| Annual or Semi-Annual Statement [Text Block] |
This annual shareholder report contains important information about the Global Resources Fund (the "Fund") for the period January 1, 2025 to December 31, 2025.
|
|
| Shareholder Report Annual or Semi-Annual |
Annual Shareholder Report
|
|
| Additional Information [Text Block] |
You can find additional information about the Fund at https://www.vaneck.com/us/en/etf-mutual-fund-finder/mutual-funds/documents/. You can also request this information by contacting us at 800.826.2333 or info@vaneck.com.
|
|
| Material Fund Change Notice [Text Block] |
This report describes material changes to the Fund that occurred during the reporting period.
|
|
| Additional Information Phone Number |
800.826.2333
|
|
| Additional Information Email |
<span style="box-sizing: border-box; color: rgb(0, 0, 0); display: inline; flex-wrap: nowrap; font-size: 10.6667px; font-weight: 400; grid-area: auto; line-height: 16px; margin: 0px; overflow: visible; text-align: left; text-align-last: auto; white-space-collapse: preserve-breaks;">info@vaneck.com</span>
|
|
| Additional Information Website |
<span style="box-sizing: border-box; color: rgb(0, 0, 0); display: inline; flex-wrap: nowrap; font-size: 10.6667px; font-weight: 400; grid-area: auto; line-height: 16px; margin: 0px; overflow: visible; text-align: left; text-align-last: auto; white-space-collapse: preserve-breaks;">https://www.vaneck.com/us/en/etf-mutual-fund-finder/mutual-funds/documents/</span>
|
|
| Expenses [Text Block] |
What were the Fund costs for the last year?(based on a hypothetical $10,000 investment) Class Name | Costs of a $10,000 investment | Costs paid as a % of a $10,000 investment |
|---|
Class Y | $134 | 1.13% |
|---|
|
|
| Expenses Paid, Amount |
$ 134
|
|
| Expense Ratio, Percent |
1.13%
|
|
| Factors Affecting Performance [Text Block] |
How did the Fund perform last year?During the period, commodities and resource equities rebounded, supported by improving global growth expectations, easing financial conditions and tightening supply across several key commodity markets. Gold prices reached record highs amid persistent geopolitical uncertainty and sustained central bank demand, while base and industrial metals benefited from supply constraints and growing demand tied to electrification, infrastructure investment and data-center-driven power needs. While concerns around China’s uneven economic recovery periodically weighed on sentiment, markets increasingly responded to underlying fundamentals. On an absolute basis, the Fund’s exposure to Gold & Precious Metals and Base & Industrial Metals were the largest contributor to performance. Gold & Precious Metals companies benefited from significant margin expansion and Base & Industrial Metals companies advanced as copper and aluminum prices strengthened. Oil & Gas also contributed positively for much of the period, supported by capital discipline and shareholder return programs. From a sector standpoint, the Fund’s largest absolute detractors were Paper & Forest and Other Materials. On an individual security basis, the Fund’s largest contributors included gold mining companies Kinross Gold, Barrick Mining Corp. and Newmont Corp, all of which benefited from record gold prices, strong free cash flow generation and disciplined capital allocation. The largest individual detractors included International Paper Co, Graphic Packaging Holding and West Fraser Timber Co. Ltd., reflecting weaker crop protection demand, inventory normalization and softer packaging and construction-related activity. Relative to the benchmark, the S&P Global Natural Resources Index, the Fund outperformed primarily due to overweight positioning and strong security selection within Gold & Precious Metals, a substantial underweight allocation to Paper & Forest, and effective security selection within Base & Industrial Metals.
|
|
| Performance Past Does Not Indicate Future [Text] |
The performance data quoted represents past performance. Past performance is no guarantee of future results.
|
|
| Average Annual Return [Table Text Block] |
Average Annual Total Returns . | 1 Year | 5 Years | 10 Years |
|---|
Class Y | 36.43% | 10.41% | 8.17% |
|---|
S&P Global Natural Resources Index | 28.86% | 10.61% | 10.38% |
|---|
MSCI ACWI Index | 22.34% | 11.19% | 11.72% |
|---|
The performance data quoted represents past performance. Past performance is no guarantee of future results. Performance information for the Fund may reflect temporary fee waivers, if applicable. These returns do not reflect the deduction of taxes that a shareholder would pay on Fund dividends and distributions or the sale of Fund shares. Visit vaneck.com for more recent performance information. |
|
| No Deduction of Taxes [Text Block] |
|
|
| Performance Table Market Index Changed [Text Block] |
|
|
| Material Change Description [Text Block] |
|
|
| Material Change Date |
Dec. 31, 2025
|
|
| Updated Performance Information Location [Text Block] |
|
|
| AssetsNet |
$ 648,610,375
|
|
| Holdings Count | Holding |
67
|
|
| Advisory Fees Paid, Amount |
$ 4,256,103
|
|
| InvestmentCompanyPortfolioTurnover |
58.00%
|
|
| Additional Fund Statistics [Text Block] |
- Total Net Assets$648,610,375
- Number of Portfolio Holdings67
- Portfolio Turnover Rate58%
- Advisory Fees Paid$4,256,103
|
|
| Additional Fund Statistics Significance or Limits [Text Block] |
|
|
| Holdings [Text Block] |
Portfolio Composition (% of Total Net Assets)Value | Value | Value |
|---|
Liabilities in excess of other assets | | (0.1)% | Other Investments | | 0.8% | Money Market Fund | | 1.8% | Industrials & Utilities | | 1.7% | Renewables & Alternatives | | 6.0% | Paper & Forest | | 7.8% | Agriculture | | 11.3% | Base & Industrial Metals | | 20.5% | Gold & Precious Metals | | 23.3% | Oil & Gas | | 26.9% |
|
|
| Largest Holdings [Text Block] |
Top Ten Holdings (% of Total Net Assets)Shell PLC | | 4.3% |
|---|
Exxon Mobil Corp. | | 4.1% |
|---|
Barrick Mining Corp. | | 3.6% |
|---|
Newmont Corp. | | 3.4% |
|---|
Anglo American PLC | | 3.1% |
|---|
Agnico Eagle Mines Ltd. | | 3.1% |
|---|
Kinross Gold Corp. | | 3.1% |
|---|
Nutrien Ltd. | | 2.9% |
|---|
Glencore PLC | | 2.8% |
|---|
JBS NV | | 2.7% |
|---|
|
|
| Material Fund Change [Text Block] |
The following material fund change occurred during the period ended December 31, 2025: Effective April 30, 2025, the Class C shares of VanEck Global Resources Fund were converted into Class A shares of the Fund and Class C shares of the Fund were terminated effective immediately after such conversion. |
|
| Summary of Change Legend [Text Block] |
The following material fund change occurred during the period ended December 31, 2025:
|
|
| Updated Prospectus Web Address |
<span style="box-sizing: border-box; color: rgb(0, 0, 0); display: inline; flex-wrap: nowrap; font-size: 10.6667px; font-weight: 400; grid-area: auto; line-height: 16px; margin: 0px; overflow: visible; text-align: left; text-align-last: auto; white-space-collapse: preserve-breaks;">https://www.vaneck.com/us/en/etf-mutual-fund-finder/mutual-funds/documents/</span>
|
|
| C000024994 |
|
|
| Shareholder Report [Line Items] |
|
|
| Fund Name |
International Investors Gold Fund
|
|
| Class Name |
Class A
|
|
| Trading Symbol |
INIVX
|
|
| Annual or Semi-Annual Statement [Text Block] |
This annual shareholder report contains important information about the International Investors Gold Fund (the "Fund") for the period January 1, 2025 to December 31, 2025.
|
|
| Shareholder Report Annual or Semi-Annual |
Annual Shareholder Report
|
|
| Additional Information [Text Block] |
You can find additional information about the Fund at https://www.vaneck.com/us/en/etf-mutual-fund-finder/mutual-funds/documents/. You can also request this information by contacting us at 800.826.2333 or info@vaneck.com.
|
|
| Additional Information Phone Number |
800.826.2333
|
|
| Additional Information Email |
<span style="box-sizing: border-box; color: rgb(0, 0, 0); display: inline; flex-wrap: nowrap; font-size: 10.6667px; font-weight: 400; grid-area: auto; line-height: 16px; margin: 0px; overflow: visible; text-align: left; text-align-last: auto; white-space-collapse: preserve-breaks;">info@vaneck.com</span>
|
|
| Additional Information Website |
<span style="box-sizing: border-box; color: rgb(0, 0, 0); display: inline; flex-wrap: nowrap; font-size: 10.6667px; font-weight: 400; grid-area: auto; line-height: 16px; margin: 0px; overflow: visible; text-align: left; text-align-last: auto; white-space-collapse: preserve-breaks;">https://www.vaneck.com/us/en/etf-mutual-fund-finder/mutual-funds/documents/</span>
|
|
| Expenses [Text Block] |
What were the Fund costs for the last year?(based on a hypothetical $10,000 investment) Class Name | Costs of a $10,000 investment | Costs paid as a % of a $10,000 investment |
|---|
Class A | $239 | 1.31% |
|---|
|
|
| Expenses Paid, Amount |
$ 239
|
|
| Expense Ratio, Percent |
1.31%
|
|
| Factors Affecting Performance [Text Block] |
How did the Fund perform last year?During the period, gold prices remained well supported, reflecting continued central bank demand, easing monetary policy expectations and persistent geopolitical uncertainty. Gold mining equities benefited from higher realized gold prices and disciplined cost management, which supported cash flow generation and balance sheet strength across much of the industry. On an absolute basis, the Fund’s exposure to senior and major gold miners was the largest contributor to performance. Among them, Agnico Eagle Mines was the top contributor for the period and AngloGold Ashanti also performed well. Among growth-oriented producers, G Mining Ventures was a significant contributor as investors continued to recognize the quality and scale of its development pipeline. Mid-tier gold miners were also additive overall, supported by selective exposure to companies with visible production growth and improving margins. While junior developers and producers delivered strong returns overall, performance within the segment was more dispersed, reflecting project-specific execution risks and financing considerations. On the detractor side, exposure to non-core holdings and early-stage exploration companies weighed modestly on results. Freeport-McMoRan detracted slightly as copper market volatility and macro uncertainty pressured sentiment, while Spartan Resources and Tectonic Metals were negatively impacted by exploration-related uncertainty and limited near-term catalysts. Relative to the benchmark, the NYSE Arca Gold Miners Index, the Fund benefited from positive security selection across all segments and an overweight to junior developers. Allocation effects were modest, with overweights to bullion and cash detracting.
|
|
| Performance Past Does Not Indicate Future [Text] |
The performance data quoted represents past performance. Past performance is no guarantee of future results.
|
|
| Average Annual Return [Table Text Block] |
Average Annual Total Returns . | 1 Year | 5 Years | 10 Years |
|---|
Class A Before Sales Charge | 165.86% | 19.84% | 21.50% |
|---|
Class A After Maximum Sales Charge | 150.57% | 18.43% | 20.79% |
|---|
NYSE Arca Gold Miners Index | 158.28% | 21.22% | 21.83% |
|---|
MSCI ACWI Index | 22.34% | 11.19% | 11.72% |
|---|
The performance data quoted represents past performance. Past performance is no guarantee of future results. Performance information for the Fund may reflect temporary fee waivers, if applicable. These returns do not reflect the deduction of taxes that a shareholder would pay on Fund dividends and distributions or the sale of Fund shares. Visit vaneck.com for more recent performance information. |
|
| No Deduction of Taxes [Text Block] |
|
|
| Performance Table Market Index Changed [Text Block] |
|
|
| Material Change Description [Text Block] |
|
|
| Updated Performance Information Location [Text Block] |
|
|
| AssetsNet |
$ 1,526,423,521
|
|
| Holdings Count | Holding |
50
|
|
| Advisory Fees Paid, Amount |
$ 6,756,055
|
|
| InvestmentCompanyPortfolioTurnover |
30.00%
|
|
| Additional Fund Statistics [Text Block] |
- Total Net Assets$1,526,423,521
- Number of Portfolio Holdings50
- Portfolio Turnover Rate30%
- Advisory Fees Paid$6,756,055
|
|
| Additional Fund Statistics Significance or Limits [Text Block] |
|
|
| Holdings [Text Block] |
Portfolio Composition (% of Total Net Assets)Value | Value | Value |
|---|
Liabilities in excess of other assets | | (0.3)% | Other Investments | | 0.4% | Diversified Metals & Mining | | 1.5% | Gold | | 98.4% |
|
|
| Largest Holdings [Text Block] |
Top Ten Holdings (% of Total Net Assets)Newmont Corp. | | 8.6% |
|---|
G Mining Ventures Corp. | | 7.2% |
|---|
Agnico Eagle Mines Ltd. | | 6.5% |
|---|
Barrick Mining Corp. | | 5.8% |
|---|
Anglogold Ashanti PLC | | 5.4% |
|---|
Alamos Gold, Inc. | | 5.0% |
|---|
Gold Fields Ltd. | | 3.7% |
|---|
Pan American Silver Corp. | | 3.7% |
|---|
Montage Gold Corp. | | 3.6% |
|---|
Kinross Gold Corp. | | 3.6% |
|---|
|
|
| Material Fund Change [Text Block] |
|
|
| Summary of Change Legend [Text Block] |
|
|
| Updated Prospectus Web Address |
<span style="box-sizing: border-box; color: rgb(0, 0, 0); display: inline; flex-wrap: nowrap; font-size: 10.6667px; font-weight: 400; grid-area: auto; line-height: 16px; margin: 0px; overflow: visible; text-align: left; text-align-last: auto; white-space-collapse: preserve-breaks;">https://www.vaneck.com/us/en/etf-mutual-fund-finder/mutual-funds/documents/</span>
|
|
| C000024995 |
|
|
| Shareholder Report [Line Items] |
|
|
| Fund Name |
International Investors Gold Fund
|
|
| Class Name |
Class C
|
|
| Trading Symbol |
IIGCX
|
|
| Annual or Semi-Annual Statement [Text Block] |
This annual shareholder report contains important information about the International Investors Gold Fund (the "Fund") for the period January 1, 2025 to December 31, 2025.
|
|
| Shareholder Report Annual or Semi-Annual |
Annual Shareholder Report
|
|
| Additional Information [Text Block] |
You can find additional information about the Fund at https://www.vaneck.com/us/en/etf-mutual-fund-finder/mutual-funds/documents/. You can also request this information by contacting us at 800.826.2333 or info@vaneck.com.
|
|
| Additional Information Phone Number |
800.826.2333
|
|
| Additional Information Email |
<span style="box-sizing: border-box; color: rgb(0, 0, 0); display: inline; flex-wrap: nowrap; font-size: 10.6667px; font-weight: 400; grid-area: auto; line-height: 16px; margin: 0px; overflow: visible; text-align: left; text-align-last: auto; white-space-collapse: preserve-breaks;">info@vaneck.com</span>
|
|
| Additional Information Website |
<span style="box-sizing: border-box; color: rgb(0, 0, 0); display: inline; flex-wrap: nowrap; font-size: 10.6667px; font-weight: 400; grid-area: auto; line-height: 16px; margin: 0px; overflow: visible; text-align: left; text-align-last: auto; white-space-collapse: preserve-breaks;">https://www.vaneck.com/us/en/etf-mutual-fund-finder/mutual-funds/documents/</span>
|
|
| Expenses [Text Block] |
What were the Fund costs for the last year?(based on a hypothetical $10,000 investment) Class Name | Costs of a $10,000 investment | Costs paid as a % of a $10,000 investment |
|---|
Class C | $385 | 2.12% |
|---|
|
|
| Expenses Paid, Amount |
$ 385
|
|
| Expense Ratio, Percent |
2.12%
|
|
| Factors Affecting Performance [Text Block] |
How did the Fund perform last year?During the period, gold prices remained well supported, reflecting continued central bank demand, easing monetary policy expectations and persistent geopolitical uncertainty. Gold mining equities benefited from higher realized gold prices and disciplined cost management, which supported cash flow generation and balance sheet strength across much of the industry. On an absolute basis, the Fund’s exposure to senior and major gold miners was the largest contributor to performance. Among them, Agnico Eagle Mines was the top contributor for the period and AngloGold Ashanti also performed well. Among growth-oriented producers, G Mining Ventures was a significant contributor as investors continued to recognize the quality and scale of its development pipeline. Mid-tier gold miners were also additive overall, supported by selective exposure to companies with visible production growth and improving margins. While junior developers and producers delivered strong returns overall, performance within the segment was more dispersed, reflecting project-specific execution risks and financing considerations. On the detractor side, exposure to non-core holdings and early-stage exploration companies weighed modestly on results. Freeport-McMoRan detracted slightly as copper market volatility and macro uncertainty pressured sentiment, while Spartan Resources and Tectonic Metals were negatively impacted by exploration-related uncertainty and limited near-term catalysts. Relative to the benchmark, the NYSE Arca Gold Miners Index, the Fund benefited from positive security selection across all segments and an overweight to junior developers. Allocation effects were modest, with overweights to bullion and cash detracting.
|
|
| Performance Past Does Not Indicate Future [Text] |
The performance data quoted represents past performance. Past performance is no guarantee of future results.
|
|
| Average Annual Return [Table Text Block] |
Average Annual Total Returns . | 1 Year | 5 Years | 10 Years |
|---|
Class C Before Sales Charge | 163.77% | 18.91% | 20.58% |
|---|
Class C After Maximum Sales Charge | 162.77% | 18.91% | 20.58% |
|---|
NYSE Arca Gold Miners Index | 158.28% | 21.22% | 21.83% |
|---|
MSCI ACWI Index | 22.34% | 11.19% | 11.72% |
|---|
The performance data quoted represents past performance. Past performance is no guarantee of future results. Performance information for the Fund may reflect temporary fee waivers, if applicable. These returns do not reflect the deduction of taxes that a shareholder would pay on Fund dividends and distributions or the sale of Fund shares. Visit vaneck.com for more recent performance information. |
|
| No Deduction of Taxes [Text Block] |
|
|
| Performance Table Market Index Changed [Text Block] |
|
|
| Material Change Description [Text Block] |
|
|
| Updated Performance Information Location [Text Block] |
|
|
| AssetsNet |
$ 1,526,423,521
|
|
| Holdings Count | Holding |
50
|
|
| Advisory Fees Paid, Amount |
$ 6,756,055
|
|
| InvestmentCompanyPortfolioTurnover |
30.00%
|
|
| Additional Fund Statistics [Text Block] |
- Total Net Assets$1,526,423,521
- Number of Portfolio Holdings50
- Portfolio Turnover Rate30%
- Advisory Fees Paid$6,756,055
|
|
| Additional Fund Statistics Significance or Limits [Text Block] |
|
|
| Holdings [Text Block] |
Portfolio Composition (% of Total Net Assets)Value | Value | Value |
|---|
Liabilities in excess of other assets | | (0.3)% | Other Investments | | 0.4% | Diversified Metals & Mining | | 1.5% | Gold | | 98.4% |
|
|
| Largest Holdings [Text Block] |
Top Ten Holdings (% of Total Net Assets)Newmont Corp. | | 8.6% |
|---|
G Mining Ventures Corp. | | 7.2% |
|---|
Agnico Eagle Mines Ltd. | | 6.5% |
|---|
Barrick Mining Corp. | | 5.8% |
|---|
Anglogold Ashanti PLC | | 5.4% |
|---|
Alamos Gold, Inc. | | 5.0% |
|---|
Gold Fields Ltd. | | 3.7% |
|---|
Pan American Silver Corp. | | 3.7% |
|---|
Montage Gold Corp. | | 3.6% |
|---|
Kinross Gold Corp. | | 3.6% |
|---|
|
|
| Material Fund Change [Text Block] |
|
|
| Summary of Change Legend [Text Block] |
|
|
| Updated Prospectus Web Address |
<span style="box-sizing: border-box; color: rgb(0, 0, 0); display: inline; flex-wrap: nowrap; font-size: 10.6667px; font-weight: 400; grid-area: auto; line-height: 16px; margin: 0px; overflow: visible; text-align: left; text-align-last: auto; white-space-collapse: preserve-breaks;">https://www.vaneck.com/us/en/etf-mutual-fund-finder/mutual-funds/documents/</span>
|
|
| C000033046 |
|
|
| Shareholder Report [Line Items] |
|
|
| Fund Name |
International Investors Gold Fund
|
|
| Class Name |
Class I
|
|
| Trading Symbol |
INIIX
|
|
| Annual or Semi-Annual Statement [Text Block] |
This annual shareholder report contains important information about the International Investors Gold Fund (the "Fund") for the period January 1, 2025 to December 31, 2025.
|
|
| Shareholder Report Annual or Semi-Annual |
Annual Shareholder Report
|
|
| Additional Information [Text Block] |
You can find additional information about the Fund at https://www.vaneck.com/us/en/etf-mutual-fund-finder/mutual-funds/documents/. You can also request this information by contacting us at 800.826.2333 or info@vaneck.com.
|
|
| Additional Information Phone Number |
800.826.2333
|
|
| Additional Information Email |
<span style="box-sizing: border-box; color: rgb(0, 0, 0); display: inline; flex-wrap: nowrap; font-size: 10.6667px; font-weight: 400; grid-area: auto; line-height: 16px; margin: 0px; overflow: visible; text-align: left; text-align-last: auto; white-space-collapse: preserve-breaks;">info@vaneck.com</span>
|
|
| Additional Information Website |
<span style="box-sizing: border-box; color: rgb(0, 0, 0); display: inline; flex-wrap: nowrap; font-size: 10.6667px; font-weight: 400; grid-area: auto; line-height: 16px; margin: 0px; overflow: visible; text-align: left; text-align-last: auto; white-space-collapse: preserve-breaks;">https://www.vaneck.com/us/en/etf-mutual-fund-finder/mutual-funds/documents/</span>
|
|
| Expenses [Text Block] |
What were the Fund costs for the last year?(based on a hypothetical $10,000 investment) Class Name | Costs of a $10,000 investment | Costs paid as a % of a $10,000 investment |
|---|
Class I | $184 | 1.00% |
|---|
|
|
| Expenses Paid, Amount |
$ 184
|
|
| Expense Ratio, Percent |
1.00%
|
|
| Factors Affecting Performance [Text Block] |
How did the Fund perform last year?During the period, gold prices remained well supported, reflecting continued central bank demand, easing monetary policy expectations and persistent geopolitical uncertainty. Gold mining equities benefited from higher realized gold prices and disciplined cost management, which supported cash flow generation and balance sheet strength across much of the industry. On an absolute basis, the Fund’s exposure to senior and major gold miners was the largest contributor to performance. Among them, Agnico Eagle Mines was the top contributor for the period and AngloGold Ashanti also performed well. Among growth-oriented producers, G Mining Ventures was a significant contributor as investors continued to recognize the quality and scale of its development pipeline. Mid-tier gold miners were also additive overall, supported by selective exposure to companies with visible production growth and improving margins. While junior developers and producers delivered strong returns overall, performance within the segment was more dispersed, reflecting project-specific execution risks and financing considerations. On the detractor side, exposure to non-core holdings and early-stage exploration companies weighed modestly on results. Freeport-McMoRan detracted slightly as copper market volatility and macro uncertainty pressured sentiment, while Spartan Resources and Tectonic Metals were negatively impacted by exploration-related uncertainty and limited near-term catalysts. Relative to the benchmark, the NYSE Arca Gold Miners Index, the Fund benefited from positive security selection across all segments and an overweight to junior developers. Allocation effects were modest, with overweights to bullion and cash detracting.
|
|
| Performance Past Does Not Indicate Future [Text] |
The performance data quoted represents past performance. Past performance is no guarantee of future results.
|
|
| Average Annual Return [Table Text Block] |
Average Annual Total Returns . | 1 Year | 5 Years | 10 Years |
|---|
Class I | 166.63% | 20.31% | 21.98% |
|---|
NYSE Arca Gold Miners Index | 158.28% | 21.22% | 21.83% |
|---|
MSCI ACWI Index | 22.34% | 11.19% | 11.72% |
|---|
The performance data quoted represents past performance. Past performance is no guarantee of future results. Performance information for the Fund may reflect temporary fee waivers, if applicable. These returns do not reflect the deduction of taxes that a shareholder would pay on Fund dividends and distributions or the sale of Fund shares. Visit vaneck.com for more recent performance information. |
|
| No Deduction of Taxes [Text Block] |
|
|
| Performance Table Market Index Changed [Text Block] |
|
|
| Material Change Description [Text Block] |
|
|
| Updated Performance Information Location [Text Block] |
|
|
| AssetsNet |
$ 1,526,423,521
|
|
| Holdings Count | Holding |
50
|
|
| Advisory Fees Paid, Amount |
$ 6,756,055
|
|
| InvestmentCompanyPortfolioTurnover |
30.00%
|
|
| Additional Fund Statistics [Text Block] |
- Total Net Assets$1,526,423,521
- Number of Portfolio Holdings50
- Portfolio Turnover Rate30%
- Advisory Fees Paid$6,756,055
|
|
| Additional Fund Statistics Significance or Limits [Text Block] |
|
|
| Holdings [Text Block] |
Portfolio Composition (% of Total Net Assets)Value | Value | Value |
|---|
Liabilities in excess of other assets | | (0.3)% | Other Investments | | 0.4% | Diversified Metals & Mining | | 1.5% | Gold | | 98.4% |
|
|
| Largest Holdings [Text Block] |
Top Ten Holdings (% of Total Net Assets)Newmont Corp. | | 8.6% |
|---|
G Mining Ventures Corp. | | 7.2% |
|---|
Agnico Eagle Mines Ltd. | | 6.5% |
|---|
Barrick Mining Corp. | | 5.8% |
|---|
Anglogold Ashanti PLC | | 5.4% |
|---|
Alamos Gold, Inc. | | 5.0% |
|---|
Gold Fields Ltd. | | 3.7% |
|---|
Pan American Silver Corp. | | 3.7% |
|---|
Montage Gold Corp. | | 3.6% |
|---|
Kinross Gold Corp. | | 3.6% |
|---|
|
|
| Material Fund Change [Text Block] |
|
|
| Summary of Change Legend [Text Block] |
|
|
| Updated Prospectus Web Address |
<span style="box-sizing: border-box; color: rgb(0, 0, 0); display: inline; flex-wrap: nowrap; font-size: 10.6667px; font-weight: 400; grid-area: auto; line-height: 16px; margin: 0px; overflow: visible; text-align: left; text-align-last: auto; white-space-collapse: preserve-breaks;">https://www.vaneck.com/us/en/etf-mutual-fund-finder/mutual-funds/documents/</span>
|
|
| C000088111 |
|
|
| Shareholder Report [Line Items] |
|
|
| Fund Name |
International Investors Gold Fund
|
|
| Class Name |
Class Y
|
|
| Trading Symbol |
INIYX
|
|
| Annual or Semi-Annual Statement [Text Block] |
This annual shareholder report contains important information about the International Investors Gold Fund (the "Fund") for the period January 1, 2025 to December 31, 2025.
|
|
| Shareholder Report Annual or Semi-Annual |
Annual Shareholder Report
|
|
| Additional Information [Text Block] |
You can find additional information about the Fund at https://www.vaneck.com/us/en/etf-mutual-fund-finder/mutual-funds/documents/. You can also request this information by contacting us at 800.826.2333 or info@vaneck.com.
|
|
| Additional Information Phone Number |
800.826.2333
|
|
| Additional Information Email |
<span style="box-sizing: border-box; color: rgb(0, 0, 0); display: inline; flex-wrap: nowrap; font-size: 10.6667px; font-weight: 400; grid-area: auto; line-height: 16px; margin: 0px; overflow: visible; text-align: left; text-align-last: auto; white-space-collapse: preserve-breaks;">info@vaneck.com</span>
|
|
| Additional Information Website |
<span style="box-sizing: border-box; color: rgb(0, 0, 0); display: inline; flex-wrap: nowrap; font-size: 10.6667px; font-weight: 400; grid-area: auto; line-height: 16px; margin: 0px; overflow: visible; text-align: left; text-align-last: auto; white-space-collapse: preserve-breaks;">https://www.vaneck.com/us/en/etf-mutual-fund-finder/mutual-funds/documents/</span>
|
|
| Expenses [Text Block] |
What were the Fund costs for the last year?(based on a hypothetical $10,000 investment) Class Name | Costs of a $10,000 investment | Costs paid as a % of a $10,000 investment |
|---|
Class Y | $189 | 1.03% |
|---|
|
|
| Expenses Paid, Amount |
$ 189
|
|
| Expense Ratio, Percent |
1.03%
|
|
| Factors Affecting Performance [Text Block] |
How did the Fund perform last year?During the period, gold prices remained well supported, reflecting continued central bank demand, easing monetary policy expectations and persistent geopolitical uncertainty. Gold mining equities benefited from higher realized gold prices and disciplined cost management, which supported cash flow generation and balance sheet strength across much of the industry. On an absolute basis, the Fund’s exposure to senior and major gold miners was the largest contributor to performance. Among them, Agnico Eagle Mines was the top contributor for the period and AngloGold Ashanti also performed well. Among growth-oriented producers, G Mining Ventures was a significant contributor as investors continued to recognize the quality and scale of its development pipeline. Mid-tier gold miners were also additive overall, supported by selective exposure to companies with visible production growth and improving margins. While junior developers and producers delivered strong returns overall, performance within the segment was more dispersed, reflecting project-specific execution risks and financing considerations. On the detractor side, exposure to non-core holdings and early-stage exploration companies weighed modestly on results. Freeport-McMoRan detracted slightly as copper market volatility and macro uncertainty pressured sentiment, while Spartan Resources and Tectonic Metals were negatively impacted by exploration-related uncertainty and limited near-term catalysts. Relative to the benchmark, the NYSE Arca Gold Miners Index, the Fund benefited from positive security selection across all segments and an overweight to junior developers. Allocation effects were modest, with overweights to bullion and cash detracting.
|
|
| Performance Past Does Not Indicate Future [Text] |
The performance data quoted represents past performance. Past performance is no guarantee of future results.
|
|
| Average Annual Return [Table Text Block] |
Average Annual Total Returns . | 1 Year | 5 Years | 10 Years |
|---|
Class Y | 166.62% | 20.22% | 21.86% |
|---|
NYSE Arca Gold Miners Index | 158.28% | 21.22% | 21.83% |
|---|
MSCI ACWI Index | 22.34% | 11.19% | 11.72% |
|---|
The performance data quoted represents past performance. Past performance is no guarantee of future results. Performance information for the Fund may reflect temporary fee waivers, if applicable. These returns do not reflect the deduction of taxes that a shareholder would pay on Fund dividends and distributions or the sale of Fund shares. Visit vaneck.com for more recent performance information. |
|
| No Deduction of Taxes [Text Block] |
|
|
| Performance Table Market Index Changed [Text Block] |
|
|
| Material Change Description [Text Block] |
|
|
| Updated Performance Information Location [Text Block] |
|
|
| AssetsNet |
$ 1,526,423,521
|
|
| Holdings Count | Holding |
50
|
|
| Advisory Fees Paid, Amount |
$ 6,756,055
|
|
| InvestmentCompanyPortfolioTurnover |
30.00%
|
|
| Additional Fund Statistics [Text Block] |
- Total Net Assets$1,526,423,521
- Number of Portfolio Holdings50
- Portfolio Turnover Rate30%
- Advisory Fees Paid$6,756,055
|
|
| Additional Fund Statistics Significance or Limits [Text Block] |
|
|
| Holdings [Text Block] |
Portfolio Composition (% of Total Net Assets)Value | Value | Value |
|---|
Liabilities in excess of other assets | | (0.3)% | Other Investments | | 0.4% | Diversified Metals & Mining | | 1.5% | Gold | | 98.4% |
|
|
| Largest Holdings [Text Block] |
Top Ten Holdings (% of Total Net Assets)Newmont Corp. | | 8.6% |
|---|
G Mining Ventures Corp. | | 7.2% |
|---|
Agnico Eagle Mines Ltd. | | 6.5% |
|---|
Barrick Mining Corp. | | 5.8% |
|---|
Anglogold Ashanti PLC | | 5.4% |
|---|
Alamos Gold, Inc. | | 5.0% |
|---|
Gold Fields Ltd. | | 3.7% |
|---|
Pan American Silver Corp. | | 3.7% |
|---|
Montage Gold Corp. | | 3.6% |
|---|
Kinross Gold Corp. | | 3.6% |
|---|
|
|
| Material Fund Change [Text Block] |
|
|
| Summary of Change Legend [Text Block] |
|
|
| Updated Prospectus Web Address |
<span style="box-sizing: border-box; color: rgb(0, 0, 0); display: inline; flex-wrap: nowrap; font-size: 10.6667px; font-weight: 400; grid-area: auto; line-height: 16px; margin: 0px; overflow: visible; text-align: left; text-align-last: auto; white-space-collapse: preserve-breaks;">https://www.vaneck.com/us/en/etf-mutual-fund-finder/mutual-funds/documents/</span>
|
|
| C000117963 |
|
|
| Shareholder Report [Line Items] |
|
|
| Fund Name |
VanEck Emerging Markets Bond ETF
|
|
| Class Name |
VanEck Emerging Markets Bond ETF
|
|
| Trading Symbol |
EMBX
|
|
| Security Exchange Name |
NYSEArca
|
|
| Annual or Semi-Annual Statement [Text Block] |
This annual shareholder report contains important information about the VanEck Emerging Markets Bond ETF (the "Fund") for the period January 1, 2025 to December 31, 2025.
|
|
| Shareholder Report Annual or Semi-Annual |
Annual Shareholder Report
|
|
| Additional Information [Text Block] |
You can find additional information about the Fund at https://www.vaneck.com/us/en/etf-mutual-fund-finder/etfs/documents/. You can also request this information by contacting us at 800.826.2333 or info@vaneck.com.
|
|
| Material Fund Change Notice [Text Block] |
This report describes material changes to the Fund that occurred during the reporting period.
|
|
| Additional Information Phone Number |
800.826.2333
|
|
| Additional Information Email |
<span style="box-sizing: border-box; color: rgb(0, 0, 0); display: inline; flex-wrap: nowrap; font-size: 10.6667px; font-weight: 400; grid-area: auto; line-height: 16px; margin: 0px; overflow: visible; text-align: left; text-align-last: auto; white-space-collapse: preserve-breaks;">info@vaneck.com</span>
|
|
| Additional Information Website |
<span style="box-sizing: border-box; color: rgb(0, 0, 0); display: inline; flex-wrap: nowrap; font-size: 10.6667px; font-weight: 400; grid-area: auto; line-height: 16px; margin: 0px; overflow: visible; text-align: left; text-align-last: auto; white-space-collapse: preserve-breaks;">https://www.vaneck.com/us/en/etf-mutual-fund-finder/etfs/documents/</span>
|
|
| Expenses [Text Block] |
What were the Fund costs for the last year?(based on a hypothetical $10,000 investment) Fund Name | Costs of a $10,000 investment | Costs paid as a % of a $10,000 investment |
|---|
VanEck Emerging Markets Bond ETF | $87 | 0.79% |
|---|
|
|
| Expenses Paid, Amount |
$ 87
|
|
| Expense Ratio, Percent |
0.79%
|
|
| Factors Affecting Performance [Text Block] |
How did the Fund perform last year?Emerging markets bonds delivered strong gains in 2025 driven by appreciation in local currencies from a weaker US dollar, high income from sovereign local bonds, and a decline in bond yields in emerging markets. Relative to its benchmark, 50% J.P. Morgan GBI-EM Global Diversified Index / 50% J.P. Morgan EMBI Global Diversified Index, the Fund outperformed primarily due to selective country positioning within sovereign debt. In terms of country of risk, South Africa, Mexico, and Brazil were the top contributors to performance while Ukraine, Kazakhstan, and Turkey detracted the most. Sovereign bonds contributed the most to performance, while the quasi-sovereign segment detracted slightly during the period.
|
|
| Performance Past Does Not Indicate Future [Text] |
The performance data quoted represents past performance. Past performance is no guarantee of future results.
|
|
| Line Graph [Table Text Block] |
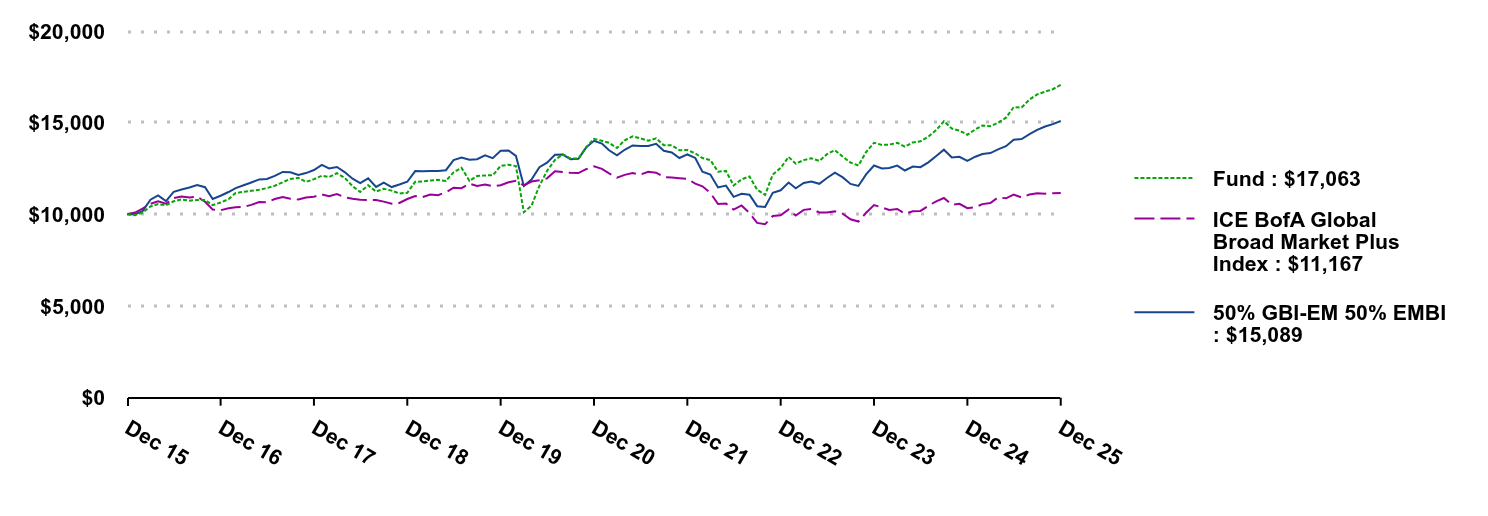 | Fund | ICE BofA Global Broad Market Plus Index | 50% GBI-EM 50% EMBI |
|---|
Dec 15 | $10,000 | $10,000 | $10,000 |
|---|
Jan 16 | $9,958 | $10,097 | $10,008 |
|---|
Feb 16 | $10,100 | $10,314 | $10,176 |
|---|
Mar 16 | $10,427 | $10,578 | $10,801 |
|---|
Apr 16 | $10,559 | $10,713 | $11,036 |
|---|
May 16 | $10,491 | $10,581 | $10,726 |
|---|
Jun 16 | $10,713 | $10,889 | $11,223 |
|---|
Jul 16 | $10,813 | $10,972 | $11,357 |
|---|
Aug 16 | $10,747 | $10,922 | $11,461 |
|---|
Sep 16 | $10,782 | $10,975 | $11,600 |
|---|
Oct 16 | $10,778 | $10,685 | $11,479 |
|---|
Nov 16 | $10,503 | $10,268 | $10,841 |
|---|
Dec 16 | $10,645 | $10,225 | $11,015 |
|---|
Jan 17 | $10,831 | $10,336 | $11,218 |
|---|
Feb 17 | $11,164 | $10,389 | $11,432 |
|---|
Mar 17 | $11,228 | $10,402 | $11,586 |
|---|
Apr 17 | $11,288 | $10,518 | $11,740 |
|---|
May 17 | $11,340 | $10,673 | $11,907 |
|---|
Jun 17 | $11,430 | $10,664 | $11,926 |
|---|
Jul 17 | $11,562 | $10,838 | $12,100 |
|---|
Aug 17 | $11,751 | $10,947 | $12,315 |
|---|
Sep 17 | $11,931 | $10,851 | $12,295 |
|---|
Oct 17 | $11,992 | $10,808 | $12,144 |
|---|
Nov 17 | $11,768 | $10,921 | $12,250 |
|---|
Dec 17 | $11,919 | $10,961 | $12,419 |
|---|
Jan 18 | $12,108 | $11,082 | $12,694 |
|---|
Feb 18 | $12,034 | $10,984 | $12,502 |
|---|
Mar 18 | $12,245 | $11,101 | $12,584 |
|---|
Apr 18 | $11,997 | $10,929 | $12,306 |
|---|
May 18 | $11,532 | $10,845 | $11,942 |
|---|
Jun 18 | $11,219 | $10,797 | $11,700 |
|---|
Jul 18 | $11,589 | $10,780 | $11,961 |
|---|
Aug 18 | $11,241 | $10,784 | $11,493 |
|---|
Sep 18 | $11,394 | $10,695 | $11,729 |
|---|
Oct 18 | $11,293 | $10,583 | $11,488 |
|---|
Nov 18 | $11,136 | $10,622 | $11,625 |
|---|
Dec 18 | $11,179 | $10,836 | $11,779 |
|---|
Jan 19 | $11,774 | $11,001 | $12,361 |
|---|
Feb 19 | $11,797 | $10,940 | $12,355 |
|---|
Mar 19 | $11,843 | $11,079 | $12,361 |
|---|
Apr 19 | $11,882 | $11,048 | $12,365 |
|---|
May 19 | $11,822 | $11,204 | $12,408 |
|---|
Jun 19 | $12,295 | $11,451 | $12,961 |
|---|
Jul 19 | $12,540 | $11,425 | $13,100 |
|---|
Aug 19 | $11,824 | $11,671 | $12,976 |
|---|
Sep 19 | $12,090 | $11,548 | $13,009 |
|---|
Oct 19 | $12,125 | $11,624 | $13,215 |
|---|
Nov 19 | $12,127 | $11,532 | $13,064 |
|---|
Dec 19 | $12,644 | $11,591 | $13,465 |
|---|
Jan 20 | $12,708 | $11,746 | $13,481 |
|---|
Feb 20 | $12,630 | $11,833 | $13,186 |
|---|
Mar 20 | $10,117 | $11,576 | $11,543 |
|---|
Apr 20 | $10,472 | $11,792 | $11,899 |
|---|
May 20 | $11,557 | $11,857 | $12,568 |
|---|
Jun 20 | $12,370 | $11,963 | $12,818 |
|---|
Jul 20 | $12,965 | $12,344 | $13,249 |
|---|
Aug 20 | $13,271 | $12,304 | $13,262 |
|---|
Sep 20 | $13,041 | $12,263 | $13,007 |
|---|
Oct 20 | $13,039 | $12,251 | $13,033 |
|---|
Nov 20 | $13,660 | $12,463 | $13,642 |
|---|
Dec 20 | $14,111 | $12,617 | $14,009 |
|---|
Jan 21 | $14,011 | $12,483 | $13,858 |
|---|
Feb 21 | $13,903 | $12,235 | $13,496 |
|---|
Mar 21 | $13,616 | $12,004 | $13,224 |
|---|
Apr 21 | $14,040 | $12,153 | $13,520 |
|---|
May 21 | $14,250 | $12,249 | $13,760 |
|---|
Jun 21 | $14,152 | $12,169 | $13,727 |
|---|
Jul 21 | $14,014 | $12,323 | $13,727 |
|---|
Aug 21 | $14,147 | $12,272 | $13,847 |
|---|
Sep 21 | $13,770 | $12,036 | $13,466 |
|---|
Oct 21 | $13,766 | $12,003 | $13,378 |
|---|
Nov 21 | $13,501 | $11,966 | $13,072 |
|---|
Dec 21 | $13,504 | $11,937 | $13,266 |
|---|
Jan 22 | $13,327 | $11,675 | $13,076 |
|---|
Feb 22 | $13,072 | $11,530 | $12,322 |
|---|
Mar 22 | $12,963 | $11,173 | $12,173 |
|---|
Apr 22 | $12,328 | $10,564 | $11,466 |
|---|
May 22 | $12,368 | $10,593 | $11,569 |
|---|
Jun 22 | $11,572 | $10,256 | $10,952 |
|---|
Jul 22 | $11,909 | $10,486 | $11,126 |
|---|
Aug 22 | $12,068 | $10,067 | $11,066 |
|---|
Sep 22 | $11,346 | $9,531 | $10,445 |
|---|
Oct 22 | $11,058 | $9,461 | $10,407 |
|---|
Nov 22 | $12,173 | $9,907 | $11,173 |
|---|
Dec 22 | $12,530 | $9,949 | $11,311 |
|---|
Jan 23 | $13,129 | $10,265 | $11,734 |
|---|
Feb 23 | $12,764 | $9,932 | $11,419 |
|---|
Mar 23 | $12,958 | $10,245 | $11,708 |
|---|
Apr 23 | $13,059 | $10,297 | $11,790 |
|---|
May 23 | $12,914 | $10,102 | $11,664 |
|---|
Jun 23 | $13,283 | $10,104 | $11,984 |
|---|
Jul 23 | $13,500 | $10,161 | $12,272 |
|---|
Aug 23 | $13,142 | $10,029 | $12,016 |
|---|
Sep 23 | $12,823 | $9,730 | $11,658 |
|---|
Oct 23 | $12,663 | $9,607 | $11,548 |
|---|
Nov 23 | $13,395 | $10,088 | $12,180 |
|---|
Dec 23 | $13,904 | $10,509 | $12,664 |
|---|
Jan 24 | $13,787 | $10,376 | $12,503 |
|---|
Feb 24 | $13,796 | $10,238 | $12,528 |
|---|
Mar 24 | $13,901 | $10,295 | $12,657 |
|---|
Apr 24 | $13,695 | $10,029 | $12,391 |
|---|
May 24 | $13,921 | $10,165 | $12,603 |
|---|
Jun 24 | $13,981 | $10,185 | $12,573 |
|---|
Jul 24 | $14,241 | $10,469 | $12,834 |
|---|
Aug 24 | $14,602 | $10,712 | $13,180 |
|---|
Sep 24 | $15,077 | $10,893 | $13,525 |
|---|
Oct 24 | $14,677 | $10,526 | $13,096 |
|---|
Nov 24 | $14,570 | $10,571 | $13,137 |
|---|
Dec 24 | $14,334 | $10,335 | $12,919 |
|---|
Jan 25 | $14,634 | $10,397 | $13,144 |
|---|
Feb 25 | $14,849 | $10,558 | $13,291 |
|---|
Mar 25 | $14,808 | $10,622 | $13,343 |
|---|
Apr 25 | $14,997 | $10,926 | $13,544 |
|---|
May 25 | $15,271 | $10,875 | $13,716 |
|---|
Jun 25 | $15,845 | $11,082 | $14,073 |
|---|
Jul 25 | $15,825 | $10,919 | $14,109 |
|---|
Aug 25 | $16,265 | $11,078 | $14,376 |
|---|
Sep 25 | $16,542 | $11,154 | $14,604 |
|---|
Oct 25 | $16,693 | $11,129 | $14,793 |
|---|
Nov 25 | $16,825 | $11,156 | $14,923 |
|---|
Dec 25 | $17,063 | $11,167 | $15,089 |
|---|
|
|
| Average Annual Return [Table Text Block] |
Average Annual Total Returns . | 1 Year | 5 Years | 10 Years |
|---|
VanEck Emerging Markets Bond ETF | 19.04% | 3.87% | 5.49% |
|---|
50% GBI-EM 50% EMBI | 16.80% | 1.50% | 4.20% |
|---|
ICE BofA Global Broad Market Plus Index | 8.05% | (2.41)% | 1.11% |
|---|
Prior to 10/06/2025, the Fund operated as the VanEck Emerging Markets Bond Fund. Performance and financial history of the Predecessor Fund's Class I Shares have been adopted by the Fund and will be used going forward. The performance data quoted represents past performance. Past performance is no guarantee of future results. Performance information for the Fund may reflect temporary fee waivers, if applicable. These returns do not reflect the deduction of taxes that a shareholder would pay on Fund dividends and distributions or the sale of Fund shares. Visit vaneck.com for more recent performance information. |
|
| No Deduction of Taxes [Text Block] |
|
|
| Performance Table Market Index Changed [Text Block] |
|
|
| Material Change Description [Text Block] |
|
|
| Material Change Date |
Dec. 31, 2025
|
|
| Updated Performance Information Location [Text Block] |
|
|
| AssetsNet |
$ 93,419,499
|
|
| Holdings Count | Holding |
113
|
|
| Advisory Fees Paid, Amount |
$ 386,167
|
|
| InvestmentCompanyPortfolioTurnover |
217.00%
|
|
| Additional Fund Statistics [Text Block] |
- Total Net Assets$93,419,499
- Number of Portfolio Holdings113
- Portfolio Turnover Rate217%
- Advisory Fees Paid$386,167
|
|
| Additional Fund Statistics Significance or Limits [Text Block] |
|
|
| Holdings [Text Block] |
Portfolio Composition (% of Total Net Assets)Value | Value | Value |
|---|
Other assets less liabilities | | 2.2% | Other Investments | | 1.1% | Utilities | | 1.1% | Financials | | 1.5% | Energy | | 2.5% | Government | | 91.6% |
|
|
| Largest Holdings [Text Block] |
Top Ten Holdings (% of Total Net Assets)Mexican Bonos, 8.00%, 11/7/2047 | | 3.4% |
|---|
Bonos de la Tesoreria de la Republica en pesos, 6.00%, 4/1/2033 | | 3.1% |
|---|
UAE International Government Bond, 2.88%, 10/19/2041 | | 3.1% |
|---|
Mexican Bonos, 7.75%, 11/13/2042 | | 3.1% |
|---|
Malaysia Government Bond, 4.05%, 4/18/2039 | | 2.8% |
|---|
Brazil Notas do Tesouro Nacional, 10.00%, 1/1/2033 | | 2.8% |
|---|
Republic of Poland Government Bond, 5.00%, 10/25/2035 | | 2.5% |
|---|
Export-Import Bank of India, 5.50%, 1/13/2035 | | 2.0% |
|---|
Brazilian Government International Bond, 6.62%, 3/15/2035 | | 2.0% |
|---|
Bolivian Government International Bond, 4.50%, 3/20/2028 | | 2.0% |
|---|
|
|
| Material Fund Change [Text Block] |
The following material fund change occurred during the period ended December 31, 2025: Pursuant to a Plan of Reorganization previously approved by the Board of Trustees of the Trust, the Emerging Markets Bond Fund was reorganized into a newly created exchange-traded fund (the “ETF”) on October 6, 2025. The ETF has a unitary contractual management fee rate of 0.75%. |
|
| Material Fund Change Expenses [Text Block] |
|
|
| Summary of Change Legend [Text Block] |
The following material fund change occurred during the period ended December 31, 2025:
|
|
| Updated Prospectus Web Address |
<span style="box-sizing: border-box; color: rgb(0, 0, 0); display: inline; flex-wrap: nowrap; font-size: 10.6667px; font-weight: 400; grid-area: auto; line-height: 16px; margin: 0px; overflow: visible; text-align: left; text-align-last: auto; white-space-collapse: preserve-breaks;">https://www.vaneck.com/us/en/etf-mutual-fund-finder/etfs/documents/</span>
|
|
| Accountant Change Statement [Text Block] |
|
|
| Accountant Change Disagreements [Text Block] |
|
|
| C000195045 |
|
|
| Shareholder Report [Line Items] |
|
|
| Fund Name |
VanEck Morningstar Wide Moat Fund
|
|
| Class Name |
Class I
|
|
| Trading Symbol |
MWMIX
|
|
| Annual or Semi-Annual Statement [Text Block] |
This annual shareholder report contains important information about the VanEck Morningstar Wide Moat Fund (the "Fund") for the period January 1, 2025 to December 31, 2025.
|
|
| Shareholder Report Annual or Semi-Annual |
Annual Shareholder Report
|
|
| Additional Information [Text Block] |
You can find additional information about the Fund at https://www.vaneck.com/us/en/etf-mutual-fund-finder/mutual-funds/documents/. You can also request this information by contacting us at 800.826.2333 or info@vaneck.com.
|
|
| Additional Information Phone Number |
800.826.2333
|
|
| Additional Information Email |
<span style="box-sizing: border-box; color: rgb(0, 0, 0); display: inline; flex-wrap: nowrap; font-size: 10.6667px; font-weight: 400; grid-area: auto; line-height: 16px; margin: 0px; overflow: visible; text-align: left; text-align-last: auto; white-space-collapse: preserve-breaks;">info@vaneck.com</span>
|
|
| Additional Information Website |
<span style="box-sizing: border-box; color: rgb(0, 0, 0); display: inline; flex-wrap: nowrap; font-size: 10.6667px; font-weight: 400; grid-area: auto; line-height: 16px; margin: 0px; overflow: visible; text-align: left; text-align-last: auto; white-space-collapse: preserve-breaks;">https://www.vaneck.com/us/en/etf-mutual-fund-finder/mutual-funds/documents/</span>
|
|
| Expenses [Text Block] |
What were the Fund costs for the last year?(based on a hypothetical $10,000 investment) Class Name | Costs of a $10,000 investment | Costs paid as a % of a $10,000 investment |
|---|
Class I | $63 | 0.59% |
|---|
|
|
| Expenses Paid, Amount |
$ 63
|
|
| Expense Ratio, Percent |
0.59%
|
|
| Factors Affecting Performance [Text Block] |
How did the Fund perform last year?The Fund posted positive performance for the period but faced some headwinds relative to broad-based market indexes due to its underweight to tech-oriented companies, particularly mega-cap tech companies. Despite its relative underweight, the technology sector contributed the most to the Fund’s performance during the period followed by industrials and healthcare stocks. The leading individual contributors were Huntington Ingalls Industries, Applied Materials, and Teradyne. The consumer defensive sector detracted the most during the period. The leading individual detractors were Constellation Brands and Brown-Forman, both global beverage manufacturers, and Bio-Rad Laboratories Inc.
|
|
| Performance Past Does Not Indicate Future [Text] |
The performance data quoted represents past performance. Past performance is no guarantee of future results.
|
|
| Line Graph [Table Text Block] |
 | Class I | S&P 500 Index | Morningstar® Wide Moat Focus Index |
|---|
Nov 17 | $10,000 | $10,000 | $10,000 |
|---|
Nov 17 | $10,449 | $10,241 | $10,455 |
|---|
Dec 17 | $10,615 | $10,354 | $10,629 |
|---|
Jan 18 | $11,265 | $10,947 | $11,285 |
|---|
Feb 18 | $10,747 | $10,544 | $10,768 |
|---|
Mar 18 | $10,368 | $10,276 | $10,392 |
|---|
Apr 18 | $10,512 | $10,315 | $10,545 |
|---|
May 18 | $10,639 | $10,564 | $10,677 |
|---|
Jun 18 | $10,886 | $10,629 | $10,939 |
|---|
Jul 18 | $11,329 | $11,024 | $11,389 |
|---|
Aug 18 | $11,544 | $11,383 | $11,610 |
|---|
Sep 18 | $11,680 | $11,448 | $11,754 |
|---|
Oct 18 | $11,002 | $10,666 | $11,078 |
|---|
Nov 18 | $11,528 | $10,883 | $11,612 |
|---|
Dec 18 | $10,477 | $9,901 | $10,550 |
|---|
Jan 19 | $11,458 | $10,694 | $11,547 |
|---|
Feb 19 | $11,873 | $11,037 | $11,969 |
|---|
Mar 19 | $11,865 | $11,252 | $11,966 |
|---|
Apr 19 | $12,407 | $11,707 | $12,522 |
|---|
May 19 | $11,418 | $10,963 | $11,524 |
|---|
Jun 19 | $12,232 | $11,736 | $12,358 |
|---|
Jul 19 | $12,587 | $11,905 | $12,725 |
|---|
Aug 19 | $12,293 | $11,716 | $12,432 |
|---|
Sep 19 | $12,753 | $11,935 | $12,903 |
|---|
Oct 19 | $13,278 | $12,194 | $13,442 |
|---|
Nov 19 | $13,838 | $12,636 | $14,015 |
|---|
Dec 19 | $14,123 | $13,018 | $14,311 |
|---|
Jan 20 | $13,915 | $13,013 | $14,108 |
|---|
Feb 20 | $12,911 | $11,942 | $13,095 |
|---|
Mar 20 | $11,253 | $10,467 | $11,442 |
|---|
Apr 20 | $12,819 | $11,808 | $13,042 |
|---|
May 20 | $13,372 | $12,371 | $13,601 |
|---|
Jun 20 | $13,415 | $12,617 | $13,654 |
|---|
Jul 20 | $13,740 | $13,328 | $13,990 |
|---|
Aug 20 | $14,565 | $14,286 | $14,840 |
|---|
Sep 20 | $14,017 | $13,743 | $14,287 |
|---|
Oct 20 | $13,629 | $13,378 | $13,896 |
|---|
Nov 20 | $15,670 | $14,842 | $15,981 |
|---|
Dec 20 | $16,125 | $15,413 | $16,470 |
|---|
Jan 21 | $16,031 | $15,257 | $16,375 |
|---|
Feb 21 | $17,003 | $15,678 | $17,376 |
|---|
Mar 21 | $18,001 | $16,365 | $18,408 |
|---|
Apr 21 | $18,767 | $17,238 | $19,203 |
|---|
May 21 | $19,046 | $17,358 | $19,504 |
|---|
Jun 21 | $19,256 | $17,764 | $19,727 |
|---|
Jul 21 | $19,629 | $18,186 | $20,120 |
|---|
Aug 21 | $19,897 | $18,739 | $20,407 |
|---|
Sep 21 | $19,062 | $17,867 | $19,557 |
|---|
Oct 21 | $19,755 | $19,119 | $20,279 |
|---|
Nov 21 | $19,088 | $18,986 | $19,605 |
|---|
Dec 21 | $20,002 | $19,837 | $20,556 |
|---|
Jan 22 | $19,537 | $18,811 | $20,089 |
|---|
Feb 22 | $19,310 | $18,248 | $19,867 |
|---|
Mar 22 | $19,620 | $18,925 | $20,187 |
|---|
Apr 22 | $18,146 | $17,275 | $18,682 |
|---|
May 22 | $18,134 | $17,306 | $18,680 |
|---|
Jun 22 | $16,773 | $15,878 | $17,283 |
|---|
Jul 22 | $18,408 | $17,342 | $18,991 |
|---|
Aug 22 | $17,501 | $16,635 | $18,064 |
|---|
Sep 22 | $15,770 | $15,103 | $16,276 |
|---|
Oct 22 | $16,827 | $16,325 | $17,378 |
|---|
Nov 22 | $18,289 | $17,238 | $18,902 |
|---|
Dec 22 | $17,277 | $16,245 | $17,867 |
|---|
Jan 23 | $19,302 | $17,265 | $19,972 |
|---|
Feb 23 | $18,771 | $16,844 | $19,428 |
|---|
Mar 23 | $19,641 | $17,462 | $20,337 |
|---|
Apr 23 | $19,826 | $17,735 | $20,544 |
|---|
May 23 | $19,900 | $17,812 | $20,629 |
|---|
Jun 23 | $21,208 | $18,989 | $21,998 |
|---|
Jul 23 | $22,124 | $19,599 | $22,962 |
|---|
Aug 23 | $21,320 | $19,287 | $22,137 |
|---|
Sep 23 | $20,158 | $18,367 | $20,933 |
|---|
Oct 23 | $19,209 | $17,981 | $19,952 |
|---|
Nov 23 | $21,101 | $19,623 | $21,932 |
|---|
Dec 23 | $22,747 | $20,515 | $23,657 |
|---|
Jan 24 | $22,332 | $20,860 | $23,243 |
|---|
Feb 24 | $23,267 | $21,973 | $24,233 |
|---|
Mar 24 | $24,097 | $22,680 | $25,104 |
|---|
Apr 24 | $22,894 | $21,754 | $23,859 |
|---|
May 24 | $23,225 | $22,833 | $24,211 |
|---|
Jun 24 | $23,218 | $23,652 | $24,221 |
|---|
Jul 24 | $24,470 | $23,940 | $25,538 |
|---|
Aug 24 | $25,525 | $24,521 | $26,669 |
|---|
Sep 24 | $25,968 | $25,044 | $27,146 |
|---|
Oct 24 | $25,236 | $24,817 | $26,395 |
|---|
Nov 24 | $26,369 | $26,274 | $27,571 |
|---|
Dec 24 | $25,167 | $25,648 | $26,329 |
|---|
Jan 25 | $25,935 | $26,362 | $27,150 |
|---|
Feb 25 | $24,942 | $26,018 | $26,124 |
|---|
Mar 25 | $23,879 | $24,552 | $25,018 |
|---|
Apr 25 | $23,366 | $24,385 | $24,494 |
|---|
May 25 | $24,336 | $25,920 | $25,527 |
|---|
Jun 25 | $25,454 | $27,239 | $26,715 |
|---|
Jul 25 | $26,269 | $27,850 | $27,583 |
|---|
Aug 25 | $26,703 | $28,414 | $28,047 |
|---|
Sep 25 | $26,897 | $29,452 | $28,264 |
|---|
Oct 25 | $27,596 | $30,141 | $29,015 |
|---|
Nov 25 | $28,007 | $30,215 | $29,460 |
|---|
Dec 25 | $28,468 | $30,233 | $29,963 |
|---|
|
|
| Average Annual Return [Table Text Block] |
Average Annual Total Returns . | 1 Year | 5 Years | Life* |
|---|
Class I | 13.12% | 12.04% | 13.70% |
|---|
Morningstar® Wide Moat Focus Index | 13.80% | 12.71% | 14.41% |
|---|
S&P 500 Index | 17.88% | 14.42% | 14.54% |
|---|
* Inception of Fund: 11/06/2017. The performance data quoted represents past performance. Past performance is no guarantee of future results. Performance information for the Fund may reflect temporary fee waivers, if applicable. These returns do not reflect the deduction of taxes that a shareholder would pay on Fund dividends and distributions or the sale of Fund shares. Visit vaneck.com for more recent performance information. |
|
| Performance Inception Date |
Nov. 06, 2017
|
|
| No Deduction of Taxes [Text Block] |
|
|
| Performance Table Market Index Changed [Text Block] |
|
|
| Material Change Description [Text Block] |
|
|
| Updated Performance Information Location [Text Block] |
|
|
| AssetsNet |
$ 34,673,642
|
|
| Holdings Count | Holding |
56
|
|
| Advisory Fees Paid, Amount |
$ 0
|
|
| InvestmentCompanyPortfolioTurnover |
85.00%
|
|
| Additional Fund Statistics [Text Block] |
- Total Net Assets$34,673,642
- Number of Portfolio Holdings56
- Portfolio Turnover Rate85%
- Advisory Fees Paid$-
|
|
| Additional Fund Statistics Significance or Limits [Text Block] |
|
|
| Holdings [Text Block] |
Portfolio Composition (% of Total Net Assets)Value | Value | Value |
|---|
Liabilities in excess of other assets | | 0.0%Footnote Reference* | Other Investments | | 0.2% | Communication Services | | 2.5% | Financials | | 6.3% | Consumer Discretionary | | 7.6% | Consumer Staples | | 16.7% | Health Care | | 18.5% | Industrials | | 23.7% | Information Technology | | 24.5% |
| Footnote | Description | Footnote* | Amount is less than 0.05% |
|
|
| Largest Holdings [Text Block] |
Top Ten Holdings (% of Total Net Assets)Huntington Ingalls Industries, Inc. | | 2.8% |
|---|
Airbnb, Inc. | | 2.7% |
|---|
Estee Lauder Cos, Inc. | | 2.7% |
|---|
Bristol-Myers Squibb Co. | | 2.7% |
|---|
United Parcel Service, Inc. | | 2.7% |
|---|
Danaher Corp. | | 2.7% |
|---|
IDEX Corp. | | 2.6% |
|---|
Salesforce, Inc. | | 2.5% |
|---|
GE HealthCare Technologies, Inc. | | 2.5% |
|---|
Adobe, Inc. | | 2.5% |
|---|
|
|
| Material Fund Change [Text Block] |
|
|
| Summary of Change Legend [Text Block] |
|
|
| Updated Prospectus Web Address |
<span style="box-sizing: border-box; color: rgb(0, 0, 0); display: inline; flex-wrap: nowrap; font-size: 10.6667px; font-weight: 400; grid-area: auto; line-height: 16px; margin: 0px; overflow: visible; text-align: left; text-align-last: auto; white-space-collapse: preserve-breaks;">https://www.vaneck.com/us/en/etf-mutual-fund-finder/mutual-funds/documents/</span>
|
|
| Accountant Change Statement [Text Block] |
|
|
| Accountant Change Disagreements [Text Block] |
|
|
| C000195046 |
|
|
| Shareholder Report [Line Items] |
|
|
| Fund Name |
VanEck Morningstar Wide Moat Fund
|
|
| Class Name |
Class Z
|
|
| Trading Symbol |
MWMZX
|
|
| Annual or Semi-Annual Statement [Text Block] |
This annual shareholder report contains important information about the VanEck Morningstar Wide Moat Fund (the "Fund") for the period January 1, 2025 to December 31, 2025.
|
|
| Shareholder Report Annual or Semi-Annual |
Annual Shareholder Report
|
|
| Additional Information [Text Block] |
You can find additional information about the Fund at https://www.vaneck.com/us/en/etf-mutual-fund-finder/mutual-funds/documents/. You can also request this information by contacting us at 800.826.2333 or info@vaneck.com.
|
|
| Additional Information Phone Number |
800.826.2333
|
|
| Additional Information Email |
<span style="box-sizing: border-box; color: rgb(0, 0, 0); display: inline; flex-wrap: nowrap; font-size: 10.6667px; font-weight: 400; grid-area: auto; line-height: 16px; margin: 0px; overflow: visible; text-align: left; text-align-last: auto; white-space-collapse: preserve-breaks;">info@vaneck.com</span>
|
|
| Additional Information Website |
<span style="box-sizing: border-box; color: rgb(0, 0, 0); display: inline; flex-wrap: nowrap; font-size: 10.6667px; font-weight: 400; grid-area: auto; line-height: 16px; margin: 0px; overflow: visible; text-align: left; text-align-last: auto; white-space-collapse: preserve-breaks;">https://www.vaneck.com/us/en/etf-mutual-fund-finder/mutual-funds/documents/</span>
|
|
| Expenses [Text Block] |
What were the Fund costs for the last year?(based on a hypothetical $10,000 investment) Class Name | Costs of a $10,000 investment | Costs paid as a % of a $10,000 investment |
|---|
Class Z | $53 | 0.49% |
|---|
|
|
| Expenses Paid, Amount |
$ 53
|
|
| Expense Ratio, Percent |
0.49%
|
|
| Factors Affecting Performance [Text Block] |
How did the Fund perform last year?The Fund posted positive performance for the period but faced some headwinds relative to broad-based market indexes due to its underweight to tech-oriented companies, particularly mega-cap tech companies. Despite its relative underweight, the technology sector contributed the most to the Fund’s performance during the period followed by industrials and healthcare stocks. The leading individual contributors were Huntington Ingalls Industries, Applied Materials, and Teradyne. The consumer defensive sector detracted the most during the period. The leading individual detractors were Constellation Brands and Brown-Forman, both global beverage manufacturers, and Bio-Rad Laboratories Inc.
|
|
| Performance Past Does Not Indicate Future [Text] |
The performance data quoted represents past performance. Past performance is no guarantee of future results.
|
|
| Line Graph [Table Text Block] |
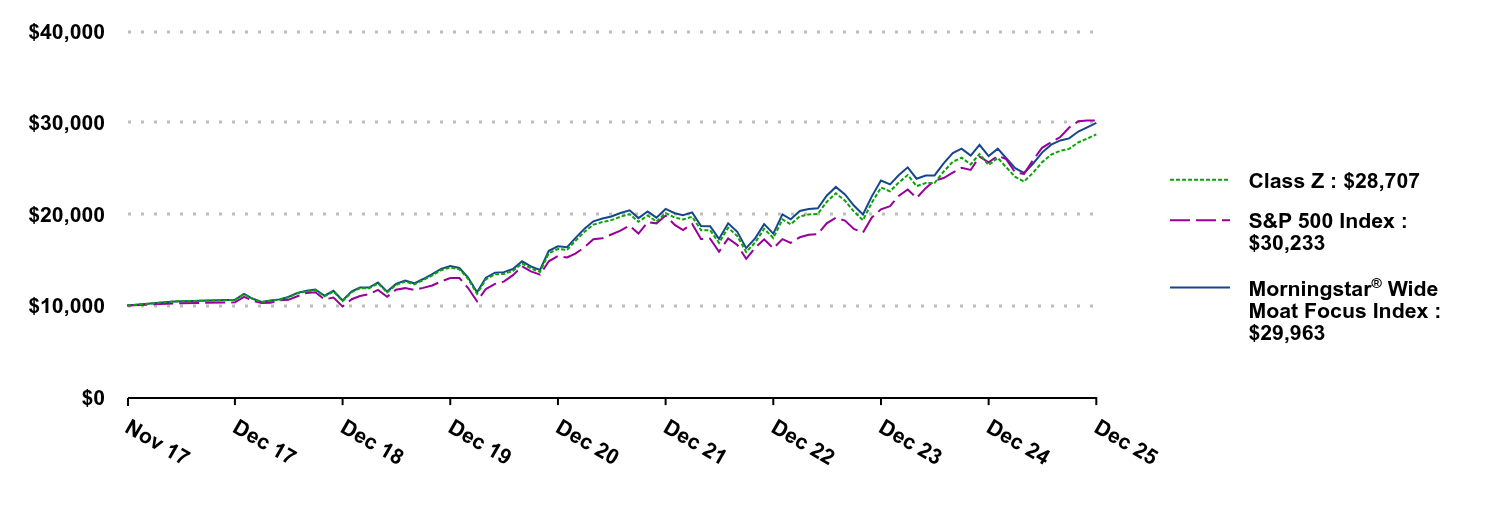 | Class Z | S&P 500 Index | Morningstar® Wide Moat Focus Index |
|---|
Nov 17 | $10,000 | $10,000 | $10,000 |
|---|
Nov 17 | $10,449 | $10,241 | $10,455 |
|---|
Dec 17 | $10,617 | $10,354 | $10,629 |
|---|
Jan 18 | $11,267 | $10,947 | $11,285 |
|---|
Feb 18 | $10,753 | $10,544 | $10,768 |
|---|
Mar 18 | $10,374 | $10,276 | $10,392 |
|---|
Apr 18 | $10,517 | $10,315 | $10,545 |
|---|
May 18 | $10,645 | $10,564 | $10,677 |
|---|
Jun 18 | $10,892 | $10,629 | $10,939 |
|---|
Jul 18 | $11,339 | $11,024 | $11,389 |
|---|
Aug 18 | $11,554 | $11,383 | $11,610 |
|---|
Sep 18 | $11,689 | $11,448 | $11,754 |
|---|
Oct 18 | $11,016 | $10,666 | $11,078 |
|---|
Nov 18 | $11,538 | $10,883 | $11,612 |
|---|
Dec 18 | $10,487 | $9,901 | $10,550 |
|---|
Jan 19 | $11,473 | $10,694 | $11,547 |
|---|
Feb 19 | $11,888 | $11,037 | $11,969 |
|---|
Mar 19 | $11,880 | $11,252 | $11,966 |
|---|
Apr 19 | $12,423 | $11,707 | $12,522 |
|---|
May 19 | $11,433 | $10,963 | $11,524 |
|---|
Jun 19 | $12,252 | $11,736 | $12,358 |
|---|
Jul 19 | $12,611 | $11,905 | $12,725 |
|---|
Aug 19 | $12,318 | $11,716 | $12,432 |
|---|
Sep 19 | $12,777 | $11,935 | $12,903 |
|---|
Oct 19 | $13,303 | $12,194 | $13,442 |
|---|
Nov 19 | $13,863 | $12,636 | $14,015 |
|---|
Dec 19 | $14,160 | $13,018 | $14,311 |
|---|
Jan 20 | $13,953 | $13,013 | $14,108 |
|---|
Feb 20 | $12,948 | $11,942 | $13,095 |
|---|
Mar 20 | $11,284 | $10,467 | $11,442 |
|---|
Apr 20 | $12,860 | $11,808 | $13,042 |
|---|
May 20 | $13,411 | $12,371 | $13,601 |
|---|
Jun 20 | $13,460 | $12,617 | $13,654 |
|---|
Jul 20 | $13,785 | $13,328 | $13,990 |
|---|
Aug 20 | $14,612 | $14,286 | $14,840 |
|---|
Sep 20 | $14,066 | $13,743 | $14,287 |
|---|
Oct 20 | $13,677 | $13,378 | $13,896 |
|---|
Nov 20 | $15,725 | $14,842 | $15,981 |
|---|
Dec 20 | $16,185 | $15,413 | $16,470 |
|---|
Jan 21 | $16,089 | $15,257 | $16,375 |
|---|
Feb 21 | $17,066 | $15,678 | $17,376 |
|---|
Mar 21 | $18,069 | $16,365 | $18,408 |
|---|
Apr 21 | $18,844 | $17,238 | $19,203 |
|---|
May 21 | $19,126 | $17,358 | $19,504 |
|---|
Jun 21 | $19,335 | $17,764 | $19,727 |
|---|
Jul 21 | $19,708 | $18,186 | $20,120 |
|---|
Aug 21 | $19,986 | $18,739 | $20,407 |
|---|
Sep 21 | $19,148 | $17,867 | $19,557 |
|---|
Oct 21 | $19,842 | $19,119 | $20,279 |
|---|
Nov 21 | $19,174 | $18,986 | $19,605 |
|---|
Dec 21 | $20,094 | $19,837 | $20,556 |
|---|
Jan 22 | $19,626 | $18,811 | $20,089 |
|---|
Feb 22 | $19,401 | $18,248 | $19,867 |
|---|
Mar 22 | $19,711 | $18,925 | $20,187 |
|---|
Apr 22 | $18,233 | $17,275 | $18,682 |
|---|
May 22 | $18,227 | $17,306 | $18,680 |
|---|
Jun 22 | $16,858 | $15,878 | $17,283 |
|---|
Jul 22 | $18,507 | $17,342 | $18,991 |
|---|
Aug 22 | $17,594 | $16,635 | $18,064 |
|---|
Sep 22 | $15,855 | $15,103 | $16,276 |
|---|
Oct 22 | $16,919 | $16,325 | $17,378 |
|---|
Nov 22 | $18,391 | $17,238 | $18,902 |
|---|
Dec 22 | $17,378 | $16,245 | $17,867 |
|---|
Jan 23 | $19,412 | $17,265 | $19,972 |
|---|
Feb 23 | $18,876 | $16,844 | $19,428 |
|---|
Mar 23 | $19,757 | $17,462 | $20,337 |
|---|
Apr 23 | $19,947 | $17,735 | $20,544 |
|---|
May 23 | $20,022 | $17,812 | $20,629 |
|---|
Jun 23 | $21,337 | $18,989 | $21,998 |
|---|
Jul 23 | $22,266 | $19,599 | $22,962 |
|---|
Aug 23 | $21,459 | $19,287 | $22,137 |
|---|
Sep 23 | $20,286 | $18,367 | $20,933 |
|---|
Oct 23 | $19,330 | $17,981 | $19,952 |
|---|
Nov 23 | $21,242 | $19,623 | $21,932 |
|---|
Dec 23 | $22,896 | $20,515 | $23,657 |
|---|
Jan 24 | $22,485 | $20,860 | $23,243 |
|---|
Feb 24 | $23,430 | $21,973 | $24,233 |
|---|
Mar 24 | $24,258 | $22,680 | $25,104 |
|---|
Apr 24 | $23,055 | $21,754 | $23,859 |
|---|
May 24 | $23,386 | $22,833 | $24,211 |
|---|
Jun 24 | $23,386 | $23,652 | $24,221 |
|---|
Jul 24 | $24,640 | $23,940 | $25,538 |
|---|
Aug 24 | $25,714 | $24,521 | $26,669 |
|---|
Sep 24 | $26,161 | $25,044 | $27,146 |
|---|
Oct 24 | $25,426 | $24,817 | $26,395 |
|---|
Nov 24 | $26,565 | $26,274 | $27,571 |
|---|
Dec 24 | $25,354 | $25,648 | $26,329 |
|---|
Jan 25 | $26,134 | $26,362 | $27,150 |
|---|
Feb 25 | $25,131 | $26,018 | $26,124 |
|---|
Mar 25 | $24,064 | $24,552 | $25,018 |
|---|
Apr 25 | $23,546 | $24,385 | $24,494 |
|---|
May 25 | $24,533 | $25,920 | $25,527 |
|---|
Jun 25 | $25,664 | $27,239 | $26,715 |
|---|
Jul 25 | $26,484 | $27,850 | $27,583 |
|---|
Aug 25 | $26,922 | $28,414 | $28,047 |
|---|
Sep 25 | $27,121 | $29,452 | $28,264 |
|---|
Oct 25 | $27,830 | $30,141 | $29,015 |
|---|
Nov 25 | $28,244 | $30,215 | $29,460 |
|---|
Dec 25 | $28,707 | $30,233 | $29,963 |
|---|
|
|
| Average Annual Return [Table Text Block] |
Average Annual Total Returns . | 1 Year | 5 Years | Life* |
|---|
Class Z | 13.23% | 12.14% | 13.81% |
|---|
Morningstar® Wide Moat Focus Index | 13.80% | 12.71% | 14.41% |
|---|
S&P 500 Index | 17.88% | 14.42% | 14.54% |
|---|
* Inception of Fund: 11/06/2017. The performance data quoted represents past performance. Past performance is no guarantee of future results. Performance information for the Fund may reflect temporary fee waivers, if applicable. These returns do not reflect the deduction of taxes that a shareholder would pay on Fund dividends and distributions or the sale of Fund shares. Visit vaneck.com for more recent performance information. |
|
| Performance Inception Date |
Nov. 06, 2017
|
|
| No Deduction of Taxes [Text Block] |
|
|
| Performance Table Market Index Changed [Text Block] |
|
|
| Material Change Description [Text Block] |
|
|
| Updated Performance Information Location [Text Block] |
|
|
| AssetsNet |
$ 34,673,642
|
|
| Holdings Count | Holding |
56
|
|
| Advisory Fees Paid, Amount |
$ 0
|
|
| InvestmentCompanyPortfolioTurnover |
85.00%
|
|
| Additional Fund Statistics [Text Block] |
- Total Net Assets$34,673,642
- Number of Portfolio Holdings56
- Portfolio Turnover Rate85%
- Advisory Fees Paid$-
|
|
| Additional Fund Statistics Significance or Limits [Text Block] |
|
|
| Holdings [Text Block] |
Portfolio Composition (% of Total Net Assets)Value | Value | Value |
|---|
Liabilities in excess of other assets | | 0.0%Footnote Reference* | Other Investments | | 0.2% | Communication Services | | 2.5% | Financials | | 6.3% | Consumer Discretionary | | 7.6% | Consumer Staples | | 16.7% | Health Care | | 18.5% | Industrials | | 23.7% | Information Technology | | 24.5% |
| Footnote | Description | Footnote* | Amount is less than 0.05% |
|
|
| Largest Holdings [Text Block] |
Top Ten Holdings (% of Total Net Assets)Huntington Ingalls Industries, Inc. | | 2.8% |
|---|
Airbnb, Inc. | | 2.7% |
|---|
Estee Lauder Cos, Inc. | | 2.7% |
|---|
Bristol-Myers Squibb Co. | | 2.7% |
|---|
United Parcel Service, Inc. | | 2.7% |
|---|
Danaher Corp. | | 2.7% |
|---|
IDEX Corp. | | 2.6% |
|---|
Salesforce, Inc. | | 2.5% |
|---|
GE HealthCare Technologies, Inc. | | 2.5% |
|---|
Adobe, Inc. | | 2.5% |
|---|
|
|
| Material Fund Change [Text Block] |
|
|
| Summary of Change Legend [Text Block] |
|
|
| Updated Prospectus Web Address |
<span style="box-sizing: border-box; color: rgb(0, 0, 0); display: inline; flex-wrap: nowrap; font-size: 10.6667px; font-weight: 400; grid-area: auto; line-height: 16px; margin: 0px; overflow: visible; text-align: left; text-align-last: auto; white-space-collapse: preserve-breaks;">https://www.vaneck.com/us/en/etf-mutual-fund-finder/mutual-funds/documents/</span>
|
|
| Accountant Change Statement [Text Block] |
|
|
| Accountant Change Disagreements [Text Block] |
|
|
| C000259178 |
|
|
| Shareholder Report [Line Items] |
|
|
| Fund Name |
VanEck Onchain Economy ETF
|
|
| Class Name |
VanEck Onchain Economy ETF
|
|
| Trading Symbol |
NODE
|
|
| Security Exchange Name |
CboeBZX
|
|
| Annual or Semi-Annual Statement [Text Block] |
This annual shareholder report contains important information about the VanEck Onchain Economy ETF (the "Fund") for the period May 13, 2025 (inception of Fund) to December 31, 2025.
|
|
| Shareholder Report Annual or Semi-Annual |
Annual Shareholder Report
|
|
| Additional Information [Text Block] |
You can find additional information about the Fund at https://www.vaneck.com/us/en/etf-mutual-fund-finder/etfs/documents/. You can also request this information by contacting us at 800.826.2333 or info@vaneck.com.
|
|
| Additional Information Phone Number |
800.826.2333
|
|
| Additional Information Email |
<span style="box-sizing: border-box; color: rgb(0, 0, 0); display: inline; flex-wrap: nowrap; font-size: 10.6667px; font-weight: 400; grid-area: auto; line-height: 16px; margin: 0px; overflow: visible; text-align: left; text-align-last: auto; white-space-collapse: preserve-breaks;">info@vaneck.com</span>
|
|
| Additional Information Website |
<span style="box-sizing: border-box; color: rgb(0, 0, 0); display: inline; flex-wrap: nowrap; font-size: 10.6667px; font-weight: 400; grid-area: auto; line-height: 16px; margin: 0px; overflow: visible; text-align: left; text-align-last: auto; white-space-collapse: preserve-breaks;">https://www.vaneck.com/us/en/etf-mutual-fund-finder/etfs/documents/</span>
|
|
| Expenses [Text Block] |
What were the Fund costs for the period?(based on a hypothetical $10,000 investment) Fund Name | Costs of a $10,000 investment | Costs paid as a % of a $10,000 investment |
|---|
VanEck Onchain Economy ETF | $50Footnote Reference(a) | 0.67%Footnote Reference(b) |
|---|
| Footnote | Description | Footnote(a) | Expenses for a full year would be higher than the amount shown. | Footnote(b) | Annualized |
|
|
| Expenses Paid, Amount |
$ 50
|
[1] |
| Expense Ratio, Percent |
0.67%
|
[2] |
| Factors Affecting Performance [Text Block] |
How did the Fund perform during the period?The onchain economy delivered a strong year overall during the period from the Fund’s inception through year-end, despite intermittent market volatility. Performance was supported by generally positive trends across digital asset–related equities and continued investment in companies enabling blockchain adoption and digital infrastructure. The Fund’s largest individual contributors were Cipher Mining Inc. and IREN Ltd. Both companies benefited from improving bitcoin mining economics and investor demand for large-scale, vertically integrated digital infrastructure platforms, supported by access to power, efficient operations, and expanding data center capacity tied to digital asset activity. Strategy Inc. was the largest detractor as digital asset treasury companies saw a pullback during the second half of 2025 due to bitcoin’s price fall. At the sector level, Financial Services contributed the most to Fund performance, followed by Technology and Utilities. These sectors reflected strength across companies supporting digital asset markets, infrastructure, and related services.
|
|
| Performance Past Does Not Indicate Future [Text] |
The performance data quoted represents past performance. Past performance is no guarantee of future results.
|
|
| Line Graph [Table Text Block] |
| Fund | MSCI ACWI Index | MVIS® Global Digital Assets Equity Index |
|---|
May-25 | $10,000 | $10,000 | $10,000 |
|---|
May-25 | $9,935 | $10,109 | $10,072 |
|---|
Jun-25 | $11,407 | $10,563 | $12,828 |
|---|
Jul-25 | $11,891 | $10,706 | $13,557 |
|---|
Aug-25 | $12,800 | $10,970 | $13,879 |
|---|
Sep-25 | $15,372 | $11,368 | $16,896 |
|---|
Oct-25 | $17,040 | $11,622 | $18,774 |
|---|
Nov-25 | $14,830 | $11,621 | $15,065 |
|---|
Dec-25 | $13,222 | $11,742 | $12,879 |
|---|
|
|
| Average Annual Return [Table Text Block] |
Average Annual Total Returns . | Life* |
|---|
VanEck Onchain Economy ETF | 32.22% |
|---|
MVIS® Global Digital Assets Equity Index | 28.79% |
|---|
MSCI ACWI Index | 17.42% |
|---|
* Inception of Fund: 05/13/2025. Returns are not annualized. The performance data quoted represents past performance. Past performance is no guarantee of future results. Performance information for the Fund may reflect temporary fee waivers, if applicable. These returns do not reflect the deduction of taxes that a shareholder would pay on Fund dividends and distributions or the sale of Fund shares. Visit vaneck.com for more recent performance information. |
|
| Performance Inception Date |
May 13, 2025
|
|
| No Deduction of Taxes [Text Block] |
|
|
| Performance Table Market Index Changed [Text Block] |
|
|
| Material Change Description [Text Block] |
|
|
| Updated Performance Information Location [Text Block] |
|
|
| AssetsNet |
$ 49,559,612
|
|
| Holdings Count | Holding |
62
|
|
| Advisory Fees Paid, Amount |
$ 125,467
|
|
| InvestmentCompanyPortfolioTurnover |
81.00%
|
|
| Additional Fund Statistics [Text Block] |
- Total Net Assets$49,559,612
- Number of Portfolio Holdings62
- Portfolio Turnover Rate81%
- Advisory Fees Paid$125,467
|
|
| Additional Fund Statistics Significance or Limits [Text Block] |
|
|
| Holdings [Text Block] |
Portfolio Composition (% of Total Net Assets)Value | Value | Value |
|---|
Other assets less liabilities | | 0.2% | Other Investments | | 0.8% | Real Estate | | 1.1% | Industrials | | 3.0% | Energy | | 3.4% | Consumer Discretionary | | 5.3% | Utilities | | 10.6% | Crypto ETPs | | 14.8% | Financials | | 15.0% | Information Technology | | 45.8% |
|
|
| Largest Holdings [Text Block] |
Top Ten Holdings (% of Total Net Assets)VanEck Bitcoin ETF | | 12.0% |
|---|
IREN Ltd. | | 4.7% |
|---|
Cipher Mining, Inc. | | 4.6% |
|---|
Terawulf, Inc. | | 4.2% |
|---|
Core Scientific, Inc. | | 3.5% |
|---|
Applied Digital Corp. | | 3.3% |
|---|
Hut 8 Corp. | | 3.1% |
|---|
Figure Technology Solutions, Inc. | | 2.5% |
|---|
Galaxy Digital, Inc. | | 2.4% |
|---|
Robinhood Markets, Inc. | | 2.2% |
|---|
|
|
| Material Fund Change [Text Block] |
|
|
| Summary of Change Legend [Text Block] |
|
|
| Updated Prospectus Web Address |
<span style="box-sizing: border-box; color: rgb(0, 0, 0); display: inline; flex-wrap: nowrap; font-size: 10.6667px; font-weight: 400; grid-area: auto; line-height: 16px; margin: 0px; overflow: visible; text-align: left; text-align-last: auto; white-space-collapse: preserve-breaks;">https://www.vaneck.com/us/en/etf-mutual-fund-finder/etfs/documents/</span>
|
|
| Accountant Change Statement [Text Block] |
|
|
| Accountant Change Disagreements [Text Block] |
|
|
|
|