VII. PAY VERSUS PERFORMANCE
As required by Section 953(a) of the Dodd-Frank Wall Street Reform and Consumer Protection Act and Item 402(v) of Regulation S-K, the following information is provided regarding the relationship between the “compensation actually paid” (“CAP”) to the NEOs during the preceding five fiscal years, and the Company’s TSR, Net Income, and also Adjusted EBITDA, which in the Company’s assessment represents the most important financial performance measure (that is not otherwise required to be disclosed in the first table below) used by the Company to link the CAP of the NEOs for 2025 to its performance. In this section, ("PEO") means Principal Executive Officer, and ("SCT") means Summary Compensation Table.
|
|
|
|
|
Value of Initial Fixed $100 |
|
|
|
|
|
|
|
|
Investment Based On: |
|
|
|
YEAR |
SCT Total for Current PEO ($) |
Compensation Actually Paid for Current PEO ($)(1) |
Average SCT Total for Non-PEO NEOs ($) |
Average Compensation Actually Paid to Non-PEO NEOs ($)(1) |
Manitowoc |
Peer Group TSR ($) |
Net Income |
Adjusted EBITDA |
2025 |
$5,052,437 |
$7,820,118 |
$1,383,015 |
$1,849,197 |
$90.08 |
$134.23 |
$7.2 |
$121.7 |
2024 |
$5,177,885 |
($396,591) |
$1,338,002 |
$517,809 |
$68.60 |
$119.00 |
$55.8 |
$128.4 |
2023 |
$6,698,208 |
$11,925,536 |
$1,724,851 |
$2,367,435 |
$125.39 |
$106.71 |
$39.2 |
$175.3 |
2022 |
$5,576,471 |
$2,520,833 |
$1,147,526 |
$218,946 |
$68.82 |
$91.30 |
($123.6) |
$143.1 |
2021 |
$4,952,777 |
$5,379,695 |
$1,823,565 |
$1,969,093 |
$139.67 |
$114.78 |
$11.0 |
$116.0 |
YEAR |
CURRENT PEO |
NON-PEO NEOS |
2025 |
Aaron H. Ravenscroft |
Brian P. Regan; Leslie L. Middleton; Jennifer L. Peterson; James Cook |
2024 |
Aaron H. Ravenscroft |
Brian P. Regan; Leslie L. Middleton; Jennifer L. Peterson; James Cook |
2023 |
Aaron H. Ravenscroft |
Brian P. Regan; Leslie L. Middleton; Jennifer L. Peterson; James Cook |
2022 |
Aaron H. Ravenscroft |
David J. Antoniuk; Thomas L. Doerr Jr.; Leslie L. Middleton; Terrance L. Collins |
2021 |
Aaron H. Ravenscroft |
David J. Antoniuk; Thomas L. Doerr Jr.; Leslie L. Middleton; Terrance L. Collins |
CURRENT PEO SCT TOTAL TO CAP RECONCILIATION
YEAR |
Reported SCT Total for PEO ($) |
Minus: |
Plus: |
Compensation Actually Paid to PEO |
2025 |
$5,052,437 |
$3,184,407 |
$5,952,088 |
$7,820,118 |
2024 |
$5,177,885 |
$3,684,622 |
($1,889,854) |
($396,591) |
2023 |
$6,698,208 |
$3,970,761 |
$9,198,089 |
$11,925,536 |
2022 |
$5,576,471 |
$3,484,556 |
$428,918 |
$2,520,833 |
2021 |
$4,952,777 |
$2,500,009 |
$2,926,927 |
$5,379,695 |
EQUITY RECONCILIATION DETAIL FOR CURRENT PEO
Equity Award Adjustments |
|||||
YEAR |
Year End Fair Value of Awards Granted in the Year ($) |
Year over Year Change in Fair Value of Outstanding and Unvested Awards ($) |
Year End Fair Value of Awards Granted in Prior Years Forfeited in the Year ($) |
Year over Year Change in Fair Value of Awards Granted in Prior Years that Vested in the Year ($) |
Total Equity Award Adjustments ($) |
2025 |
$5,098,179 |
$392,256 |
$0 |
$461,654 |
$5,952,088 |
2024 |
$2,162,314 |
($3,434,603) |
$0 |
($617,565) |
($1,889,854) |
2023 |
$4,755,247 |
$3,718,383 |
$0 |
$724,459 |
$9,198,089 |
2022 |
$1,750,374 |
($1,198,938) |
$0 |
($122,518) |
$428,918 |
2021 |
$2,751,917 |
$96,145 |
$0 |
$78,865 |
$2,926,927 |
AVERAGE NON-PEO SCT TOTAL TO CAP RECONCILIATION
YEAR |
Reported SCT Total for Non-PEO NEOs ($) |
Minus: |
Plus: |
Compensation |
2025 |
$1,383,015 |
$567,229 |
$1,033,411 |
$1,849,197 |
2024 |
$1,338,002 |
$656,327 |
($163,866) |
$517,809 |
2023 |
$1,724,851 |
$705,340 |
$1,347,925 |
$2,367,435 |
2022 |
$1,147,526 |
$480,034 |
($448,546) |
$218,946 |
2021 |
$1,823,565 |
$841,093 |
$986,621 |
$1,969,093 |
EQUITY RECONCILIATION DETAIL FOR NON-PEO NEO'S
Equity Award Adjustments |
|||||
YEAR |
Year End Fair Value of Awards Granted in the Year ($) |
Year over Year Change in Fair Value of Outstanding and Unvested Awards ($) |
Year End Fair Value of Awards Granted in Prior Years Forfeited in the Year ($) |
Year over Year Change in Fair Value of Awards Granted in Prior Years that Vested in the Year ($) |
Total Equity Award Adjustments ($) |
2025 |
$908,123 |
$69,594 |
$0 |
$55,694 |
$1,033,411 |
2024 |
$385,164 |
($474,597) |
$0 |
($74,433) |
($163,866) |
2023 |
$844,691 |
$413,650 |
$0 |
$89,584 |
$1,347,925 |
2022 |
$115,010 |
($259,049) |
($204,310) |
($100,197) |
($448,546) |
2021 |
$925,844 |
$63,699 |
$0 |
($2,922) |
$986,621 |
Most Important Performance Measures
The following performance measures represent the most important financial performance measures used by the Company to link compensation actually paid to its NEOs for 2025:
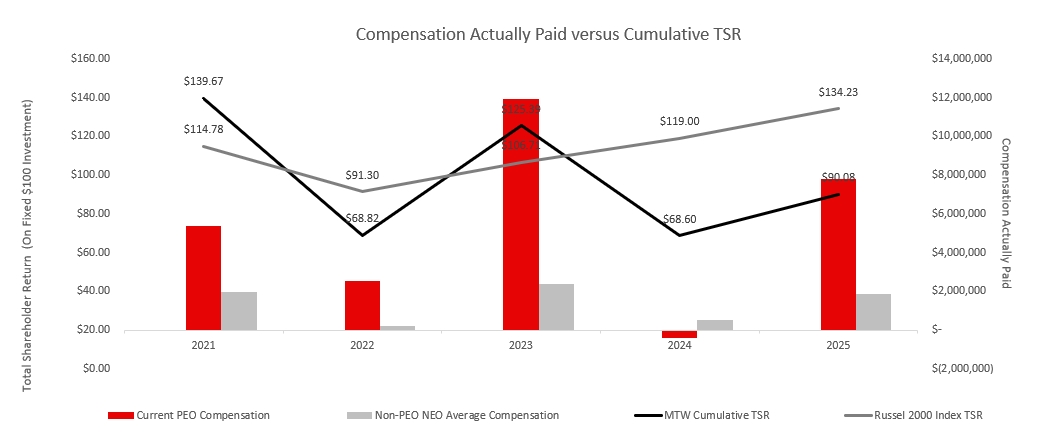
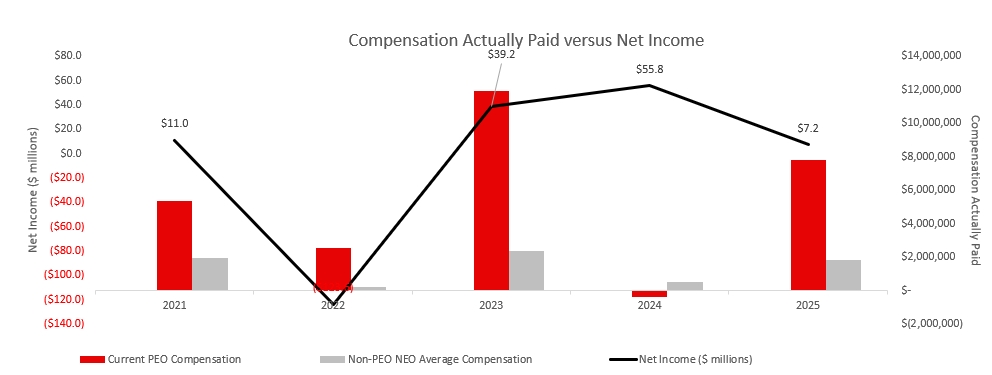
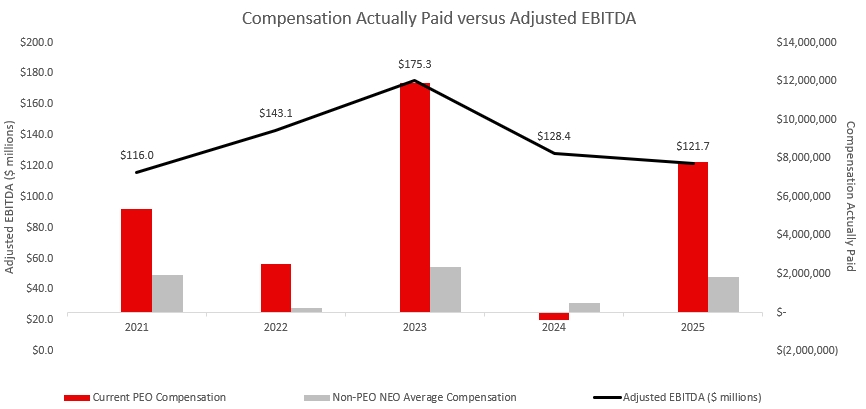
Relationship Between Financial Performance Measures
The graphs below depict the relationship between (i) the compensation actually paid to the Company's PEO and the average of the compensation actually paid to its remaining NEOs, and (ii) the Company's cumulative TSR, Peer Group TSR, Net Income, and Adjusted EBITDA, in each case, for the
fiscal years ended December 31, 2021, 2022, 2023, 2024 and 2025. TSR amounts reported in the graph assume an initial fixed investment of $100, and that all dividends, if any, were reinvested.
YEAR |
CURRENT PEO |
NON-PEO NEOS |
2025 |
Aaron H. Ravenscroft |
Brian P. Regan; Leslie L. Middleton; Jennifer L. Peterson; James Cook |
2024 |
Aaron H. Ravenscroft |
Brian P. Regan; Leslie L. Middleton; Jennifer L. Peterson; James Cook |
2023 |
Aaron H. Ravenscroft |
Brian P. Regan; Leslie L. Middleton; Jennifer L. Peterson; James Cook |
2022 |
Aaron H. Ravenscroft |
David J. Antoniuk; Thomas L. Doerr Jr.; Leslie L. Middleton; Terrance L. Collins |
2021 |
Aaron H. Ravenscroft |
David J. Antoniuk; Thomas L. Doerr Jr.; Leslie L. Middleton; Terrance L. Collins |
CURRENT PEO SCT TOTAL TO CAP RECONCILIATION
YEAR |
Reported SCT Total for PEO ($) |
Minus: |
Plus: |
Compensation Actually Paid to PEO |
2025 |
$5,052,437 |
$3,184,407 |
$5,952,088 |
$7,820,118 |
2024 |
$5,177,885 |
$3,684,622 |
($1,889,854) |
($396,591) |
2023 |
$6,698,208 |
$3,970,761 |
$9,198,089 |
$11,925,536 |
2022 |
$5,576,471 |
$3,484,556 |
$428,918 |
$2,520,833 |
2021 |
$4,952,777 |
$2,500,009 |
$2,926,927 |
$5,379,695 |
EQUITY RECONCILIATION DETAIL FOR CURRENT PEO
Equity Award Adjustments |
|||||
YEAR |
Year End Fair Value of Awards Granted in the Year ($) |
Year over Year Change in Fair Value of Outstanding and Unvested Awards ($) |
Year End Fair Value of Awards Granted in Prior Years Forfeited in the Year ($) |
Year over Year Change in Fair Value of Awards Granted in Prior Years that Vested in the Year ($) |
Total Equity Award Adjustments ($) |
2025 |
$5,098,179 |
$392,256 |
$0 |
$461,654 |
$5,952,088 |
2024 |
$2,162,314 |
($3,434,603) |
$0 |
($617,565) |
($1,889,854) |
2023 |
$4,755,247 |
$3,718,383 |
$0 |
$724,459 |
$9,198,089 |
2022 |
$1,750,374 |
($1,198,938) |
$0 |
($122,518) |
$428,918 |
2021 |
$2,751,917 |
$96,145 |
$0 |
$78,865 |
$2,926,927 |
AVERAGE NON-PEO SCT TOTAL TO CAP RECONCILIATION
YEAR |
Reported SCT Total for Non-PEO NEOs ($) |
Minus: |
Plus: |
Compensation |
2025 |
$1,383,015 |
$567,229 |
$1,033,411 |
$1,849,197 |
2024 |
$1,338,002 |
$656,327 |
($163,866) |
$517,809 |
2023 |
$1,724,851 |
$705,340 |
$1,347,925 |
$2,367,435 |
2022 |
$1,147,526 |
$480,034 |
($448,546) |
$218,946 |
2021 |
$1,823,565 |
$841,093 |
$986,621 |
$1,969,093 |
EQUITY RECONCILIATION DETAIL FOR NON-PEO NEO'S
Equity Award Adjustments |
|||||
YEAR |
Year End Fair Value of Awards Granted in the Year ($) |
Year over Year Change in Fair Value of Outstanding and Unvested Awards ($) |
Year End Fair Value of Awards Granted in Prior Years Forfeited in the Year ($) |
Year over Year Change in Fair Value of Awards Granted in Prior Years that Vested in the Year ($) |
Total Equity Award Adjustments ($) |
2025 |
$908,123 |
$69,594 |
$0 |
$55,694 |
$1,033,411 |
2024 |
$385,164 |
($474,597) |
$0 |
($74,433) |
($163,866) |
2023 |
$844,691 |
$413,650 |
$0 |
$89,584 |
$1,347,925 |
2022 |
$115,010 |
($259,049) |
($204,310) |
($100,197) |
($448,546) |
2021 |
$925,844 |
$63,699 |
$0 |
($2,922) |
$986,621 |
Most Important Performance Measures
The following performance measures represent the most important financial performance measures used by the Company to link compensation actually paid to its NEOs for 2025: