Pay vs Performance Disclosure - USD ($)
|
12 Months Ended |
Dec. 31, 2025 |
Dec. 31, 2024 |
Dec. 31, 2023 |
| Pay vs Performance Disclosure |
|
|
|
| Pay vs Performance Disclosure, Table |
| | | | | | | | | | | | | | | | | | | | | Year (a) | Summary Compensation Table Total for PEO(1)
(b) | Compensation Actually Paid to PEO (2)
(c) | Average Summary Compensation Table Total for Non-PEO Named Executive Officers (1) (d) | Average Compensation Actually Paid to Non-PEO Named Executive Officers (2)
(e) | Value of Initial Fixed $100 Investment Based On Total Shareholder Return (3)
(f) | Net Income (Loss) (in Thousands) (4)
(g) | | 2025 | $ | 1,076,423 | | $ | 1,177,128 | | $ | 840,096 | | $ | 912,828 | | $ | 27 | | $ | 1,365 | | | 2024 | $ | 1,187,267 | | $ | 972,942 | | $ | 945,368 | | $ | 887,046 | | $ | 28 | | $ | (25,915) | | | 2023 | $ | 1,716,461 | | $ | 937,268 | | $ | 1,469,494 | | $ | 1,017,054 | | $ | 46 | | $ | (36,666) | |
|
|
|
| Named Executive Officers, Footnote |
Compensation for our PEO, Orlando Zayas, reflects the amounts reported in the “Summary Compensation Table” for the respective years. Average compensation for non-PEOs includes the following NEOs for all of the respective years above: Nancy Walsh and Derek Medlin.
|
|
|
| PEO Total Compensation Amount |
$ 1,076,423
|
$ 1,187,267
|
$ 1,716,461
|
| PEO Actually Paid Compensation Amount |
$ 1,177,128
|
972,942
|
937,268
|
| Adjustment To PEO Compensation, Footnote |
Compensation “actually paid” for the PEO and average compensation “actually paid” for our non-PEO NEOs in the respective years reflect the respective amounts set forth in columns (b) and (d), adjusted as follows in the table below, as determined in accordance with SEC rules. These dollar amounts do not reflect the actual amount of compensation earned by or paid to the PEO and our other NEOs during the applicable year. | | | | | | | | | | | | | | | | | | | | | | PEO 2025 | PEO 2024 | PEO 2023 | Non-PEOs 2025 | Non-PEOs 2024 | Non-PEOs 2023 | | Summary Compensation Table Total | $ | 1,076,423 | | $ | 1,187,267 | | $ | 1,716,461 | | $ | 840,096 | | $ | 945,368 | | $ | 1,469,494 | | | Less Stock Award Value Reported in Summary Compensation Table for the Covered Year | $ | — | | $ | (410,222) | | $ | (463,644) | | $ | — | | $ | (332,820) | | $ | (610,817) | | | Plus Fair Value for Unvested Awards Granted in the Covered Year | $ | — | | $ | 179,273 | | $ | 230,686 | | | $ | 234,135 | | $ | 295,244 | | | Change in Fair Value of Outstanding Unvested Awards from Prior Years | $ | (4,733) | | $ | (97,457) | | $ | (346,885) | | $ | (4,223) | | $ | (67,417) | | $ | (86,917) | | | Plus Fair Value for Vested Awards Granted in the Covered Year | $ | — | | $ | — | | $ | — | | $ | — | | $ | — | | $ | — | | | Change in Fair Value of Awards from Prior Years that Vested in the Covered Year | $ | 105,438 | | $ | 114,081 | | $ | (199,350) | | $ | 76,955 | | $ | 107,780 | | $ | (49,950) | | | Less Fair Value of Awards Forfeited during the Covered Year | $ | — | | $ | — | | $ | — | | | $ | — | | | | Compensation Actually Paid | $ | 1,177,128 | | $ | 972,942 | | $ | 937,268 | | $ | 912,828 | | $ | 887,046 | | $ | 1,017,054 | |
Fair values set forth in the table above are computed in accordance with ASC 718 as of the end of the respective fiscal year, other than fair values of awards that vest in the covered year, which are valued as of the applicable vesting date.
|
|
|
| Non-PEO NEO Average Total Compensation Amount |
$ 840,096
|
945,368
|
1,469,494
|
| Non-PEO NEO Average Compensation Actually Paid Amount |
$ 912,828
|
887,046
|
1,017,054
|
| Adjustment to Non-PEO NEO Compensation Footnote |
Compensation “actually paid” for the PEO and average compensation “actually paid” for our non-PEO NEOs in the respective years reflect the respective amounts set forth in columns (b) and (d), adjusted as follows in the table below, as determined in accordance with SEC rules. These dollar amounts do not reflect the actual amount of compensation earned by or paid to the PEO and our other NEOs during the applicable year. | | | | | | | | | | | | | | | | | | | | | | PEO 2025 | PEO 2024 | PEO 2023 | Non-PEOs 2025 | Non-PEOs 2024 | Non-PEOs 2023 | | Summary Compensation Table Total | $ | 1,076,423 | | $ | 1,187,267 | | $ | 1,716,461 | | $ | 840,096 | | $ | 945,368 | | $ | 1,469,494 | | | Less Stock Award Value Reported in Summary Compensation Table for the Covered Year | $ | — | | $ | (410,222) | | $ | (463,644) | | $ | — | | $ | (332,820) | | $ | (610,817) | | | Plus Fair Value for Unvested Awards Granted in the Covered Year | $ | — | | $ | 179,273 | | $ | 230,686 | | | $ | 234,135 | | $ | 295,244 | | | Change in Fair Value of Outstanding Unvested Awards from Prior Years | $ | (4,733) | | $ | (97,457) | | $ | (346,885) | | $ | (4,223) | | $ | (67,417) | | $ | (86,917) | | | Plus Fair Value for Vested Awards Granted in the Covered Year | $ | — | | $ | — | | $ | — | | $ | — | | $ | — | | $ | — | | | Change in Fair Value of Awards from Prior Years that Vested in the Covered Year | $ | 105,438 | | $ | 114,081 | | $ | (199,350) | | $ | 76,955 | | $ | 107,780 | | $ | (49,950) | | | Less Fair Value of Awards Forfeited during the Covered Year | $ | — | | $ | — | | $ | — | | | $ | — | | | | Compensation Actually Paid | $ | 1,177,128 | | $ | 972,942 | | $ | 937,268 | | $ | 912,828 | | $ | 887,046 | | $ | 1,017,054 | |
Fair values set forth in the table above are computed in accordance with ASC 718 as of the end of the respective fiscal year, other than fair values of awards that vest in the covered year, which are valued as of the applicable vesting date.
|
|
|
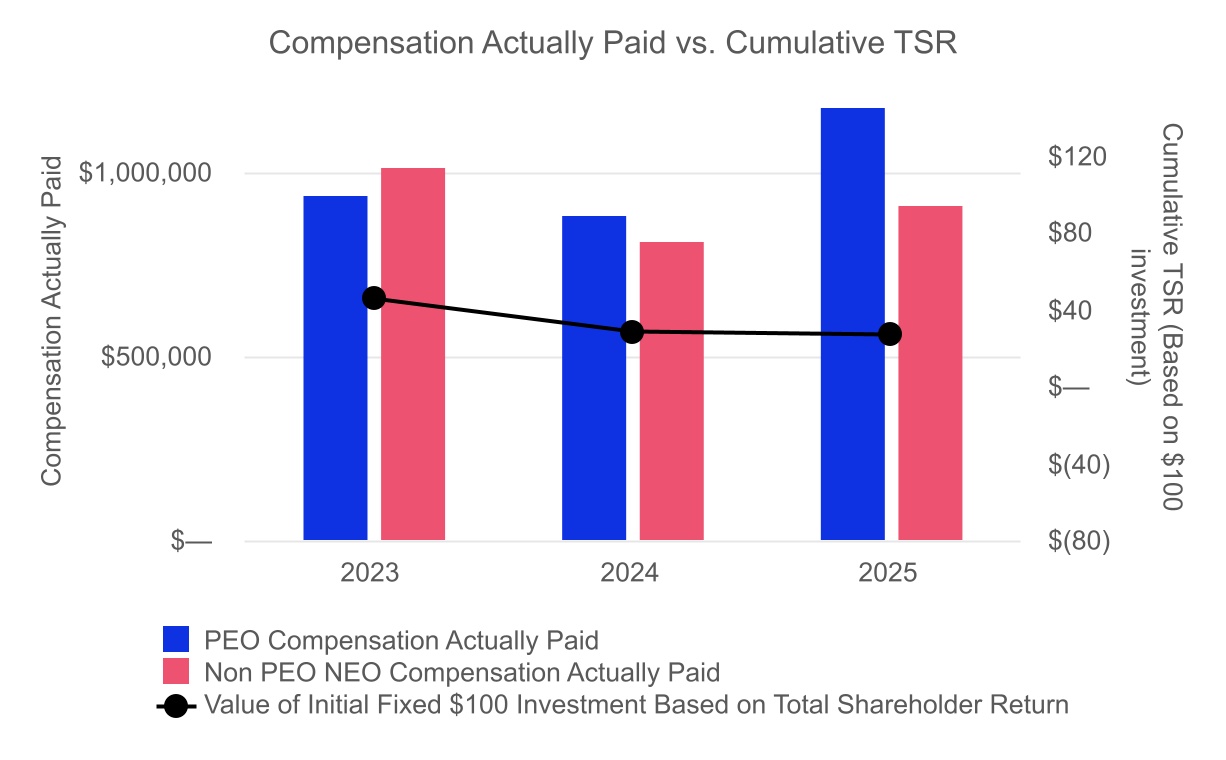
| Compensation Actually Paid vs. Total Shareholder Return |
TSR is cumulative for the measurement periods beginning on December 30, 2022, December 31, 2023 and ending on December 31 of each of 2024 and 2025, respectively, calculated in accordance with Item 201(e) of Regulation S-K. Note that in the 2024 proxy filed April 24, 2025, there was an error in the TSR calculation representing a negative number rather than the the value of the initial $100 investment. The following chart illustrates the relationship between CAP for our PEO and the average CAP for our Non-PEO NEOs against our cumulative TSR:
|
|
|
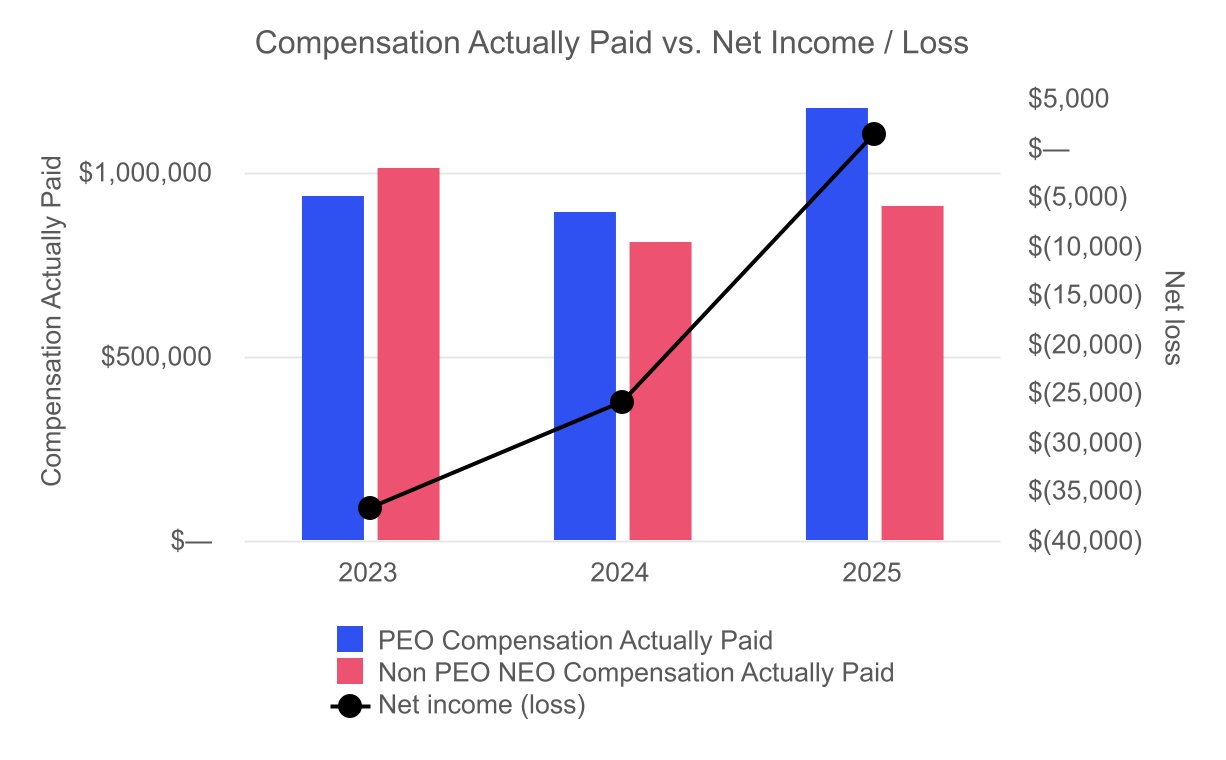
| Compensation Actually Paid vs. Net Income |
The following chart illustrates the CAP for our PEO and the average CAP for our Non-PEO NEOs against our net income /loss:
|
|
|
| Total Shareholder Return Amount |
$ 27
|
28
|
46
|
| Net Income (Loss) |
$ 1,365,000
|
(25,915,000)
|
(36,666,000)
|
| PEO Name |
Orlando Zayas
|
|
|
| Additional 402(v) Disclosure |
Reflects “Net Income” in the Company’s Consolidated Statements of Income included in the Company’s Annual Reports on Form 10-K for each of the years ended December 31, 2025 and December 31, 2024.
|
|
|
| PEO | Aggregate Grant Date Fair Value of Equity Award Amounts Reported in Summary Compensation Table |
|
|
|
| Pay vs Performance Disclosure |
|
|
|
| Adjustment to Compensation, Amount |
$ 0
|
(410,222)
|
(463,644)
|
| PEO | Year-end Fair Value of Equity Awards Granted in Covered Year that are Outstanding and Unvested |
|
|
|
| Pay vs Performance Disclosure |
|
|
|
| Adjustment to Compensation, Amount |
0
|
179,273
|
230,686
|
| PEO | Year-over-Year Change in Fair Value of Equity Awards Granted in Prior Years That are Outstanding and Unvested |
|
|
|
| Pay vs Performance Disclosure |
|
|
|
| Adjustment to Compensation, Amount |
(4,733)
|
(97,457)
|
(346,885)
|
| PEO | Vesting Date Fair Value of Equity Awards Granted and Vested in Covered Year |
|
|
|
| Pay vs Performance Disclosure |
|
|
|
| Adjustment to Compensation, Amount |
0
|
0
|
0
|
| PEO | Change in Fair Value as of Vesting Date of Prior Year Equity Awards Vested in Covered Year |
|
|
|
| Pay vs Performance Disclosure |
|
|
|
| Adjustment to Compensation, Amount |
105,438
|
114,081
|
(199,350)
|
| PEO | Dividends or Other Earnings Paid on Equity Awards not Otherwise Reflected in Total Compensation for Covered Year |
|
|
|
| Pay vs Performance Disclosure |
|
|
|
| Adjustment to Compensation, Amount |
0
|
0
|
0
|
| Non-PEO NEO | Aggregate Grant Date Fair Value of Equity Award Amounts Reported in Summary Compensation Table |
|
|
|
| Pay vs Performance Disclosure |
|
|
|
| Adjustment to Compensation, Amount |
0
|
(332,820)
|
(610,817)
|
| Non-PEO NEO | Year-end Fair Value of Equity Awards Granted in Covered Year that are Outstanding and Unvested |
|
|
|
| Pay vs Performance Disclosure |
|
|
|
| Adjustment to Compensation, Amount |
|
234,135
|
295,244
|
| Non-PEO NEO | Year-over-Year Change in Fair Value of Equity Awards Granted in Prior Years That are Outstanding and Unvested |
|
|
|
| Pay vs Performance Disclosure |
|
|
|
| Adjustment to Compensation, Amount |
(4,223)
|
(67,417)
|
(86,917)
|
| Non-PEO NEO | Vesting Date Fair Value of Equity Awards Granted and Vested in Covered Year |
|
|
|
| Pay vs Performance Disclosure |
|
|
|
| Adjustment to Compensation, Amount |
0
|
0
|
0
|
| Non-PEO NEO | Change in Fair Value as of Vesting Date of Prior Year Equity Awards Vested in Covered Year |
|
|
|
| Pay vs Performance Disclosure |
|
|
|
| Adjustment to Compensation, Amount |
76,955
|
107,780
|
(49,950)
|
| Non-PEO NEO | Dividends or Other Earnings Paid on Equity Awards not Otherwise Reflected in Total Compensation for Covered Year |
|
|
|
| Pay vs Performance Disclosure |
|
|
|
| Adjustment to Compensation, Amount |
|
$ 0
|
|