Pay vs Performance Disclosure - USD ($)
|
12 Months Ended |
Dec. 31, 2025 |
Dec. 31, 2024 |
Dec. 31, 2023 |
Dec. 31, 2022 |
Dec. 31, 2021 |
| Pay vs Performance Disclosure |
|
|
|
|
|
| Pay vs Performance Disclosure, Table |
| | | | | | | | | | | | | | | | | | | | | | | | | | | Year(1) | Summary Comp Table Total for PEO ($) | Comp Actually Paid to PEO ($) | Average Summary Comp Table Total for Non-PEO Named Executive Officers ($) | Average Comp Actually Paid to Non-PEO Named Executive Officers ($) | Value of Initial Fixed $100 Investment Based on: | Net Income (GAAP) (millions) ($) | Non-GAAP Adjusted Operating Profit(3) (millions) ($) | Total
Shareholder
Return
($) | Peer Group(2) Total Shareholder Return ($) | | 2025 | 22,878,788 | 10,260,804 | 7,473,760 | 5,057,563 | 74.69 | 136.89 | 5,572 | 8,661 | | 2024 | 24,063,977 | 9,185,261 | 6,059,067 | 1,713,257 | 87.89 | 120.71 | 5,782 | 8,894 | | 2023 | 23,390,051 | 15,171,604 | 7,631,274 | 4,457,788 | 105.29 | 121.34 | 6,708 | 9,873 | | 2022 | 18,965,201 | 13,072,062 | 6,714,395 | 5,141,166 | 111.96 | 108.02 | 11,548 | 13,853 | | 2021 | 27,620,893 | 43,250,361 | 10,489,120 | 19,573,719 | 133.61 | 129.04 | 12,890 | 13,144 |
|
|
|
|
|
| Company Selected Measure Name |
Adjusted Operating Profit
|
|
|
|
|
| Named Executive Officers, Footnote |
For all periods presented, Carol Tomé has been the principal executive officer (“PEO”). In 2025, the Non-PEO NEOs were Brian Dykes, Nando Cesarone, Kate Gutmann and Bala Subramanian. In 2024, the Non-PEO NEOs were Brian Dykes, Brian Newman, Nando Cesarone, Kate Gutmann and Bala Subramanian. In 2023 and 2022, the Non-PEO NEOs were Brian Newman, Nando Cesarone, Kate Gutmann and Bala Subramanian. In 2021, the Non-PEO NEOs were Brian Newman, Scott Price, Nando Cesarone and Kate Gutmann.
|
|
|
|
|
| Peer Group Issuers, Footnote |
Our peer group is represented by the Dow Jones Transportation Average.
|
|
|
|
|
| PEO Total Compensation Amount |
$ 22,878,788
|
$ 24,063,977
|
$ 23,390,051
|
$ 18,965,201
|
$ 27,620,893
|
| PEO Actually Paid Compensation Amount |
$ 10,260,804
|
9,185,261
|
15,171,604
|
13,072,062
|
43,250,361
|
| Adjustment To PEO Compensation, Footnote |
| | | | | | | | | | | | | | | | PEO SCT Total to CAP Reconciliation | | | Year | Summary Compensation Table Total for PEO ($) | Deductions from SCT Total(1) ($) | Additions and other adjustments to SCT Total(2) ($) | Compensation
Actually Paid
($) | | | 2025 | 22,878,788 | 18,909,300 | 6,291,316 | 10,260,804 | | | 2024 | 24,063,977 | 19,641,906 | 4,763,190 | 9,185,261 | | | 2023 | 23,390,051 | 20,274,954 | 12,056,507 | 15,171,604 | | | 2022 | 18,965,201 | 16,275,515 | 10,382,376 | 13,072,062 | | | 2021 | 27,620,893 | 24,795,449 | 40,424,917 | 43,250,361 | |
(1)Grant-date fair value of stock awards granted during the year (2025: $17,550,546, 2024: $18,283,138, 2023: $18,916,192, 2022: $15,046,968, 2021: $23,670,426), the grant-date fair value of option awards granted during the year (2025: $1,358,754, 2024: $1,358,768, 2023: $1,358,762, 2022: $1,228,547, 2021: $1,125,023) and the aggregate change in the actuarial present value of accumulated benefits under pension plans (2025: $—, 2024: $—, 2023: $—, 2022: $—, 2021: $—). (2)Service cost for defined benefit pension plans (2025: $—, 2024: $—, 2023: $—, 2022: $—, 2021: $—), and the value of equity awards calculated using the required methodology for determining CAP, as further detailed in the table below. | | | | | | | | | | | | | | | | | | | | | | PEO Equity Component of CAP | | | | | Year | Year End Fair Value of Equity Awards Granted in the Year
($) | Change in Fair Value from Prior Year End to Year End of Outstanding Unvested Equity Awards Granted in Prior Years
($) | Fair Value as of Vesting Date of Equity Awards Granted and Vested in the Year
($) | Change in Fair Value from Prior Year End to Vesting Date of Equity Awards Granted in Prior Years that Vested in the Year
($) | Fair Value as of Prior Year End of Equity Awards Forfeited in the Year
($) | Total Equity Award Adjustments
($) | | | 2025 | 20,077,430 | (4,196,558) | — | (9,589,556) | — | 6,291,316 | | | 2024 | 14,961,235 | (4,644,851) | — | (5,553,194) | — | 4,763,190 | | | 2023 | 14,112,488 | (3,170,240) | 2,071,950 | (957,691) | — | 12,056,507 | | | 2022 | 12,805,107 | (5,289,424) | — | 2,866,693 | — | 10,382,376 | | | 2021 | 33,072,440 | 6,256,043 | — | 1,096,434 | — | 40,424,917 | |
|
|
|
|
|
| Non-PEO NEO Average Total Compensation Amount |
$ 7,473,760
|
6,059,067
|
7,631,274
|
6,714,395
|
10,489,120
|
| Non-PEO NEO Average Compensation Actually Paid Amount |
$ 5,057,563
|
1,713,257
|
4,457,788
|
5,141,166
|
19,573,719
|
| Adjustment to Non-PEO NEO Compensation Footnote |
| | | | | | | | | | | | | | | | Average Non-PEO NEOs SCT Total to CAP Reconciliation | | | Year | Summary Compensation Table Total for Other NEOs ($) | Deductions from SCT Total(1) ($) | Additions and other adjustments to SCT Total(2) ($) | Compensation
Actually Paid
($) | | | 2025 | 7,473,760 | 5,711,203 | 3,295,006 | 5,057,563 | | | 2024 | 6,059,067 | 4,065,134 | (280,676) | 1,713,257 | | | 2023 | 7,631,274 | 6,111,238 | 2,937,752 | 4,457,788 | | | 2022 | 6,714,395 | 5,656,642 | 4,083,413 | 5,141,166 | | | 2021 | 10,489,120 | 8,564,070 | 17,648,669 | 19,573,719 | |
(1)Average grant date fair value of stock awards granted during the year (2025: $5,104,043, 2024: $3,713,647, 2023: $4,765,597, 2022: $5,378,818, 2021: $8,200,584), the average grant date fair value of option awards granted during the year (2025: $442,705, 2024: $351,486, 2023: $399,020, 2022: $277,825, 2021: $351,349) and the average aggregate change in the actuarial present value of accumulated benefits under pension plans (2025: $164,455, 2024: $—, 2023: $946,621, 2022: $—, 2021: $12,137). (2)Average service cost for defined benefit pension plans (2025: $—, 2024: $—, 2023: $—, 2022: $44,219, 2021: $40,127), and the value of equity awards calculated using the required methodology for determining CAP, as further detailed in the table below. | | | | | | | | | | | | | | | | | | | | | | Average Non-PEO NEOs Equity Component of CAP | | | | | Year | Year End Fair Value of Equity Awards Granted in the Year
($) | Change in Fair Value from Prior Year End to Year End of Outstanding Unvested Equity Awards Granted in Prior Years
($) | Fair Value as of Vesting Date of Equity Awards Granted and Vested in the Year
($) | Change in Fair Value from Prior Year End to Vesting Date of Equity Awards Granted in Prior Years that Vested in the Year
($) | Fair Value as of Prior Year End of Equity Awards Forfeited in the Year
($) | Total Equity Award Adjustments
($) | | | 2025 | 4,594,997 | 449,560 | — | (1,749,551) | — | 3,295,006 | | | 2024 | 2,466,569 | (771,043) | — | (1,361,426) | (614,776) | (280,676) | | | 2023 | 3,467,543 | (884,732) | 546,548 | (191,607) | — | 2,937,752 | | | 2022 | 4,841,330 | (1,551,105) | — | 748,969 | — | 4,039,194 | | | 2021 | 12,120,687 | 2,762,650 | — | 2,725,205 | — | 17,608,542 | |
•Stock awards issued under the MIP are valued at the NYSE closing price of UPS class B stock at each applicable date. •Outstanding stock awards issued under the LTIP are valued using a Monte Carlo model at each reporting date with performance outcomes assumed to be at target. LTIP awards that vest during the period are valued using actual performance outcomes and the NYSE closing price of UPS class B stock on the vesting date. •Option awards are valued using a Black-Scholes option pricing model that reflects the award’s exercise price relative to the NYSE closing price of UPS class B common stock at each valuation date. •Stock award valuations include reinvested dividends where applicable.
|
|
|
|
|
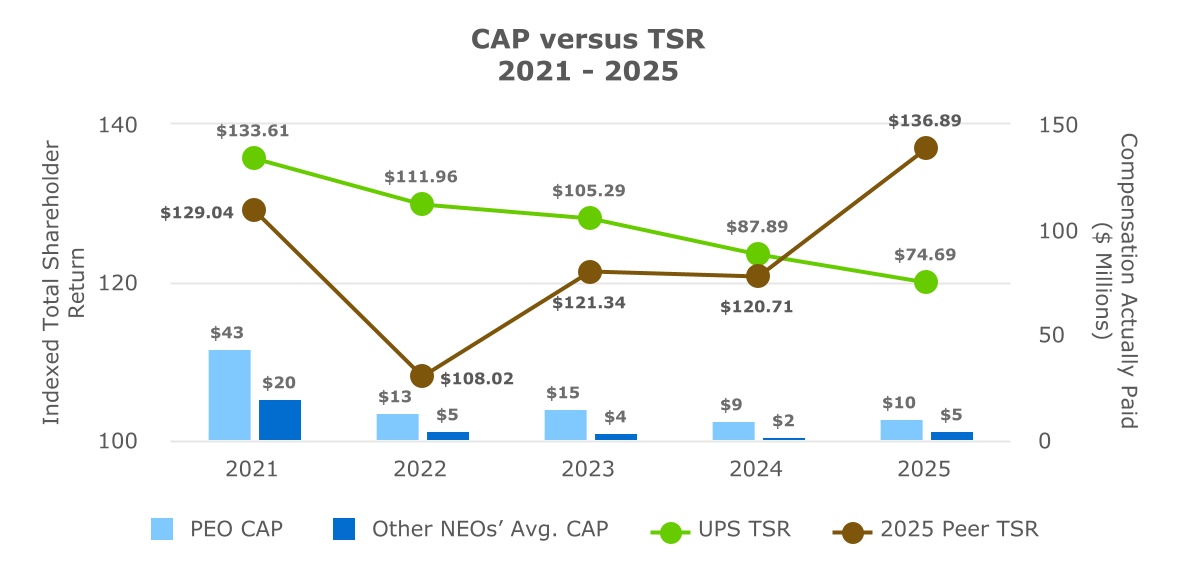
| Compensation Actually Paid vs. Total Shareholder Return |
|
|
|
|
|
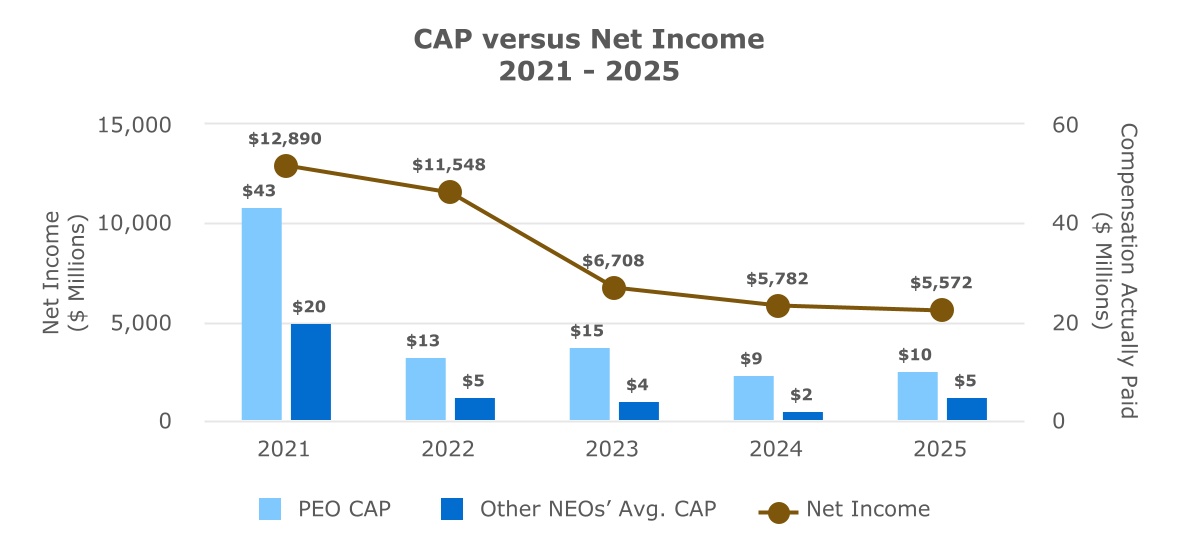
| Compensation Actually Paid vs. Net Income |
|
|
|
|
|
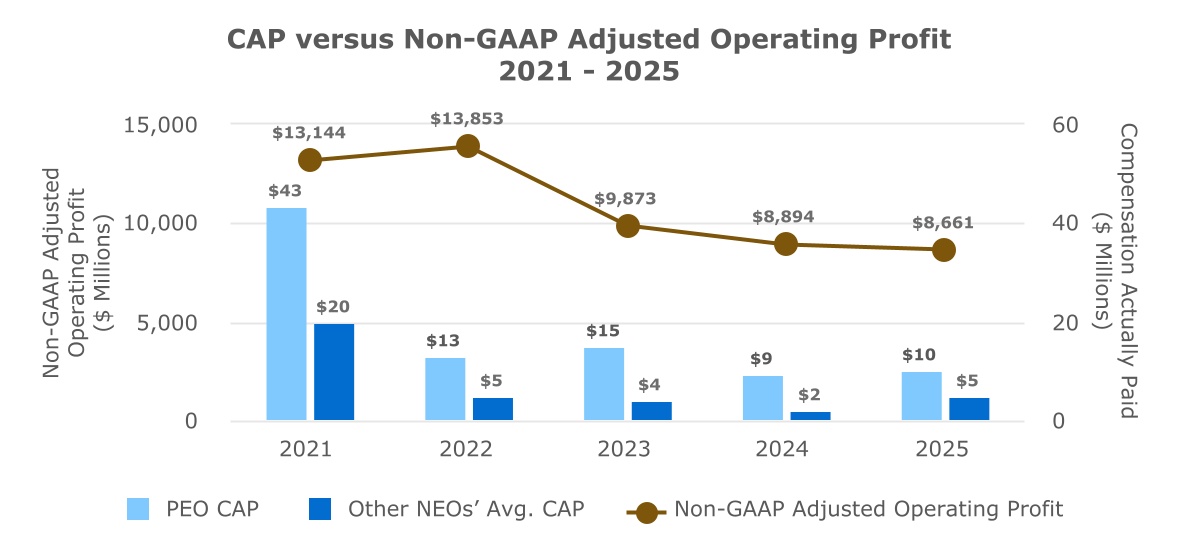
| Compensation Actually Paid vs. Company Selected Measure |
|
|
|
|
|
| Total Shareholder Return Vs Peer Group |
|
|
|
|
|
| Tabular List, Table |
| | | | Tabular List | | Non-GAAP adjusted operating profit | | Revenue | | Non-GAAP adjusted earnings per share | | Non-GAAP adjusted free cash flow | | Non-GAAP adjusted operating return on invested capital | |
|
|
|
|
|
| Total Shareholder Return Amount |
$ 74.69
|
87.89
|
105.29
|
111.96
|
133.61
|
| Peer Group Total Shareholder Return Amount |
136.89
|
120.71
|
121.34
|
108.02
|
129.04
|
| Net Income (Loss) |
$ 5,572,000,000
|
$ 5,782,000,000
|
$ 6,708,000,000
|
$ 11,548,000,000
|
$ 12,890,000,000
|
| Company Selected Measure Amount |
8,661,000,000
|
8,894,000,000
|
9,873,000,000
|
13,853,000,000
|
13,144,000,000
|
| Additional 402(v) Disclosure |
In accordance with SEC rules, we are required to include in the above table the most important financial performance measure (not otherwise required to be disclosed in the table) used to link compensation actually paid to our named executive officers for 2025 to Company performance. We consider this measure to be non-GAAP Adjusted Operating Profit, which is calculated by excluding the following items from Operating Profit determined in accordance with GAAP: for 2025, transformation strategy costs, goodwill and asset impairment charges, and a net loss on divestiture; for 2024, transformation strategy costs, gain on divestiture, a one-time payment for an international regulatory matter, goodwill and asset impairment charges, expense for a separate regulatory matter, and a charge related to a multiemployer pension plan withdrawal; for 2023, a one-time compensation representing a payment to certain U.S.-based non-union part-time supervisors, goodwill and asset impairment charges, and transformation strategy costs; for 2022, a one-time non-cash expense related to stock-based awards that were accelerated to fully vest in 2022 in connection with a change in incentive compensation program design, a one-time non-cash charge reflecting a reduction in the estimated residual value of fully-depreciated MD-11 aircraft, and transformation strategy costs; and for 2021, transformation strategy costs, goodwill and asset impairment charges, and divestitures. •Stock awards issued under the MIP are valued at the NYSE closing price of UPS class B stock at each applicable date. •Outstanding stock awards issued under the LTIP are valued using a Monte Carlo model at each reporting date with performance outcomes assumed to be at target. LTIP awards that vest during the period are valued using actual performance outcomes and the NYSE closing price of UPS class B stock on the vesting date. •Option awards are valued using a Black-Scholes option pricing model that reflects the award’s exercise price relative to the NYSE closing price of UPS class B common stock at each valuation date. •Stock award valuations include reinvested dividends where applicable.
|
|
|
|
|
| Measure:: 1 |
|
|
|
|
|
| Pay vs Performance Disclosure |
|
|
|
|
|
| Name |
Non-GAAP adjusted operating profit
|
|
|
|
|
| Measure:: 2 |
|
|
|
|
|
| Pay vs Performance Disclosure |
|
|
|
|
|
| Name |
Revenue
|
|
|
|
|
| Measure:: 3 |
|
|
|
|
|
| Pay vs Performance Disclosure |
|
|
|
|
|
| Name |
Non-GAAP adjusted earnings per share
|
|
|
|
|
| Measure:: 4 |
|
|
|
|
|
| Pay vs Performance Disclosure |
|
|
|
|
|
| Name |
Non-GAAP adjusted free cash flow
|
|
|
|
|
| Measure:: 5 |
|
|
|
|
|
| Pay vs Performance Disclosure |
|
|
|
|
|
| Name |
Non-GAAP adjusted operating return on invested capital
|
|
|
|
|
| PEO | Aggregate Change in Present Value of Accumulated Benefit for All Pension Plans Reported in Summary Compensation Table |
|
|
|
|
|
| Pay vs Performance Disclosure |
|
|
|
|
|
| Adjustment to Compensation, Amount |
$ 0
|
$ 0
|
$ 0
|
$ 0
|
$ 0
|
| PEO | Aggregate Pension Adjustments Service Cost |
|
|
|
|
|
| Pay vs Performance Disclosure |
|
|
|
|
|
| Adjustment to Compensation, Amount |
0
|
0
|
0
|
0
|
0
|
| PEO | Equity Awards Adjustments |
|
|
|
|
|
| Pay vs Performance Disclosure |
|
|
|
|
|
| Adjustment to Compensation, Amount |
6,291,316
|
4,763,190
|
12,056,507
|
10,382,376
|
40,424,917
|
| PEO | Aggregate Grant Date Fair Value of Equity Award Amounts Reported in Summary Compensation Table |
|
|
|
|
|
| Pay vs Performance Disclosure |
|
|
|
|
|
| Adjustment to Compensation, Amount |
(18,909,300)
|
(19,641,906)
|
(20,274,954)
|
(16,275,515)
|
(24,795,449)
|
| PEO | Equity Awards Adjustments, Excluding Value Reported in Compensation Table |
|
|
|
|
|
| Pay vs Performance Disclosure |
|
|
|
|
|
| Adjustment to Compensation, Amount |
6,291,316
|
4,763,190
|
12,056,507
|
10,382,376
|
40,424,917
|
| PEO | Year-end Fair Value of Equity Awards Granted in Covered Year that are Outstanding and Unvested |
|
|
|
|
|
| Pay vs Performance Disclosure |
|
|
|
|
|
| Adjustment to Compensation, Amount |
20,077,430
|
14,961,235
|
14,112,488
|
12,805,107
|
33,072,440
|
| PEO | Year-over-Year Change in Fair Value of Equity Awards Granted in Prior Years That are Outstanding and Unvested |
|
|
|
|
|
| Pay vs Performance Disclosure |
|
|
|
|
|
| Adjustment to Compensation, Amount |
(4,196,558)
|
(4,644,851)
|
(3,170,240)
|
(5,289,424)
|
6,256,043
|
| PEO | Vesting Date Fair Value of Equity Awards Granted and Vested in Covered Year |
|
|
|
|
|
| Pay vs Performance Disclosure |
|
|
|
|
|
| Adjustment to Compensation, Amount |
0
|
0
|
2,071,950
|
0
|
0
|
| PEO | Change in Fair Value as of Vesting Date of Prior Year Equity Awards Vested in Covered Year |
|
|
|
|
|
| Pay vs Performance Disclosure |
|
|
|
|
|
| Adjustment to Compensation, Amount |
(9,589,556)
|
(5,553,194)
|
(957,691)
|
2,866,693
|
1,096,434
|
| PEO | Prior Year End Fair Value of Equity Awards Granted in Any Prior Year that Fail to Meet Applicable Vesting Conditions During Covered Year |
|
|
|
|
|
| Pay vs Performance Disclosure |
|
|
|
|
|
| Adjustment to Compensation, Amount |
0
|
0
|
0
|
0
|
0
|
| PEO | Equity Awards Granted During The Year [Member] |
|
|
|
|
|
| Pay vs Performance Disclosure |
|
|
|
|
|
| Adjustment to Compensation, Amount |
(17,550,546)
|
(18,283,138)
|
(18,916,192)
|
(15,046,968)
|
(23,670,426)
|
| PEO | Options Granted During Year [Member] |
|
|
|
|
|
| Pay vs Performance Disclosure |
|
|
|
|
|
| Adjustment to Compensation, Amount |
(1,358,754)
|
(1,358,768)
|
(1,358,762)
|
(1,228,547)
|
(1,125,023)
|
| Non-PEO NEO | Aggregate Change in Present Value of Accumulated Benefit for All Pension Plans Reported in Summary Compensation Table |
|
|
|
|
|
| Pay vs Performance Disclosure |
|
|
|
|
|
| Adjustment to Compensation, Amount |
(164,455)
|
0
|
(946,621)
|
0
|
(12,137)
|
| Non-PEO NEO | Pension Adjustments Service Cost |
|
|
|
|
|
| Pay vs Performance Disclosure |
|
|
|
|
|
| Adjustment to Compensation, Amount |
0
|
0
|
0
|
44,219
|
40,127
|
| Non-PEO NEO | Equity Awards Adjustments |
|
|
|
|
|
| Pay vs Performance Disclosure |
|
|
|
|
|
| Adjustment to Compensation, Amount |
3,295,006
|
(280,676)
|
2,937,752
|
4,039,194
|
17,608,542
|
| Non-PEO NEO | Aggregate Grant Date Fair Value of Equity Award Amounts Reported in Summary Compensation Table |
|
|
|
|
|
| Pay vs Performance Disclosure |
|
|
|
|
|
| Adjustment to Compensation, Amount |
(5,711,203)
|
(4,065,134)
|
(6,111,238)
|
(5,656,642)
|
(8,564,070)
|
| Non-PEO NEO | Equity Awards Adjustments, Excluding Value Reported in Compensation Table |
|
|
|
|
|
| Pay vs Performance Disclosure |
|
|
|
|
|
| Adjustment to Compensation, Amount |
3,295,006
|
(280,676)
|
2,937,752
|
4,083,413
|
17,648,669
|
| Non-PEO NEO | Year-end Fair Value of Equity Awards Granted in Covered Year that are Outstanding and Unvested |
|
|
|
|
|
| Pay vs Performance Disclosure |
|
|
|
|
|
| Adjustment to Compensation, Amount |
4,594,997
|
2,466,569
|
3,467,543
|
4,841,330
|
12,120,687
|
| Non-PEO NEO | Year-over-Year Change in Fair Value of Equity Awards Granted in Prior Years That are Outstanding and Unvested |
|
|
|
|
|
| Pay vs Performance Disclosure |
|
|
|
|
|
| Adjustment to Compensation, Amount |
449,560
|
(771,043)
|
(884,732)
|
(1,551,105)
|
2,762,650
|
| Non-PEO NEO | Vesting Date Fair Value of Equity Awards Granted and Vested in Covered Year |
|
|
|
|
|
| Pay vs Performance Disclosure |
|
|
|
|
|
| Adjustment to Compensation, Amount |
0
|
0
|
546,548
|
0
|
0
|
| Non-PEO NEO | Change in Fair Value as of Vesting Date of Prior Year Equity Awards Vested in Covered Year |
|
|
|
|
|
| Pay vs Performance Disclosure |
|
|
|
|
|
| Adjustment to Compensation, Amount |
(1,749,551)
|
(1,361,426)
|
(191,607)
|
748,969
|
2,725,205
|
| Non-PEO NEO | Prior Year End Fair Value of Equity Awards Granted in Any Prior Year that Fail to Meet Applicable Vesting Conditions During Covered Year |
|
|
|
|
|
| Pay vs Performance Disclosure |
|
|
|
|
|
| Adjustment to Compensation, Amount |
0
|
(614,776)
|
0
|
0
|
0
|
| Non-PEO NEO | Equity Awards Granted During The Year [Member] |
|
|
|
|
|
| Pay vs Performance Disclosure |
|
|
|
|
|
| Adjustment to Compensation, Amount |
(5,104,043)
|
(3,713,647)
|
(4,765,597)
|
(5,378,818)
|
(8,200,584)
|
| Non-PEO NEO | Options Granted During Year [Member] |
|
|
|
|
|
| Pay vs Performance Disclosure |
|
|
|
|
|
| Adjustment to Compensation, Amount |
$ (442,705)
|
$ (351,486)
|
$ (399,020)
|
$ (277,825)
|
$ (351,349)
|