Pay vs Performance Disclosure - USD ($)
|
12 Months Ended |
Dec. 31, 2025 |
Dec. 31, 2024 |
Dec. 31, 2023 |
Dec. 31, 2022 |
Dec. 31, 2021 |
| Pay vs Performance Disclosure |
|
|
|
|
|
| Pay vs Performance Disclosure, Table |
| | | | | | | | | | | | | | | | | | | | | | | | | | | | Year | Summary Compensation Table Total for CEO (1) ($) | Compensation Actually Paid to CEO (2) ($) | Average Summary Compensation Table Total for Other NEOs (3) ($) | Average Compensation Actually Paid to Other NEOs (4) ($) | Cumulative TSR (5) ($) | Peer Group Cumulative TSR (6) ($) | Net Income (Loss) (7) (in millions) ($) | Adjusted Free Cash Flow (8) (in millions) ($) | | 2025 | 11,520,501 | | 13,087,572 | | 3,078,409 | | 3,418,078 | | 76.86 | | 127.05 | | (19.7) | | 213.0 | | | 2024 | 11,123,018 | | 6,054,691 | | 2,737,752 | | 1,924,338 | | 69.90 | | 84.97 | | 35.0 | | 230.3 | | | 2023 | 12,198,672 | | 13,718,052 | | 2,926,841 | | 3,080,000 | | 105.64 | | 102.63 | | (33.6) | | 246.4 | | | 2022 | 13,399,781 | | 9,127,710 | | 3,702,956 | | 2,650,073 | | 93.76 | | 88.94 | | 64.3 | | 313.0 | | | 2021 | 11,176,460 | | 14,071,422 | | 3,550,563 | | 4,250,396 | | 111.87 | | 117.72 | | 5.9 | | 422.9 | |
|
|
|
|
|
| Company Selected Measure Name |
Adjusted free cash flow
|
|
|
|
|
| Named Executive Officers, Footnote |
Reflects amounts reported in the Summary Compensation Table total column for each corresponding year for Mr. Dauch. Reflects the average of the amounts reported in the Summary Compensation Table total column for the NEOs (other than the CEO) as a group for each corresponding year. The NEOs included in calculating the average amounts, for 2025, 2024 and 2023 are Mr. May, Mr. Lynch, Ms. Kemp and Mr. Oal; for 2022 and 2021 are Mr. May, Michael K. Simonte, Norman Willemse and Mr. Lynch.
|
|
|
|
|
| Peer Group Issuers, Footnote |
Represents the weighted peer group TSR, weighted according to the respective companies' stock market capitalization at the beginning of each period for which a return is indicated. The peer group used for this purpose is the annual report peer group (competitor peer group).
|
|
|
|
|
| PEO Total Compensation Amount |
$ 11,520,501
|
$ 11,123,018
|
$ 12,198,672
|
$ 13,399,781
|
$ 11,176,460
|
| PEO Actually Paid Compensation Amount |
$ 13,087,572
|
6,054,691
|
13,718,052
|
9,127,710
|
14,071,422
|
| Adjustment To PEO Compensation, Footnote |
Reflects amounts of "compensation actually paid" to Mr. Dauch, as computed in accordance with Item 402(v) of Regulation S-K. The amounts do not reflect the actual amount of compensation earned by or paid to Mr. Dauch during the applicable year. In accordance with the requirements of Item 402(v) of Regulation S-K, the following adjustments were made to Mr. Dauch's total compensation for each year to determine compensation actually paid. | | | | | | | | | | | | | | | | | | | 2025
$ | 2024
$ | 2023
$ | 2022
$ | 2021
$ | | Total Compensation as reported in the Summary Compensation Table (SCT) | 11,520,501 | | 11,123,018 | | 12,198,672 | | 13,399,781 | | 11,176,460 | | | Pension Values reported in SCT | (62,499) | | (76,135) | | (53,238) | | — | | — | | | Fair value of equity awards granted during the fiscal year | (5,103,889) | | (5,136,512) | | (5,161,125) | | (5,532,280) | | (4,879,478) | | | Pension value attributable to current year's service and any change in pension value attributable to plan amendments made in the current year | — | | — | | — | | — | | — | | | Fair value at the end of the year of equity compensation granted in current year | 6,762,312 | | 4,801,592 | | 5,108,035 | | 4,988,560 | | 5,733,847 | | | Change in fair value for end of prior fiscal year to vesting date for awards made in prior fiscal years that vested during current fiscal year | (496,911) | | (1,525,002) | | 704,393 | | (1,903,230) | | (460,430) | | | Change in fair value for end of prior fiscal year to end of current fiscal year for awards made in prior fiscal years that were unvested at end of current fiscal year | 468,058 | | (3,132,270) | | 921,315 | | (1,825,121) | | 2,501,023 | | | Dividends or other earnings paid on equity awards in the covered fiscal year prior to the vesting date that are not otherwise included in the total compensation for the covered fiscal year | — | | — | | — | | — | | — | | | Fair value of awards forfeited in current fiscal year determined at end of prior fiscal year | — | | — | | — | | — | | — | | | Compensation Actually Paid to CEO | 13,087,572 | | 6,054,691 | | 13,718,052 | | 9,127,710 | | 14,071,422 | |
|
|
|
|
|
| Non-PEO NEO Average Total Compensation Amount |
$ 3,078,409
|
2,737,752
|
2,926,841
|
3,702,956
|
3,550,563
|
| Non-PEO NEO Average Compensation Actually Paid Amount |
$ 3,418,078
|
1,924,338
|
3,080,000
|
2,650,073
|
4,250,396
|
| Adjustment to Non-PEO NEO Compensation Footnote |
Reflects the average of amounts of "compensation actually paid" to the NEOs (other than the CEO) as a group in accordance with Item 402(v) of Regulation S-K. The amounts do not reflect the actual average amount of compensation earned by or paid to the NEOs during the applicable year. In accordance with the requirements of Item 402(v) of Regulation S-K, the adjustments made to the NEOs' total compensation for each year to determine compensation actually paid are shown below. | | | | | | | | | | | | | | | | | | | 2025
$ | 2024
$ | 2023
$ | 2022
$ | 2021
$ | | Total Compensation as reported SCT | 3,078,409 | | 2,737,752 | | 2,926,841 | | 3,702,956 | | 3,550,563 | | | Pension Values reported in SCT | (25,476) | | (21,553) | | (36,434) | | — | | (33,897) | | | Fair value of equity awards granted during the fiscal year | (1,048,520) | | (1,055,228) | | (1,060,281) | | (1,171,412) | | (1,237,240) | | | Pension value attributable to current year's service and any change in pension value attributable to plan amendments made in the current year | — | | — | | — | | — | | — | | | Fair value at the end of the year of equity compensation granted in current year | 1,389,219 | | 986,424 | | 1,049,374 | | 1,056,284 | | 1,453,875 | | | Change in fair value for end of prior fiscal year to vesting date for awards made in prior fiscal years that vested during current fiscal year | (71,710) | | (183,612) | | 90,277 | | (476,447) | | (110,404) | | | Change in fair value for end of prior fiscal year to end of current fiscal year for awards made in prior fiscal years that were unvested at end of current fiscal year | 96,156 | | (539,445) | | 110,223 | | (461,308) | | 627,499 | | | Dividends or other earnings paid on equity awards in the covered fiscal year prior to the vesting date that are not otherwise included in the total compensation for the covered fiscal year | — | | — | | — | | — | | — | | | Fair value of awards forfeited in current fiscal year determined at end of prior fiscal year | — | | — | | — | | — | | — | | | Compensation Actually Paid to other NEOs (other than the CEO) | 3,418,078 | | 1,924,338 | | 3,080,000 | | 2,650,073 | | 4,250,396 | |
|
|
|
|
|
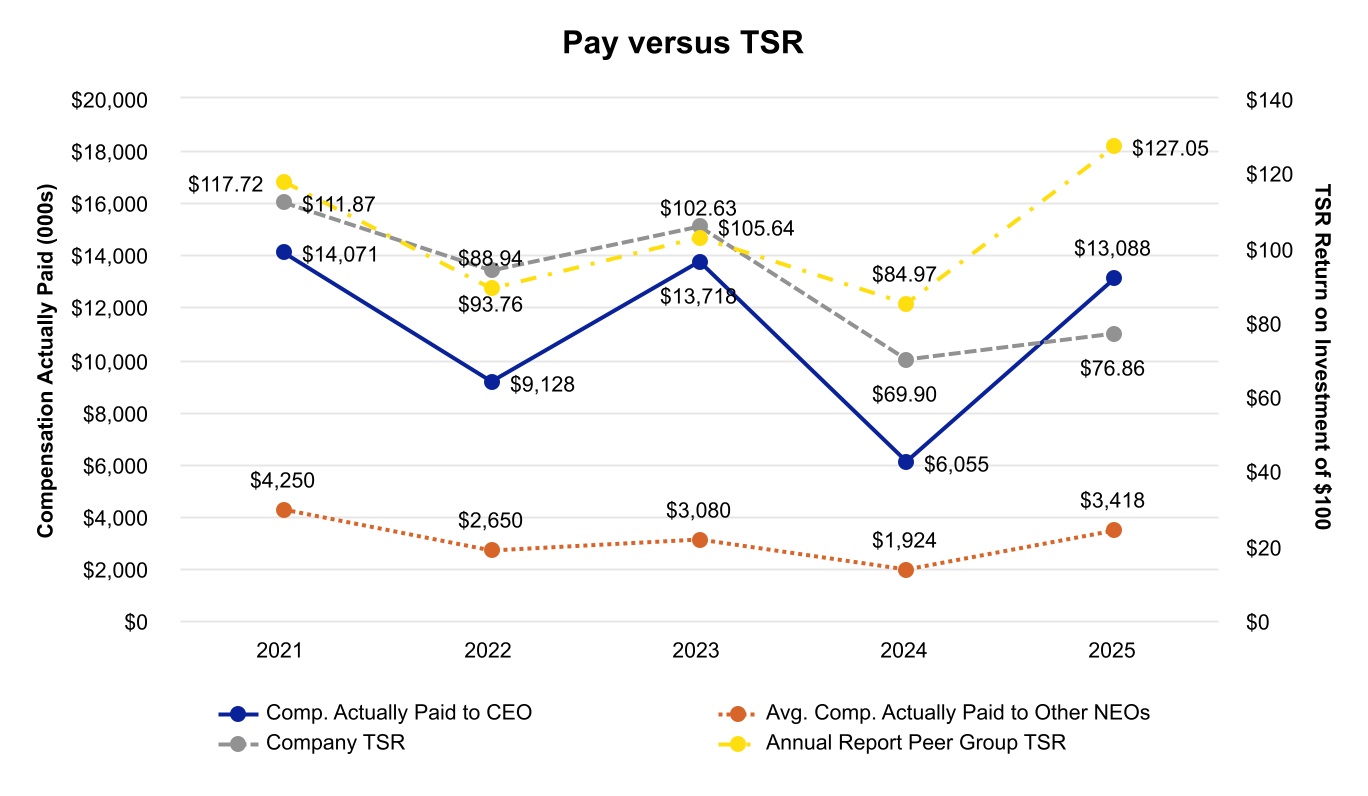
| Compensation Actually Paid vs. Total Shareholder Return |
|
|
|
|
|
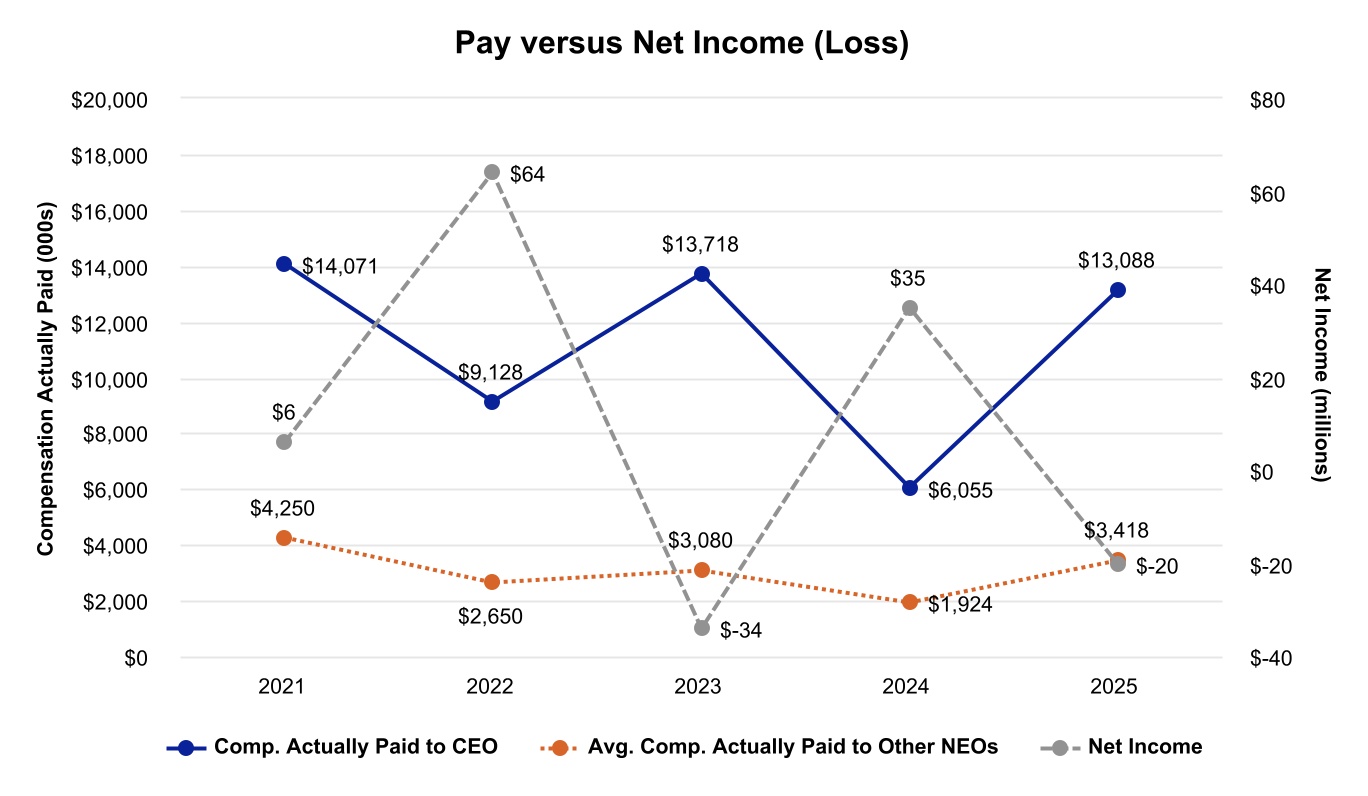
| Compensation Actually Paid vs. Net Income |
|
|
|
|
|
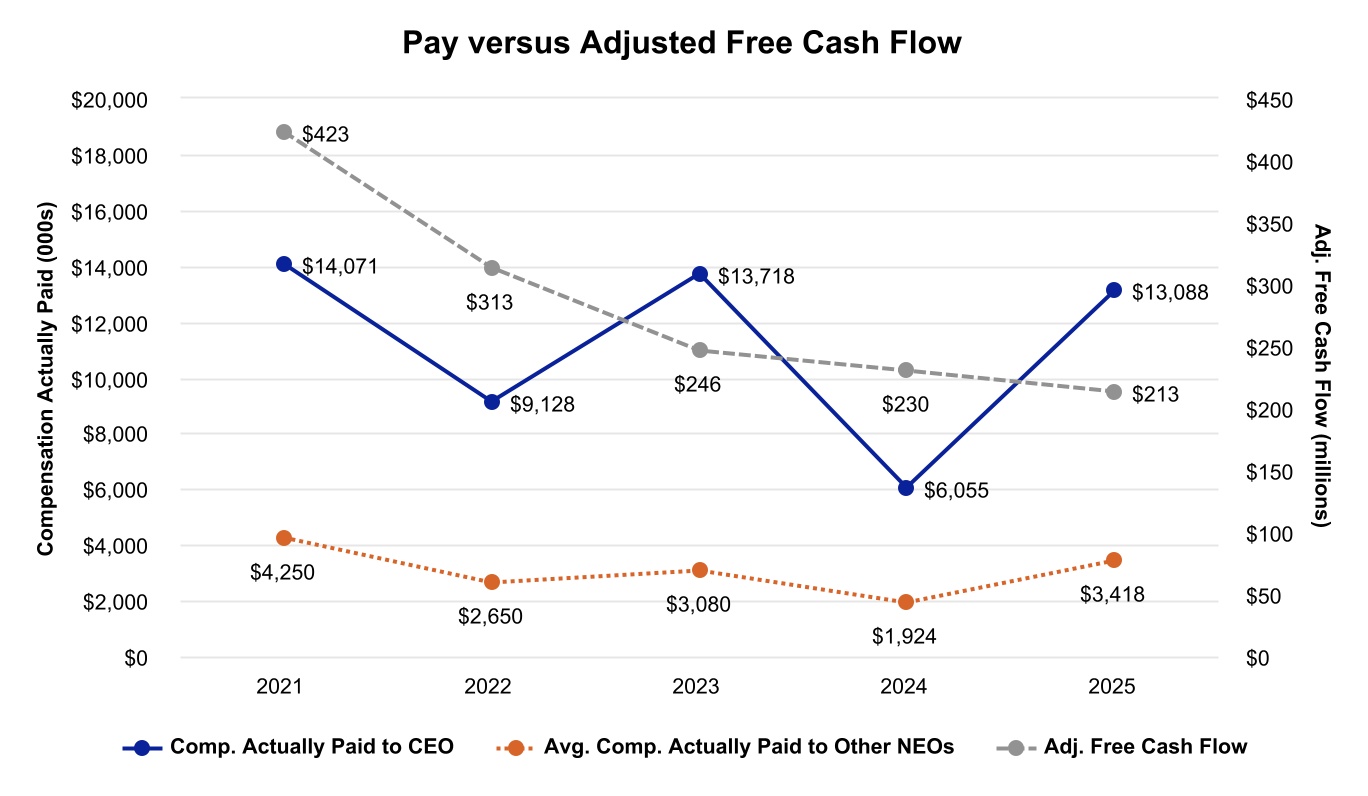
| Compensation Actually Paid vs. Company Selected Measure |
|
|
|
|
|
| Total Shareholder Return Vs Peer Group |
|
|
|
|
|
| Tabular List, Table |
Our compensation programs are designed to link pay to the Company's financial performance. In addition to adjusted free cash flow, the most important financial measures used by the Committee to link NEO compensation to performance are shown below. | | | | | | | | | | FINANCIAL MEASURES USED TO LINK NEO COMPENSATION ACTUALLY PAID TO COMPANY PERFORMANCE | | Adjusted EBITDA | Adjusted EBITDA Margin | Operational Cash Flow |
|
|
|
|
|
| Total Shareholder Return Amount |
$ 76.86
|
69.90
|
105.64
|
93.76
|
111.87
|
| Peer Group Total Shareholder Return Amount |
127.05
|
84.97
|
102.63
|
88.94
|
117.72
|
| Net Income (Loss) |
$ (19,700,000)
|
$ 35,000,000.0
|
$ (33,600,000)
|
$ 64,300,000
|
$ 5,900,000
|
| Company Selected Measure Amount |
213,000,000.0
|
230,300,000
|
246,400,000
|
313,000,000.0
|
422,900,000
|
| PEO Name |
Mr. Dauch
|
|
|
|
|
| Additional 402(v) Disclosure |
Cumulative TSR is calculated by the difference between the Company's share price at the end and the beginning of the measurement period divided by the Company's share price at the beginning of the measurement period. No dividends were paid during any of the years.Reflects Net Income (Loss) as reported in our annual report on Form 10-K for the applicable year.
|
|
|
|
|
| Measure:: 1 |
|
|
|
|
|
| Pay vs Performance Disclosure |
|
|
|
|
|
| Name |
Adjusted EBITDA
|
|
|
|
|
| Measure:: 2 |
|
|
|
|
|
| Pay vs Performance Disclosure |
|
|
|
|
|
| Name |
Adjusted EBITDA Margin
|
|
|
|
|
| Measure:: 3 |
|
|
|
|
|
| Pay vs Performance Disclosure |
|
|
|
|
|
| Name |
Operational Cash Flow
|
|
|
|
|
| Measure:: 4 |
|
|
|
|
|
| Pay vs Performance Disclosure |
|
|
|
|
|
| Name |
Adjusted free cash flow
|
|
|
|
|
| Non-GAAP Measure Description |
Adjusted free cash flow is a key financial metric used in the 2018 Omnibus Incentive Plan. This metric is a non-GAAP financial measure. Such information is reconciled to its closest GAAP measure in the Non-GAAP Reconciliation in Appendix A.
|
|
|
|
|
| PEO | Aggregate Change in Present Value of Accumulated Benefit for All Pension Plans Reported in Summary Compensation Table |
|
|
|
|
|
| Pay vs Performance Disclosure |
|
|
|
|
|
| Adjustment to Compensation, Amount |
$ (62,499)
|
$ (76,135)
|
$ (53,238)
|
$ 0
|
$ 0
|
| PEO | Pension Adjustments Service Cost |
|
|
|
|
|
| Pay vs Performance Disclosure |
|
|
|
|
|
| Adjustment to Compensation, Amount |
0
|
0
|
0
|
0
|
0
|
| PEO | Aggregate Grant Date Fair Value of Equity Award Amounts Reported in Summary Compensation Table |
|
|
|
|
|
| Pay vs Performance Disclosure |
|
|
|
|
|
| Adjustment to Compensation, Amount |
(5,103,889)
|
(5,136,512)
|
(5,161,125)
|
(5,532,280)
|
(4,879,478)
|
| PEO | Year-end Fair Value of Equity Awards Granted in Covered Year that are Outstanding and Unvested |
|
|
|
|
|
| Pay vs Performance Disclosure |
|
|
|
|
|
| Adjustment to Compensation, Amount |
6,762,312
|
4,801,592
|
5,108,035
|
4,988,560
|
5,733,847
|
| PEO | Year-over-Year Change in Fair Value of Equity Awards Granted in Prior Years That are Outstanding and Unvested |
|
|
|
|
|
| Pay vs Performance Disclosure |
|
|
|
|
|
| Adjustment to Compensation, Amount |
468,058
|
(3,132,270)
|
921,315
|
(1,825,121)
|
2,501,023
|
| PEO | Change in Fair Value as of Vesting Date of Prior Year Equity Awards Vested in Covered Year |
|
|
|
|
|
| Pay vs Performance Disclosure |
|
|
|
|
|
| Adjustment to Compensation, Amount |
(496,911)
|
(1,525,002)
|
704,393
|
(1,903,230)
|
(460,430)
|
| PEO | Prior Year End Fair Value of Equity Awards Granted in Any Prior Year that Fail to Meet Applicable Vesting Conditions During Covered Year |
|
|
|
|
|
| Pay vs Performance Disclosure |
|
|
|
|
|
| Adjustment to Compensation, Amount |
0
|
0
|
0
|
0
|
0
|
| PEO | Dividends or Other Earnings Paid on Equity Awards not Otherwise Reflected in Total Compensation for Covered Year |
|
|
|
|
|
| Pay vs Performance Disclosure |
|
|
|
|
|
| Adjustment to Compensation, Amount |
0
|
0
|
0
|
0
|
0
|
| Non-PEO NEO | Aggregate Change in Present Value of Accumulated Benefit for All Pension Plans Reported in Summary Compensation Table |
|
|
|
|
|
| Pay vs Performance Disclosure |
|
|
|
|
|
| Adjustment to Compensation, Amount |
(25,476)
|
(21,553)
|
(36,434)
|
0
|
(33,897)
|
| Non-PEO NEO | Pension Adjustments Service Cost |
|
|
|
|
|
| Pay vs Performance Disclosure |
|
|
|
|
|
| Adjustment to Compensation, Amount |
0
|
0
|
0
|
0
|
0
|
| Non-PEO NEO | Aggregate Grant Date Fair Value of Equity Award Amounts Reported in Summary Compensation Table |
|
|
|
|
|
| Pay vs Performance Disclosure |
|
|
|
|
|
| Adjustment to Compensation, Amount |
(1,048,520)
|
(1,055,228)
|
(1,060,281)
|
(1,171,412)
|
(1,237,240)
|
| Non-PEO NEO | Year-end Fair Value of Equity Awards Granted in Covered Year that are Outstanding and Unvested |
|
|
|
|
|
| Pay vs Performance Disclosure |
|
|
|
|
|
| Adjustment to Compensation, Amount |
1,389,219
|
986,424
|
1,049,374
|
1,056,284
|
1,453,875
|
| Non-PEO NEO | Year-over-Year Change in Fair Value of Equity Awards Granted in Prior Years That are Outstanding and Unvested |
|
|
|
|
|
| Pay vs Performance Disclosure |
|
|
|
|
|
| Adjustment to Compensation, Amount |
96,156
|
(539,445)
|
110,223
|
(461,308)
|
627,499
|
| Non-PEO NEO | Change in Fair Value as of Vesting Date of Prior Year Equity Awards Vested in Covered Year |
|
|
|
|
|
| Pay vs Performance Disclosure |
|
|
|
|
|
| Adjustment to Compensation, Amount |
(71,710)
|
(183,612)
|
90,277
|
(476,447)
|
(110,404)
|
| Non-PEO NEO | Prior Year End Fair Value of Equity Awards Granted in Any Prior Year that Fail to Meet Applicable Vesting Conditions During Covered Year |
|
|
|
|
|
| Pay vs Performance Disclosure |
|
|
|
|
|
| Adjustment to Compensation, Amount |
0
|
0
|
0
|
0
|
0
|
| Non-PEO NEO | Dividends or Other Earnings Paid on Equity Awards not Otherwise Reflected in Total Compensation for Covered Year |
|
|
|
|
|
| Pay vs Performance Disclosure |
|
|
|
|
|
| Adjustment to Compensation, Amount |
$ 0
|
$ 0
|
$ 0
|
$ 0
|
$ 0
|