Pay versus Performance
Pursuant to the Dodd-Frank Act and Item 402(v) of Regulation S-K, we are required to provide the following information regarding the relationship between executive compensation paid to our named executive officers and Vericel’s financial performance for each of the last five completed calendar years. In determining the Compensation Actually Paid (or “CAP”) to our Principal Executive Officer, who is our CEO, and our other named executive officers, we are required to make various adjustments to the amounts that have been previously reported in the Summary Compensation Table, as summarized below. The CAP amounts reflected in the table below do not reflect the actual amount of compensation earned by or paid to our named executive officers during the applicable year. For information regarding decisions made by our Compensation Committee with respect to executive compensation, refer to the “Compensation Discussion and Analysis” section of this Proxy Statement.
| Year | Summary Compensation Table Total for CEO | Compensation Actually Paid to CEO(1) | Average Summary Compensation Table Total for Other NEOs(2) | Average Compensation Actually Paid to Other NEOs(1)(2) | Value of Initial $100 Investment Based On: | Net Income ($M)(4) | Total Net Revenue ($M)(5) | |||||||||||||||||||||||||
| Vericel TSR(3) | NASDAQ Biotechnology Index TSR(3) | |||||||||||||||||||||||||||||||
| 2025 | $ | 11,156,368 | $ | 169,184 | $ | 2,649,989 | $ | 404,231 | $ | 117 | $ | 120 | $ | 17 | $ | 276 | ||||||||||||||||
| 2024 | $ | 10,237,525 | $ | 18,758,303 | $ | 2,703,655 | $ | 4,246,598 | $ | 178 | $ | 91 | $ | 10 | $ | 237 | ||||||||||||||||
| 2023 | $ | 7,056,422 | $ | 11,004,672 | $ | 1,918,083 | $ | 2,851,775 | $ | 115 | $ | 92 | $ | -3 | $ | 198 | ||||||||||||||||
| 2022 | $ | 8,708,367 | $ | 905,166 | $ | 2,398,900 | $ | 467,192 | $ | 85 | $ | 89 | $ | -17 | $ | 164 | ||||||||||||||||
| 2021 | $ | 13,183,295 | $ | 15,233,917 | $ | 3,459,670 | $ | 3,204,518 | $ | 127 | $ | 99 | $ | -7 | $ | 156 | ||||||||||||||||
| (1) | To calculate CAP, the following amounts were deducted from and added to the applicable Summary Compensation Table total compensation: |
| CEO | ||||||||||||||||||||||
| 2021 | 2022 | 2023 | 2024 | 2025 | ||||||||||||||||||
| Summary Compensation Table Total | $ | 13,183,295 | $ | 8,708,367 | $ | 7,056,422 | $ | 10,237,525 | $ | 11,156,368 | ||||||||||||
| Less: | Grant Date Fair Value of Stock and Option Awards in the Covered Year | $ | -11,819,409 | $ | -7,288,603 | $ | -5,513,083 | $ | -8,680,435 | $ | -9,420,917 | |||||||||||
| Plus: | Fair Value at Year-End of Unvested Stock and Option Awards Granted in the Covered Year* | $ | +6,387,501 | $ | +4,402,751 | $ | +5,834,763 | $ | +8,700,718 | $ | +4,770,019 | |||||||||||
| Plus: | Fair Value of Stock and Option Awards Granted in the Covered Year that Vested in the Covered Year* | $ | +1,618,248 | $ | +724,137 | $ | +711,181 | $ | +1,038,836 | $ | +617,130 | |||||||||||
| Change in Fair Value of Unvested Stock and Option Awards Granted in Prior Years* | $ | +1,965,721 | $ | -3,564,080 | $ | +1,963,617 | $ | +4,861,123 | $ | -5,492,482 | ||||||||||||
| Change in Fair Value of Stock and Option Awards from Prior Years that Vested in the Covered Year* | $ | +3,898,560 | $ | -2,077,406 | $ | +951,771 | $ | +2,600,537 | $ | -1,460,935 | ||||||||||||
| = | Compensation Actually Paid | $ | 15,233,917 | $ | 905,166 | $ | 11,004,672 | $ | 18,758,303 | $ | 169,184 | |||||||||||
| Average of Other NEOs | ||||||||||||||||||||||
| 2021 | 2022 | 2023 | 2024 | 2025 | ||||||||||||||||||
| Summary Compensation Table Total | $ | 3,459,670 | $ | 2,398,900 | $ | 1,918,083 | $ | 2,703,655 | $ | 2,649,989 | ||||||||||||
| Less: | Grant Date Fair Value of Stock and Option Awards in the Covered Year | $ | -2,945,499 | $ | -1,748,862 | $ | -1,198,907 | $ | -2,049,743 | $ | -1,858,938 | |||||||||||
| Plus: | Fair Value at Year-End of Unvested Stock and Option Awards Granted in the Covered Year* | $ | +1,626,544 | $ | +1,056,425 | $ | +1,275,999 | $ | +2,095,233 | $ | +949,773 | |||||||||||
| Plus: | Fair Value of Stock and Option Awards Granted in the Covered Year that Vested in the Covered Year* | $ | +271,626 | $ | +173,955 | $ | +147,705 | $ | +180,724 | $ | +122,865 | |||||||||||
| Change in Fair Value of Unvested Stock and Option Awards Granted in Prior Years* | $ | +299,760 | $ | -902,246 | $ | +445,775 | $ | +832,854 | $ | -1,127,572 | ||||||||||||
| Change in Fair Value of Stock and Option Awards from Prior Years that Vested in the Covered Year* | $ | +594,099 | $ | -510,980 | $ | +263,119 | $ | +483,874 | $ | -331,886 | ||||||||||||
| Less: | Fair Value of Stock and Option Awards Forfeited During the Covered Year* | $ | -101,683 | $ | +0 | $ | +0 | $ | +0 | $ | +0 | |||||||||||
| = | Compensation Actually Paid | $ | 3,204,518 | $ | 467,192 | $ | 2,851,775 | $ | 4,246,598 | $ | 404,231 | |||||||||||
| * | All stock option valuations included in “Compensation Actually Paid” values were performed using the Black-Scholes option pricing model in a manner generally consistent with the process used to determine stock option grant date fair values under ASC718 (refer to our Annual Report on Form 10-K for the year ending December 31, 2025 for additional detail). | |
| (2) | The other NEOs in each covered year were as follows: | |
| 2025 – Joe Mara, Michael Halpin, Sean Flynn, Jonathan Hopper; 2024 – Joe Mara, Michael Halpin, Sean Flynn, Jonathan Hopper, Karen Mahoney; 2023 – Joe Mara, Michael Halpin, Jonathan Hopper, Sean Flynn; 2022 – Joe Mara, Michael Halpin, Sean Flynn, Jonathan Hopper; 2021 – Joe Mara, Michael Halpin, Sean Flynn, Jonathan Hopper, Sandra Pennell. | ||
| (3) | TSR is cumulative for the measurement period, calculated in accordance with Item 201(e) of Regulation S-K. Our TSR Peer Group are members of the NASDAQ Biotechnology Index. | |
| (4) | Reflects net Income as shown in the Company’s Annual Report on Form 10-K for the years ending on December 31, 2025, 2024, 2023, 2022 and 2021. | |
| (5) | Reflects total net revenue, the “company-selected measure” as shown in the Company’s Annual Report on Form 10-K for the years ending on December 31, 2025, 2024, 2023, 2022 and 2021. | |
| CEO | ||||||||||||||||||||||
| 2021 | 2022 | 2023 | 2024 | 2025 | ||||||||||||||||||
| Summary Compensation Table Total | $ | 13,183,295 | $ | 8,708,367 | $ | 7,056,422 | $ | 10,237,525 | $ | 11,156,368 | ||||||||||||
| Less: | Grant Date Fair Value of Stock and Option Awards in the Covered Year | $ | -11,819,409 | $ | -7,288,603 | $ | -5,513,083 | $ | -8,680,435 | $ | -9,420,917 | |||||||||||
| Plus: | Fair Value at Year-End of Unvested Stock and Option Awards Granted in the Covered Year* | $ | +6,387,501 | $ | +4,402,751 | $ | +5,834,763 | $ | +8,700,718 | $ | +4,770,019 | |||||||||||
| Plus: | Fair Value of Stock and Option Awards Granted in the Covered Year that Vested in the Covered Year* | $ | +1,618,248 | $ | +724,137 | $ | +711,181 | $ | +1,038,836 | $ | +617,130 | |||||||||||
| Change in Fair Value of Unvested Stock and Option Awards Granted in Prior Years* | $ | +1,965,721 | $ | -3,564,080 | $ | +1,963,617 | $ | +4,861,123 | $ | -5,492,482 | ||||||||||||
| Change in Fair Value of Stock and Option Awards from Prior Years that Vested in the Covered Year* | $ | +3,898,560 | $ | -2,077,406 | $ | +951,771 | $ | +2,600,537 | $ | -1,460,935 | ||||||||||||
| = | Compensation Actually Paid | $ | 15,233,917 | $ | 905,166 | $ | 11,004,672 | $ | 18,758,303 | $ | 169,184 | |||||||||||
| Average of Other NEOs | ||||||||||||||||||||||
| 2021 | 2022 | 2023 | 2024 | 2025 | ||||||||||||||||||
| Summary Compensation Table Total | $ | 3,459,670 | $ | 2,398,900 | $ | 1,918,083 | $ | 2,703,655 | $ | 2,649,989 | ||||||||||||
| Less: | Grant Date Fair Value of Stock and Option Awards in the Covered Year | $ | -2,945,499 | $ | -1,748,862 | $ | -1,198,907 | $ | -2,049,743 | $ | -1,858,938 | |||||||||||
| Plus: | Fair Value at Year-End of Unvested Stock and Option Awards Granted in the Covered Year* | $ | +1,626,544 | $ | +1,056,425 | $ | +1,275,999 | $ | +2,095,233 | $ | +949,773 | |||||||||||
| Plus: | Fair Value of Stock and Option Awards Granted in the Covered Year that Vested in the Covered Year* | $ | +271,626 | $ | +173,955 | $ | +147,705 | $ | +180,724 | $ | +122,865 | |||||||||||
| Change in Fair Value of Unvested Stock and Option Awards Granted in Prior Years* | $ | +299,760 | $ | -902,246 | $ | +445,775 | $ | +832,854 | $ | -1,127,572 | ||||||||||||
| Change in Fair Value of Stock and Option Awards from Prior Years that Vested in the Covered Year* | $ | +594,099 | $ | -510,980 | $ | +263,119 | $ | +483,874 | $ | -331,886 | ||||||||||||
| Less: | Fair Value of Stock and Option Awards Forfeited During the Covered Year* | $ | -101,683 | $ | +0 | $ | +0 | $ | +0 | $ | +0 | |||||||||||
| = | Compensation Actually Paid | $ | 3,204,518 | $ | 467,192 | $ | 2,851,775 | $ | 4,246,598 | $ | 404,231 | |||||||||||
![]()
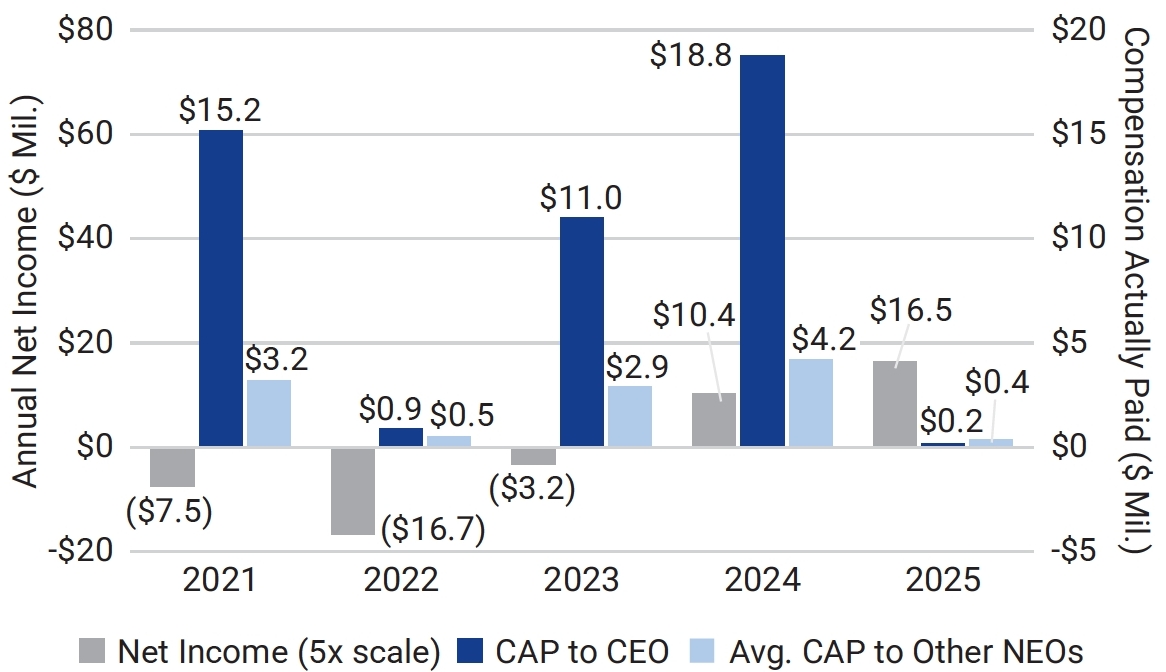
Compensation Actually Paid versus Net Income 2021-2025
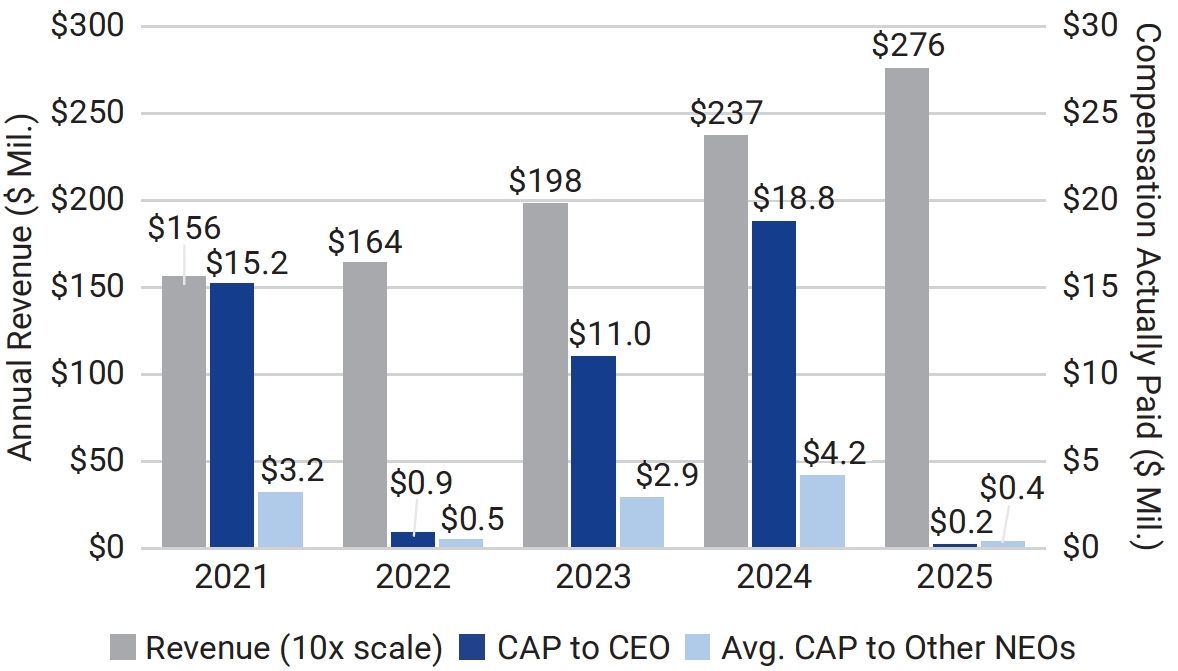
Compensation Actually Paid versus Revenue 2021-2025
![]()
Tabular List of Financial Performance Measures
The following measures in our assessment represent the most important financial performance measures that link compensation actually paid to our named executive officers, for 2025, to Vericel’s performance:
| 1. | Total Net Revenue |
| 2. | Stock Price |
| 3. | Budget expense (excluding depreciation, amortization and stock-based compensation, and unusual one-time expenses or changes in accounting methodology) |
| [1] | To calculate CAP, the following amounts were deducted from and added to the applicable Summary Compensation Table total compensation: |
| [2] | The other NEOs in each covered year were as follows: 2025 – Joe Mara, Michael Halpin, Sean Flynn, Jonathan Hopper; 2024 – Joe Mara, Michael Halpin, Sean Flynn, Jonathan Hopper, Karen Mahoney; 2023 – Joe Mara, Michael Halpin, Jonathan Hopper, Sean Flynn; 2022 – Joe Mara, Michael Halpin, Sean Flynn, Jonathan Hopper; 2021 – Joe Mara, Michael Halpin, Sean Flynn, Jonathan Hopper, Sandra Pennell. |
| [3] | TSR is cumulative for the measurement period, calculated in accordance with Item 201(e) of Regulation S-K. Our TSR Peer Group are members of the NASDAQ Biotechnology Index. |
| [4] | Reflects net Income as shown in the Company’s Annual Report on Form 10-K for the years ending on December 31, 2025, 2024, 2023, 2022 and 2021. |
| [5] | Reflects total net revenue, the “company-selected measure” as shown in the Company’s Annual Report on Form 10-K for the years ending on December 31, 2025, 2024, 2023, 2022 and 2021. |
| [6] | All stock option valuations included in “Compensation Actually Paid” values were performed using the Black-Scholes option pricing model in a manner generally consistent with the process used to determine stock option grant date fair values under ASC718 (refer to our Annual Report on Form 10-K for the year ending December 31, 2025 for additional detail). |