Pay vs Performance Disclosure - USD ($)
Dec. 31, 2023
Jul. 31, 2023
Dec. 31, 2025
Dec. 31, 2024
Dec. 31, 2023
Dec. 31, 2022
Dec. 31, 2021
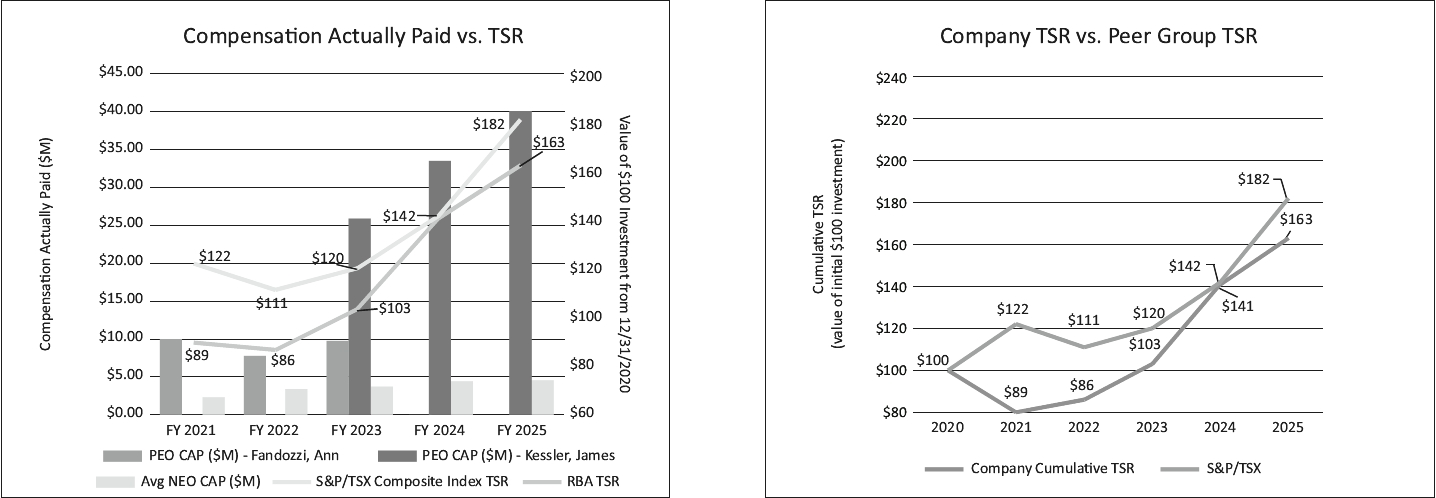
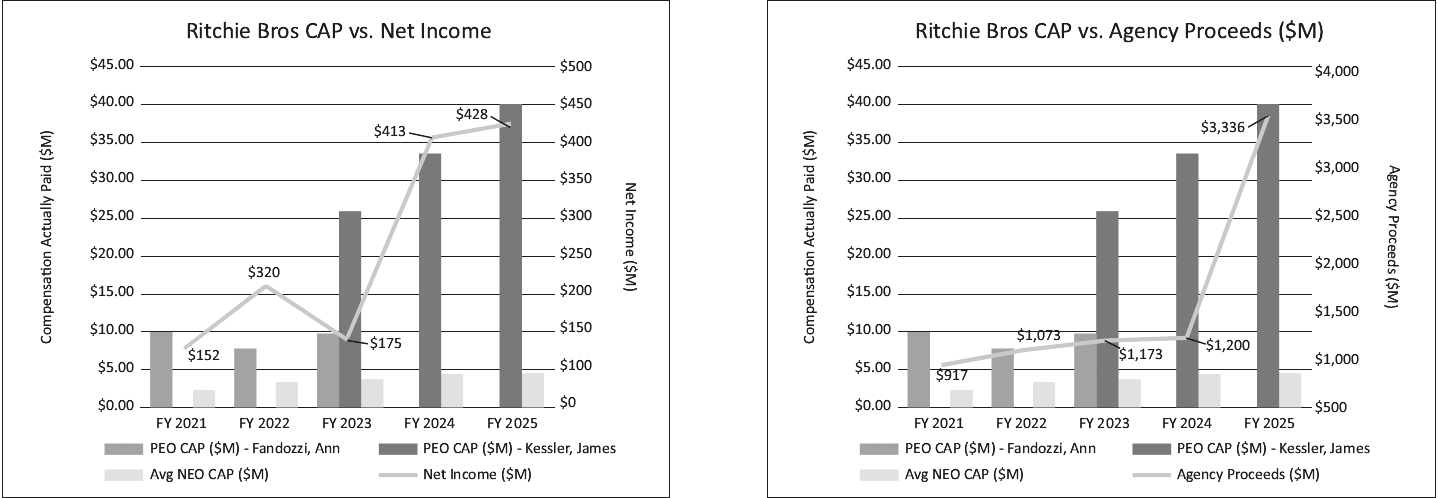
Pay Versus Performance
Value of Initial Fixed $100 Investment Based On: | ||||||||||||||||||||||||||||||||
Fiscal Year | Summary Compensation Table Total for PEO Kessler, James1 | Compensation Actually Paid to PEO Kessler, James2 | Summary Compensation Table Total for PEO Fandozzi, Ann1 | Compensation Actually Paid to PEO Fandozzi, Ann2 | Average Summary Compensation Table Total for non-PEO NEOs3 | Average Compensation Actually Paid to non-PEO NEOs4 | RBA Total Shareholder Return5 | Peer Group Total Shareholder Return6 | Net Income ($M) | Agency Proceeds ($M) | ||||||||||||||||||||||
2025 | $21,551,858 | $40,005,561 | $0 | $0 | $3,583,072 | $4,507,252 | $163 | $182 | $428 | $3,336 | ||||||||||||||||||||||
2024 | $14,786,840 | $33,467,177 | $0 | $0 | $2,986,553 | $4,386,250 | $232 | $145 | $413 | $1,200 | ||||||||||||||||||||||
2023 | $15,928,325 | $25,849,889 | $792,366 | $9,727,850 | $2,811,920 | $3,697,652 | $170 | $123 | $175 | $1,173 | ||||||||||||||||||||||
2022 | $0 | $0 | $7,919,967 | $7,755,014 | $3,552,402 | $3,341,006 | $141 | $114 | $320 | $1,073 | ||||||||||||||||||||||
2021 | $0 | $0 | $10,381,730 | $9,943,897 | $2,997,009 | $2,272,068 | $147 | $124 | $152 | $917 | ||||||||||||||||||||||
$100.00 | $100.00 | |||||||||||||||||||||||||||||||
1. | The Principal Executive Officer (the “PEO”) for 2025 was James Kessler who has served as PEO since August 1, 2023. The PEOs for 2024 were James Kessler, who served as PEO since August 1, 2023, and Ann Fandozzi, who served as PEO from January 6, 2020 through July 31, 2023. Ms. Fandozzi served as PEO in 2020, 2021 and 2022. The Summary Compensation Table on page 70 provides the details of Mr. Kessler’s compensation for the past three years as set forth in column (b). |
2. | SEC rules require certain adjustments be made to the Summary Compensation Table totals to determine “compensation actually paid” as reported in the Pay Versus Performance Table. Compensation actually paid (“CAP”) does not necessarily represent cash and/or equity value transferred to the applicable PEO, but rather is a value calculated under applicable SEC rules. In accordance with Item 402(v) of Regulation S-K, the following adjustments were made to the amount reported for the PEO in the “Total” column of the Summary Compensation Table to calculate CAP. The valuation assumptions used to calculate fair values did not materially differ from those disclosed at the time of the grant. |
Prior FYE Current FYE Fiscal Year | PEO: Mr. Kessler 12/31/2024 12/31/2025 2025 | ||||
SCT Total | $21,551,858 | ||||
- Grant Date Fair Value of Option Awards and Stock Awards Granted in Fiscal Year | ($17,816,348) | ||||
+ Fair Value at Fiscal Year-End of Outstanding and Unvested Option Awards and Stock Awards Granted in Fiscal Year | $25,037,491 | ||||
+ Change in Fair Value of Outstanding and Unvested Option Awards and Stock Awards Granted in Prior Fiscal Years | $8,974,214 | ||||
+ Fair Value at Vesting of Option Awards and Stock Awards Granted in Fiscal Year That Vested During Fiscal Year | $0 | ||||
+Change in Fair Value as of Vesting Date of Option Awards and Stock Awards Granted in Prior Fiscal Years For Which Applicable Vesting Conditions Were Satisfied During Fiscal Year | $2,258,346 | ||||
-Fair Value as of Prior Fiscal Year-End of Option Awards and Stock Awards Granted in Prior Fiscal Years That Failed to Meet Applicable Vesting Conditions During Fiscal Year | $0 | ||||
Compensation Actually Paid | $40,005,561 | ||||
3. | The non-PEO NEOs in 2021 were Sharon Driscoll, Mr. Concors, Mr. Kessler, and Kari Taylor. The non-PEO NEOs for 2022 were Ms. Driscoll, Mr. Concors, Eric Jacobs, Mr. Kessler, and Ms. Thiede. The non-PEO NEOs for 2023 were Ms. Cash, Mr. Concors, Mr. Jacobs, Mr. Jeter, Darren Watt and Ms. Thiede. The non-PEO NEOs for 2024 were Ms. Cash, Mr. Guerin, Mr. Jeter, Ms. King and Mr. Lewis. The non-PEO NEOs for 2025 were Mr. Guerin, Mr. Lewis, Ms. Schmit, Mr. Watt, Mr. Jeter, and Ms. King. The Summary Compensation Table on page 70 provides details of each of the 2025 non-PEO NEOs’ compensation. |
4. | CAP to the non-PEO NEOs in 2025 was calculated as follows: |
Prior FYE Current FYE Fiscal Year | NEO: 12/31/2024 12/31/2025 2025 | ||||
SCT Total | $3,583,072 | ||||
- Grant Date Fair Value of Option Awards and Stock Awards Granted in Fiscal Year | ($1,871,026) | ||||
+ Fair Value at Fiscal Year-End of Outstanding and Unvested Option Awards and Stock Awards Granted in Fiscal Year | $2,309,604 | ||||
+ Change in Fair Value of Outstanding and Unvested Option Awards and Stock Awards Granted in Prior Fiscal Years | $558,492 | ||||
+ Fair Value at Vesting of Option Awards and Stock Awards Granted in Fiscal Year That Vested During Fiscal Year | $0 | ||||
+Change in Fair Value as of Vesting Date of Option Awards and Stock Awards Granted in Prior Fiscal Years For Which Applicable Vesting Conditions Were Satisfied During Fiscal Year | $160,807 | ||||
-Fair Value as of Prior Fiscal Year-End of Option Awards and Stock Awards Granted in Prior Fiscal Years That Failed to Meet Applicable Vesting Conditions During Fiscal Year | ($233,697) | ||||
Compensation Actually Paid | $4,507,252 | ||||
5. | The Company’s TSR is determined based on the value of an initial fixed investment of $100 in Common Shares. |
6. | The Company is using the S&P/TSX Index to measure our peer group TSR performance. The S&P/TSX is the peer group the Company used for purposes of Item 201(e) of Regulation S-K under the Exchange Act in the Company’s Annual Report on Form 10-K for the year ended December 31, 2025. |
7. | The following table identifies the four most important financial performance measures used by our Compensation Committee in 2025 to link the CAP to our PEO and other NEOs. Each of these performance measures is discussed in the CD&A above and defined in the Appendix A: Selected Definitions of Operational and Financial Performance on page 100. |
Financial Performance Measures
Agency Proceeds
OFCF
Earnings CAGR
rTSR
1. | The Principal Executive Officer (the “PEO”) for 2025 was James Kessler who has served as PEO since August 1, 2023. The PEOs for 2024 were James Kessler, who served as PEO since August 1, 2023, and Ann Fandozzi, who served as PEO from January 6, 2020 through July 31, 2023. Ms. Fandozzi served as PEO in 2020, 2021 and 2022. The Summary Compensation Table on page 70 provides the details of Mr. Kessler’s compensation for the past three years as set forth in column (b). |
3. | The non-PEO NEOs in 2021 were Sharon Driscoll, Mr. Concors, Mr. Kessler, and Kari Taylor. The non-PEO NEOs for 2022 were Ms. Driscoll, Mr. Concors, Eric Jacobs, Mr. Kessler, and Ms. Thiede. The non-PEO NEOs for 2023 were Ms. Cash, Mr. Concors, Mr. Jacobs, Mr. Jeter, Darren Watt and Ms. Thiede. The non-PEO NEOs for 2024 were Ms. Cash, Mr. Guerin, Mr. Jeter, Ms. King and Mr. Lewis. The non-PEO NEOs for 2025 were Mr. Guerin, Mr. Lewis, Ms. Schmit, Mr. Watt, Mr. Jeter, and Ms. King. The Summary Compensation Table on page 70 provides details of each of the 2025 non-PEO NEOs’ compensation. |
6. | The Company is using the S&P/TSX Index to measure our peer group TSR performance. The S&P/TSX is the peer group the Company used for purposes of Item 201(e) of Regulation S-K under the Exchange Act in the Company’s Annual Report on Form 10-K for the year ended December 31, 2025. |
2. | SEC rules require certain adjustments be made to the Summary Compensation Table totals to determine “compensation actually paid” as reported in the Pay Versus Performance Table. Compensation actually paid (“CAP”) does not necessarily represent cash and/or equity value transferred to the applicable PEO, but rather is a value calculated under applicable SEC rules. In accordance with Item 402(v) of Regulation S-K, the following adjustments were made to the amount reported for the PEO in the “Total” column of the Summary Compensation Table to calculate CAP. The valuation assumptions used to calculate fair values did not materially differ from those disclosed at the time of the grant. |
Prior FYE Current FYE Fiscal Year | PEO: Mr. Kessler 12/31/2024 12/31/2025 2025 | ||||
SCT Total | $21,551,858 | ||||
- Grant Date Fair Value of Option Awards and Stock Awards Granted in Fiscal Year | ($17,816,348) | ||||
+ Fair Value at Fiscal Year-End of Outstanding and Unvested Option Awards and Stock Awards Granted in Fiscal Year | $25,037,491 | ||||
+ Change in Fair Value of Outstanding and Unvested Option Awards and Stock Awards Granted in Prior Fiscal Years | $8,974,214 | ||||
+ Fair Value at Vesting of Option Awards and Stock Awards Granted in Fiscal Year That Vested During Fiscal Year | $0 | ||||
+Change in Fair Value as of Vesting Date of Option Awards and Stock Awards Granted in Prior Fiscal Years For Which Applicable Vesting Conditions Were Satisfied During Fiscal Year | $2,258,346 | ||||
-Fair Value as of Prior Fiscal Year-End of Option Awards and Stock Awards Granted in Prior Fiscal Years That Failed to Meet Applicable Vesting Conditions During Fiscal Year | $0 | ||||
Compensation Actually Paid | $40,005,561 | ||||
4. | CAP to the non-PEO NEOs in 2025 was calculated as follows: |
Prior FYE Current FYE Fiscal Year | NEO: 12/31/2024 12/31/2025 2025 | ||||
SCT Total | $3,583,072 | ||||
- Grant Date Fair Value of Option Awards and Stock Awards Granted in Fiscal Year | ($1,871,026) | ||||
+ Fair Value at Fiscal Year-End of Outstanding and Unvested Option Awards and Stock Awards Granted in Fiscal Year | $2,309,604 | ||||
+ Change in Fair Value of Outstanding and Unvested Option Awards and Stock Awards Granted in Prior Fiscal Years | $558,492 | ||||
+ Fair Value at Vesting of Option Awards and Stock Awards Granted in Fiscal Year That Vested During Fiscal Year | $0 | ||||
+Change in Fair Value as of Vesting Date of Option Awards and Stock Awards Granted in Prior Fiscal Years For Which Applicable Vesting Conditions Were Satisfied During Fiscal Year | $160,807 | ||||
-Fair Value as of Prior Fiscal Year-End of Option Awards and Stock Awards Granted in Prior Fiscal Years That Failed to Meet Applicable Vesting Conditions During Fiscal Year | ($233,697) | ||||
Compensation Actually Paid | $4,507,252 | ||||
7. | The following table identifies the four most important financial performance measures used by our Compensation Committee in 2025 to link the CAP to our PEO and other NEOs. Each of these performance measures is discussed in the CD&A above and defined in the Appendix A: Selected Definitions of Operational and Financial Performance on page 100. |
Financial Performance Measures
Agency Proceeds
OFCF
Earnings CAGR
rTSR