| Year | Summary
Compensation Table (SCT) Total for PEO 11 ($) |
SCT Total for PEO 21 ($) |
Compensation
Actually Paid to PEO 11,2,3 ($) |
Compensation
Actually Paid to PEO 21,2,3 ($) |
Average
SCT Total for Non-PEO NEOs1 ($) |
Average
Compensation Actually Paid to Non-PEO NEOs1,2,3 ($) |
Value
of Initial Fixed $100 Investment Based on:4 |
Net
Income ($ Millions) |
ROIC
for Compensation Purposes5 | |
| Company TSR ($) |
Peer Group TSR ($) | |||||||||
| (a) | (b) | (c) | (d) | (e) | (f) | (g) | (h) | (i) | (j) | (k) |
| 2025 | 8,394,536 | 10,726,993 | 2,012,285 | 2,590,847 | 222 | 155 | 521 | 20.3% | ||
| 2024 | 7,356,657 | 4,980,729 | 3,236,767 | 1,923,445 | 171 | 144 | 466 | 18.8% | ||
| 2023 | 10,609,670 | 27,971,976 | 3,085,776 | 5,933,007 | 196 | 126 | 545 | 22.6% | ||
| 2022 | 10,096,478 | 14,415,143 | 2,496,792 | 3,176,483 | 128 | 108 | 472 | 28.1% | ||
| 2021 | 9,213,820 | 17,818,888 | 1,978,086 | 3,241,658 | 122 | 125 | 276 | 21.5% | ||
| 1 | Steven Hedlund was our PEO for 2024 through 2025 (“PEO 2”). Christopher Mapes was our PEO for 2021 through 2023 (“PEO 1”). The individuals comprising the non-PEO NEOs for each year presented are listed below. |
| 2025 | 2024 | 2023 | 2022 | 2021 |
| Gabriel Bruno | Gabriel Bruno | Gabriel Bruno | Gabriel Bruno | Gabriel Bruno |
| Jennifer Ansberry | Christopher L. Mapes | Steven Hedlund | Steven Hedlund | Steven Hedlund |
| Michael Whitehead | Jennifer Ansberry | Jennifer Ansberry | Jennifer Ansberry | Jennifer Ansberry |
| Susan Edwards | Michele Kuhrt | Michele Kuhrt | Michele Kuhrt | Michele Kuhrt |
| 2 | The amounts shown for Compensation Actually Paid have been calculated in accordance with Item 402(v) of Regulation S-K and may not necessarily reflect compensation actually earned, realized, or received by the Company’s PEOs and non-PEO NEOs. These amounts reflect the Summary Compensation Table Total column with certain adjustments. For 2025, these adjustments are as described in footnote 3 below. Please note that, while similar adjustment information was provided in previous proxy statements for previous years, under applicable SEC guidance, repeating such adjustment information is not required in this Proxy Statement because in our view it is not material to our shareholders’ understanding of the information reported in the table above for 2025 or the related disclosures provided below. |
| 3 | Compensation Actually Paid for 2025 (the most recent year included in the table above) reflects the exclusions and inclusions of certain amounts for the PEO and the non-PEO NEOs as set forth below. Equity values are calculated in accordance with FASB ASC Topic 718. Amounts in the Exclusion of Stock Awards and Option Awards column are the totals from the Stock Awards and Option Awards columns set forth in the Summary Compensation Table. Amounts in the Exclusion of Change in Pension Value column reflect the amounts attributable to the Change in Pension Value reported in the Summary Compensation Table. |
| Year | Summary Compensation Table Total for PEO 2 ($) |
Exclusion of Change in Pension Value ($) |
Exclusion of Stock Awards and Option Awards ($) |
Inclusion of Pension Service Cost ($) |
Inclusion
of Equity Values ($) |
Compensation Actually Paid to PEO 2($) |
| 2025 | 8,394,536 | — | (5,701,663) | — | 8,034,120 | 10,726,993 |
| Year | Average Summary Compensation Table Total for Non-PEO NEOs ($) |
Exclusion
of Change in Pension Value ($) |
Exclusion
of Stock Awards and Option Awards ($) |
Inclusion
of Pension Service Cost ($) |
Inclusion
of Equity Values ($) |
Average Compensation Actually Paid to Non-PEO NEOs ($) |
| 2025 | 2,012,285 | — | (975,739) | — | 1,554,301 | 2,590,847 |
The amounts in the Inclusion of Equity Values in the tables above are derived from the amounts set forth in the following tables:
| Year | Year-End
Fair Value of Equity Awards Granted During Year That Remained Unvested as of Last Day of Year for PEO 2 ($) |
Change in Fair Value from Last Day of Prior Year to Last Day of Year of Unvested Equity Awards Granted in Prior Years for PEO 2 ($) |
Vesting
Date Fair Value of Equity Awards Granted During Year that Vested During Year for PEO 2 ($) |
Change
in Fair Value from Last Day of Prior Year to Vesting Date of Unvested Equity Awards Granted in Prior Years that Vested During Year for PEO 2 ($) |
Fair
Value at Last Day of Prior Year of Equity Awards Forfeited During Year for PEO 2 ($) |
Total—Inclusion
of Equity Values for PEO 2 ($) |
| 2025 | 5,732,297 | 1,787,230 | — | 514,593 | — | 8,034,120 |
| Year | Average
Year-End Fair Value of Equity Awards Granted During Year That Remained Unvested as of Last Day of Year for Non-PEO NEOs ($) |
Average
Change in Fair Value from Last Day of Prior Year to Last Day of Year of Unvested Equity Awards Granted in Prior Years for Non-PEO NEOs ($) |
Average
Vesting Date Fair Value of Equity Awards Granted During Year that Vested During Year for Non-PEO NEOs ($) |
Average Change in Fair Value from Last Day of Prior Year to Vesting Date of Unvested Equity Awards Granted in Prior Years that Vested During Year for Non-PEO NEOs ($) |
Average
Fair Value at Last Day of Prior Year of Equity Awards Forfeited During Year for Non-PEO NEOs ($) |
Total—Average
Inclusion of Equity Values for Non-PEO NEOs ($) |
| 2025 | 980,972 | 374,004 | — | 199,325 | — | 1,554,301 |
| 4 | The Peer Group Total Shareholder Return (“TSR”) set forth in this table utilizes the S&P 400 Index, which we also utilize in the stock performance graph required by Item 201(e) of Regulation S-K included in our Annual Report for the year ended December 31, 2025. The comparison assumes $100 was invested for the period starting December 31, 2020, through the end of the listed year in the Company and in the S&P 400 Index, respectively. Historical stock performance is not necessarily indicative of future stock performance. |
| 5 | We determined Return on Invested Capital (“ROIC”) for Compensation Purposes to be the most important financial performance measure used to link Company performance to Compensation Actually Paid to our PEO and non-PEO NEOs in 2025. More information on ROIC for Compensation Purposes can be found in Appendix A. |
| 1 | Steven Hedlund was our PEO for 2024 through 2025 (“PEO 2”). Christopher Mapes was our PEO for 2021 through 2023 (“PEO 1”). The individuals comprising the non-PEO NEOs for each year presented are listed below. |
| 2025 | 2024 | 2023 | 2022 | 2021 |
| Gabriel Bruno | Gabriel Bruno | Gabriel Bruno | Gabriel Bruno | Gabriel Bruno |
| Jennifer Ansberry | Christopher L. Mapes | Steven Hedlund | Steven Hedlund | Steven Hedlund |
| Michael Whitehead | Jennifer Ansberry | Jennifer Ansberry | Jennifer Ansberry | Jennifer Ansberry |
| Susan Edwards | Michele Kuhrt | Michele Kuhrt | Michele Kuhrt | Michele Kuhrt |
| 3 | Compensation Actually Paid for 2025 (the most recent year included in the table above) reflects the exclusions and inclusions of certain amounts for the PEO and the non-PEO NEOs as set forth below. Equity values are calculated in accordance with FASB ASC Topic 718. Amounts in the Exclusion of Stock Awards and Option Awards column are the totals from the Stock Awards and Option Awards columns set forth in the Summary Compensation Table. Amounts in the Exclusion of Change in Pension Value column reflect the amounts attributable to the Change in Pension Value reported in the Summary Compensation Table. |
| Year | Summary Compensation Table Total for PEO 2 ($) |
Exclusion of Change in Pension Value ($) |
Exclusion of Stock Awards and Option Awards ($) |
Inclusion of Pension Service Cost ($) |
Inclusion
of Equity Values ($) |
Compensation Actually Paid to PEO 2($) |
| 2025 | 8,394,536 | — | (5,701,663) | — | 8,034,120 | 10,726,993 |
| Year | Average Summary Compensation Table Total for Non-PEO NEOs ($) |
Exclusion
of Change in Pension Value ($) |
Exclusion
of Stock Awards and Option Awards ($) |
Inclusion
of Pension Service Cost ($) |
Inclusion
of Equity Values ($) |
Average Compensation Actually Paid to Non-PEO NEOs ($) |
| 2025 | 2,012,285 | — | (975,739) | — | 1,554,301 | 2,590,847 |
The amounts in the Inclusion of Equity Values in the tables above are derived from the amounts set forth in the following tables:
| Year | Year-End
Fair Value of Equity Awards Granted During Year That Remained Unvested as of Last Day of Year for PEO 2 ($) |
Change in Fair Value from Last Day of Prior Year to Last Day of Year of Unvested Equity Awards Granted in Prior Years for PEO 2 ($) |
Vesting
Date Fair Value of Equity Awards Granted During Year that Vested During Year for PEO 2 ($) |
Change
in Fair Value from Last Day of Prior Year to Vesting Date of Unvested Equity Awards Granted in Prior Years that Vested During Year for PEO 2 ($) |
Fair
Value at Last Day of Prior Year of Equity Awards Forfeited During Year for PEO 2 ($) |
Total—Inclusion
of Equity Values for PEO 2 ($) |
| 2025 | 5,732,297 | 1,787,230 | — | 514,593 | — | 8,034,120 |
| Year | Average
Year-End Fair Value of Equity Awards Granted During Year That Remained Unvested as of Last Day of Year for Non-PEO NEOs ($) |
Average
Change in Fair Value from Last Day of Prior Year to Last Day of Year of Unvested Equity Awards Granted in Prior Years for Non-PEO NEOs ($) |
Average
Vesting Date Fair Value of Equity Awards Granted During Year that Vested During Year for Non-PEO NEOs ($) |
Average Change in Fair Value from Last Day of Prior Year to Vesting Date of Unvested Equity Awards Granted in Prior Years that Vested During Year for Non-PEO NEOs ($) |
Average
Fair Value at Last Day of Prior Year of Equity Awards Forfeited During Year for Non-PEO NEOs ($) |
Total—Average
Inclusion of Equity Values for Non-PEO NEOs ($) |
| 2025 | 980,972 | 374,004 | — | 199,325 | — | 1,554,301 |
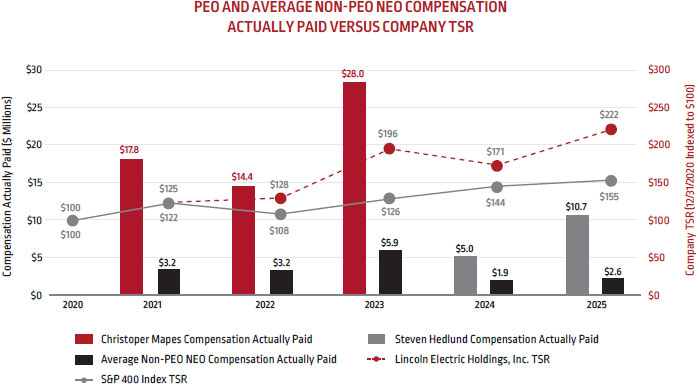
The following chart sets forth the relationship between Compensation Actually Paid to our PEOs, the average of Compensation Actually Paid to our non-PEO NEOs, the Company’s cumulative TSR over the five most recently completed fiscal years, and the cumulative TSR of the S&P 400 Index over the same period assuming initial investment of $100 on December 31, 2020.
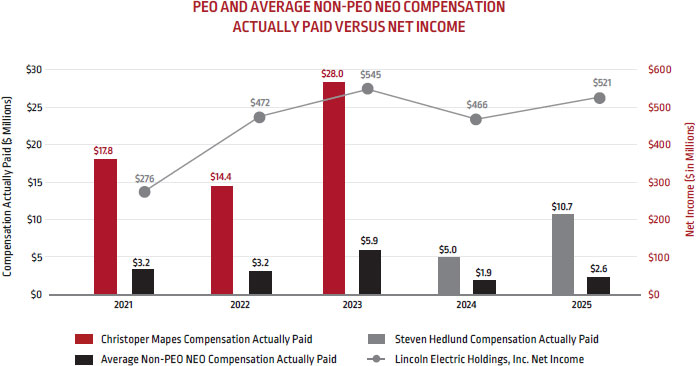
RELATIONSHIP BETWEEN PEO AND NON-PEO NEO COMPENSATION ACTUALLY PAID AND COMPANY NET INCOME
The following chart sets forth the relationship between Compensation Actually Paid to our PEOs, the average of Compensation Actually Paid to our non-PEO NEOs, and our GAAP Net income during the five most recently completed fiscal years.
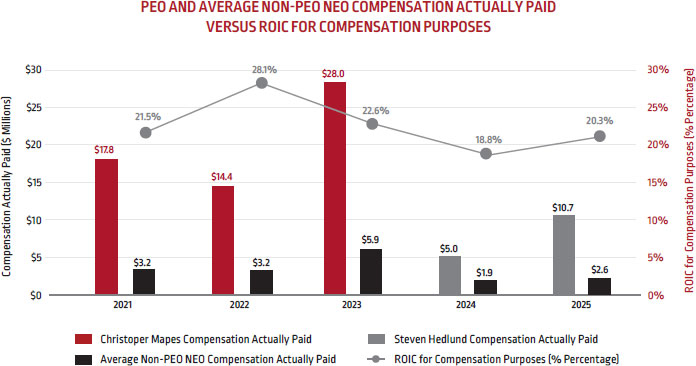
RELATIONSHIP BETWEEN PEO AND NON-PEO NEO COMPENSATION ACTUALLY PAID AND COMPANY ROIC FOR COMPENSATION PURPOSES
The following chart sets forth the relationship between Compensation Actually Paid to our PEOs, the average of Compensation Actually Paid to our non-PEO NEOs, and Company ROIC for Compensation Purposes (annual results) during the five most recently completed fiscal years.
TABULAR LIST OF MOST IMPORTANT FINANCIAL PERFORMANCE MEASURES
The following table presents the financial performance measures that the Company considers to have been the most important in linking Compensation Actually Paid to our PEO and our Non-PEO NEOs for 2025 to Company performance. The measures in this table are not ranked.
| Return on Invested Capital (ROIC) for Compensation Purposes |
| Adjusted earnings before interest, taxes and bonus (EBITB) |
| Net Sales |
| Average operating working capital to net sales ratio (AOWC/Sales) for Compensation Purposes |
| Adjusted Operating Income Margin |
| Adjusted Net Income for Compensation Purposes |
| [1] | Steven Hedlund was our PEO for 2024 through 2025 (“PEO 2”). Christopher Mapes was our PEO for 2021 through 2023 (“PEO 1”). The individuals comprising the non-PEO NEOs for each year presented are listed below. |
| [2] | Compensation Actually Paid for 2025 (the most recent year included in the table above) reflects the exclusions and inclusions of certain amounts for the PEO and the non-PEO NEOs as set forth below. Equity values are calculated in accordance with FASB ASC Topic 718. Amounts in the Exclusion of Stock Awards and Option Awards column are the totals from the Stock Awards and Option Awards columns set forth in the Summary Compensation Table. Amounts in the Exclusion of Change in Pension Value column reflect the amounts attributable to the Change in Pension Value reported in the Summary Compensation Table. |
| [3] | The amounts shown for Compensation Actually Paid have been calculated in accordance with Item 402(v) of Regulation S-K and may not necessarily reflect compensation actually earned, realized, or received by the Company’s PEOs and non-PEO NEOs. These amounts reflect the Summary Compensation Table Total column with certain adjustments. For 2025, these adjustments are as described in footnote 3 below. Please note that, while similar adjustment information was provided in previous proxy statements for previous years, under applicable SEC guidance, repeating such adjustment information is not required in this Proxy Statement because in our view it is not material to our shareholders’ understanding of the information reported in the table above for 2025 or the related disclosures provided below. |
| [4] | The Peer Group Total Shareholder Return (“TSR”) set forth in this table utilizes the S&P 400 Index, which we also utilize in the stock performance graph required by Item 201(e) of Regulation S-K included in our Annual Report for the year ended December 31, 2025. The comparison assumes $100 was invested for the period starting December 31, 2020, through the end of the listed year in the Company and in the S&P 400 Index, respectively. Historical stock performance is not necessarily indicative of future stock performance. |
| [5] | We determined Return on Invested Capital (“ROIC”) for Compensation Purposes to be the most important financial performance measure used to link Company performance to Compensation Actually Paid to our PEO and non-PEO NEOs in 2025. More information on ROIC for Compensation Purposes can be found in Appendix A. |