Pay vs Performance Disclosure
Dec. 31, 2025
USD ($)
$ / shares
Dec. 31, 2024
USD ($)
$ / shares
Dec. 31, 2023
USD ($)
$ / shares
Dec. 31, 2022
USD ($)
$ / shares
Dec. 31, 2021
USD ($)
$ / shares
Summary Compensation Table Total for PEO | Compensation Actually Paid to PEO | Average Summary Compensation Table Total for Other NEOs | Average Compensation Actually Paid to Other NEOs | Value of initial fixed $100 investment based on: | Net income (thousands) | Earnings Per Share – Diluted | ||||||||||||||||||||||||||||||||||||||||||||
| TSR | TSR of peer group | |||||||||||||||||||||||||||||||||||||||||||||||||
| Year | (1) | (2) | (3) | (4) | (5) | (6) | (7) | (8) | ||||||||||||||||||||||||||||||||||||||||||
| 2025 | $ | 1,639,497 | $ | 1,815,816 | $ | 1,120,759 | $ | 1,173,545 | $ | 167.71 | $ | 211.47 | $ | 111,048 | $ | 2.68 | ||||||||||||||||||||||||||||||||||
| 2024 | 1,337,466 | 1,636,997 | 1,140,598 | 1,365,328 | 142.38 | 164.70 | 76,215 | 1.84 | ||||||||||||||||||||||||||||||||||||||||||
| 2023 | 1,257,821 | 1,101,980 | 1,101,893 | 1,066,585 | 117.09 | 123.02 | 104,131 | 2.53 | ||||||||||||||||||||||||||||||||||||||||||
| 2022 | 1,461,502 | 1,468,896 | 1,348,570 | 1,273,741 | 131.93 | 112.77 | 146,936 | 4.12 | ||||||||||||||||||||||||||||||||||||||||||
| 2021 | 1,487,248 | 1,914,929 | 1,205,843 | 1,320,992 | 137.66 | 135.97 | 95,644 | 3.19 | ||||||||||||||||||||||||||||||||||||||||||
(3)The dollar amounts represent the average of the amounts reported for the Other NEOs as a group in the “Total” column of the SCT in each applicable year. The names of each of the Other NEOs included for purposes of calculating the average amounts in each applicable year are as follows: (i) for 2025 and 2024, Mr. Mayer, Ms. Bostian, Mr. Currie and Mr. Wilson; (ii) for 2023 and 2022, Mr. Mayer, Ms. Bostian, and Mr. Currie; and (iii) for 2021, Mr. Mayer, Eric P. Credle, Ms. Bostian, and Mr. Currie.
| Year | Reported Summary Compensation Table Total for PEO | Reported Value of Stock Awards (a) | Stock Award Adjustment (b) | Compensation Actually Paid to PEO | ||||||||||||||||||||||
| 2025 | $ | 1,639,497 | $ | (774,381) | $ | 950,700 | $ | 1,815,816 | ||||||||||||||||||
| 2024 | 1,337,466 | (634,857) | 934,388 | 1,636,997 | ||||||||||||||||||||||
| 2023 | 1,257,821 | (585,000) | 429,159 | 1,101,980 | ||||||||||||||||||||||
| 2022 | 1,461,502 | (670,600) | 677,994 | 1,468,896 | ||||||||||||||||||||||
| 2021 | 1,487,248 | (674,320) | 1,102,001 | 1,914,929 | ||||||||||||||||||||||
(a)Represents the total grant date fair value of equity awards reported in the “Stock Awards” and “Option Awards” columns in the SCT for the applicable year.
(b)Represents the current year change in value of stock awards calculated as the sum of the following: (i) the year-end fair value of any unvested equity awards granted in the current year; (ii) the change in fair value during the year of any remaining unvested equity awards granted in a prior year; (iii) fair value of any equity awards that are both granted and vest in the current year; and (iv) the change in fair value for awards granted in prior years that vest in the current year (calculated as fair value on the vesting date less fair value at the end of the prior year). For the periods presented, there were no awards granted in prior years that were determined to fail to meet the applicable vesting conditions. The dollar value of dividends paid on equity awards are included in total compensation in the SCT for the applicable year. The valuation assumptions used to calculate fair values did not materially differ from those disclosed at the time of grant. The amounts deducted or added in calculating the equity award adjustments are as follows:
| Year | Fair Value as of Vesting Date of Equity Awards Granted and Vested in Same Year | Fair Value Change of Equity Awards Issued in Prior Year and Vested in Current Year | Year-End Fair Value of Unvested Equity Awards Granted During that Year | Year Over Year Change in Fair Value of Unvested Equity Awards | Total | |||||||||||||||||||||||||||
| 2025 | $ | — | $ | (31,243) | $ | 772,657 | $ | 209,286 | $ | 950,700 | ||||||||||||||||||||||
| 2024 | 24,931 | 54,050 | 631,761 | 223,646 | 934,388 | |||||||||||||||||||||||||||
| 2023 | 60,610 | (218,445) | 746,171 | (159,177) | 429,159 | |||||||||||||||||||||||||||
| 2022 | 62,032 | (3,914) | 707,117 | (87,241) | 677,994 | |||||||||||||||||||||||||||
| 2021 | 62,149 | 11,949 | 684,139 | 343,764 | 1,102,001 | |||||||||||||||||||||||||||
| Year | Average Reported Summary Compensation Table Total for Other NEOs | Average Reported Value of Stock Awards (a) | Average Stock Award Adjustment (b) | Average Compensation Actually Paid to Other NEOs | ||||||||||||||||||||||
| 2025 | $ | 1,120,759 | $ | (300,390) | $ | 353,176 | $ | 1,173,545 | ||||||||||||||||||
| 2024 | 1,140,598 | (354,734) | 579,464 | 1,365,328 | ||||||||||||||||||||||
| 2023 | 1,101,893 | (393,536) | 358,228 | 1,066,585 | ||||||||||||||||||||||
| 2022 | 1,348,570 | (466,094) | 391,265 | 1,273,741 | ||||||||||||||||||||||
| 2021 | 1,205,843 | (588,844) | 703,993 | 1,320,992 | ||||||||||||||||||||||
(a)Represents the average total grant date fair value of equity awards reported in the “Stock Awards” and “Option Awards” columns in the SCT for the Other NEOs.
(b)Represents the current year change in value of stock awards calculated as the sum of the following: (i) the year-end fair value of any unvested equity awards granted in the current year; (ii) the change in fair value during the year of any remaining unvested equity awards granted in a prior year; (iii) fair value of any equity awards that are both granted and vest in the current year; and (iv) the change in fair value for awards granted in prior years that vest in the current year (calculated as fair value on the vesting date less fair value at the end of the prior year). For the periods presented, there were no awards granted in prior years that were determined to fail to meet the applicable vesting conditions. The dollar value of dividends paid on equity awards are included in total compensation in the SCT for the applicable year. The valuation assumptions used to
calculate fair values did not materially differ from those disclosed at the time of grant. The amounts deducted or added in calculating the equity award adjustments are as follows:
| Year | Fair Value as of Vesting Date of Equity Awards Granted and Vested in Same Year | Fair Value Change of Equity Awards Issued in Prior Year and Vested in Current Year | Year-End Fair Value of Unvested Equity Awards Granted During that Year | Year Over Year Change in Fair Value of Unvested Equity Awards | Total | |||||||||||||||||||||||||||
| 2025 | $ | — | $ | (7,658) | $ | 265,090 | $ | 95,744 | $ | 353,176 | ||||||||||||||||||||||
| 2024 | 24,609 | 59,276 | 393,678 | 101,901 | 579,464 | |||||||||||||||||||||||||||
| 2023 | 60,384 | (80,697) | 495,247 | (116,706) | 358,228 | |||||||||||||||||||||||||||
| 2022 | 37,395 | (2,053) | 407,727 | (51,804) | 391,265 | |||||||||||||||||||||||||||
| 2021 | 23,150 | 10,459 | 546,197 | 124,187 | 703,993 | |||||||||||||||||||||||||||
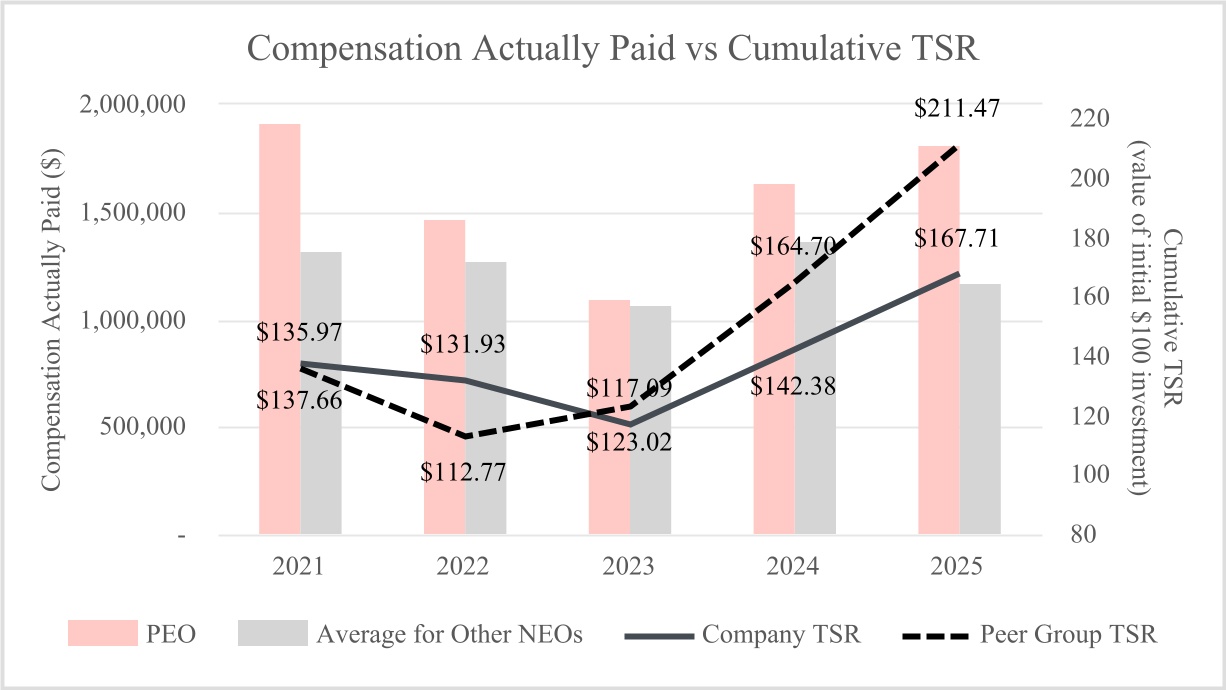
The following graphs set forth the relationship between our PEO's CAP and the average of our Other NEOs' CAP, to (i) cumulative TSR over the five most recently completed fiscal years for the Company and our peer group, (ii) our net income, and (iii) our D-EPS. CAP is influenced by a number of factors, including, but not limited to, the timing of equity award vesting, share price volatility over time, Company performance, changes in NEOs over time and other factors. Net income and D-EPS were impacted by the following: the 2021 acquisition of Select Bancorp and the impact of related expenses on net income; the 2023 acquisition of GrandSouth Bancorporation and the impact of related expenses on net income; the 2024 impact of the securities loss-earnback transaction; and the 2025 impact of the securities loss-earnback transactions. The following graphs showing net income and D-EPS also include Adjusted Net Income and Adjusted D-EPS for 2024 and 2025 only. The reconciliation from net income to Adjusted Net Income and D-EPS to Adjusted D-EPS are included in the Appendix. Prior years were not presented on an adjusted basis.
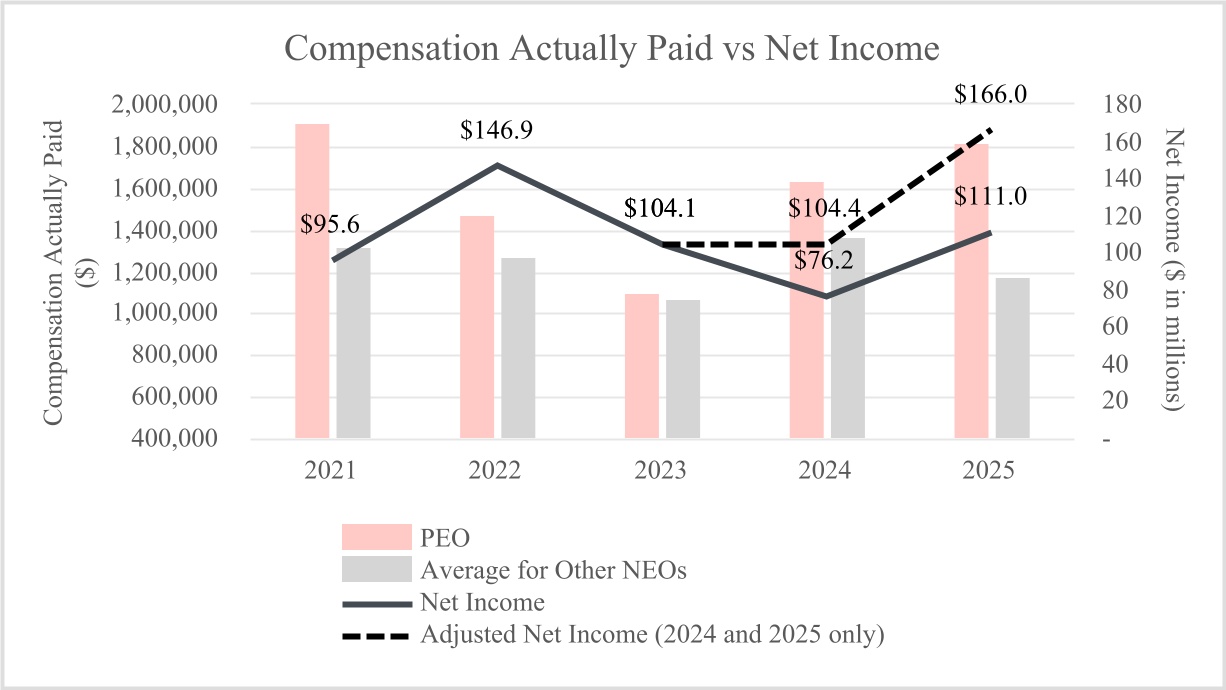
The reconciliation from net income to Adjusted Net Income is presented in the Appendix.
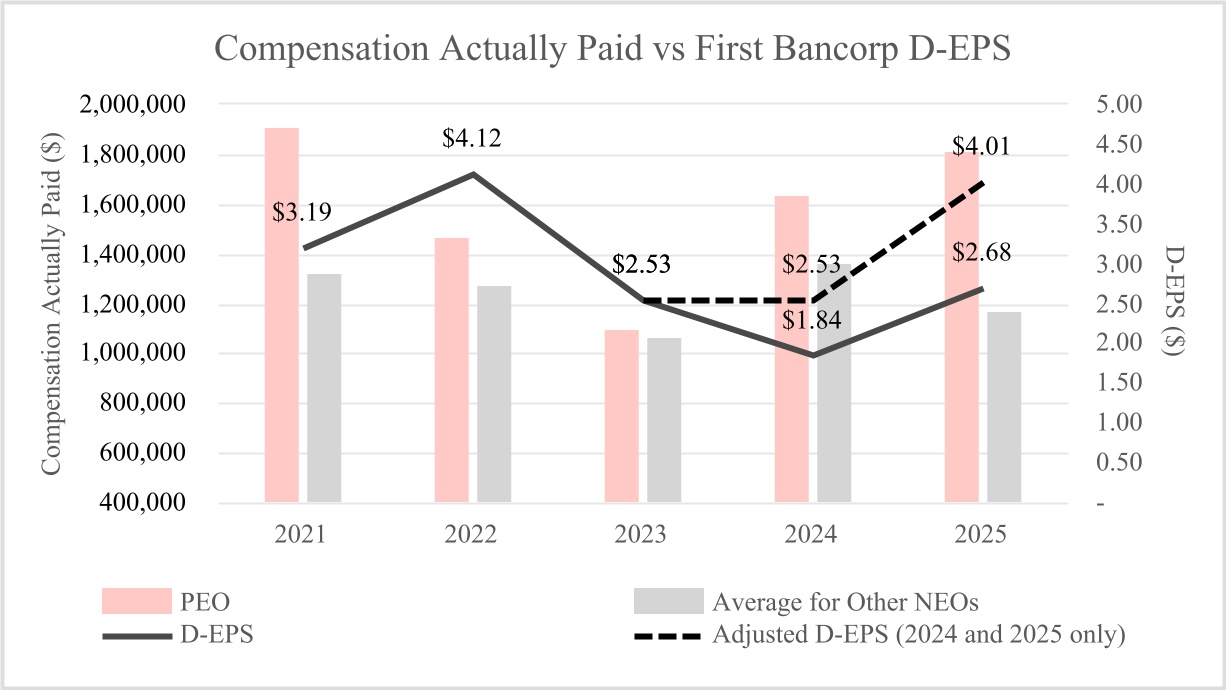
The reconciliation from D-EPS to Adjusted D-EPS is presented in the Appendix.
The following graphs set forth the relationship between our PEO's CAP and the average of our Other NEOs' CAP, to (i) cumulative TSR over the five most recently completed fiscal years for the Company and our peer group, (ii) our net income, and (iii) our D-EPS. CAP is influenced by a number of factors, including, but not limited to, the timing of equity award vesting, share price volatility over time, Company performance, changes in NEOs over time and other factors. Net income and D-EPS were impacted by the following: the 2021 acquisition of Select Bancorp and the impact of related expenses on net income; the 2023 acquisition of GrandSouth Bancorporation and the impact of related expenses on net income; the 2024 impact of the securities loss-earnback transaction; and the 2025 impact of the securities loss-earnback transactions. The following graphs showing net income and D-EPS also include Adjusted Net Income and Adjusted D-EPS for 2024 and 2025 only. The reconciliation from net income to Adjusted Net Income and D-EPS to Adjusted D-EPS are included in the Appendix. Prior years were not presented on an adjusted basis.