Pay vs Performance Disclosure
|
12 Months Ended |
|
Dec. 31, 2025
USD ($)
|
Dec. 31, 2024
USD ($)
|
Dec. 31, 2023
USD ($)
|
Dec. 31, 2022
USD ($)
|
| Pay vs Performance Disclosure |
|
|
|
|
| Pay vs Performance Disclosure, Table |
| | | | | | | | | | | | | | | | | | | | | | | | | | | | | | | | | | | | | Year | Summary Compensation
Table Total
for PEO ($) | Compensation
Actually Paid
to PEO(1) ($) | Average
Summary
Compensation
Table Total for
Non-PEO NEOs(2) ($) | | Average
Compensation
Actually Paid
to Non-PEO
NEOs(1) ($) | | Value of Initial Fixed $100
Investment Based on: | | Net Income(5) ($ in thousands) | Company
Selected
Performance
Measure - Organic
Revenue
Growth*(6) | Company
Total
Shareholder
Return(3) | Peer Group
Total
Shareholder
Return(4) | | | 2025 | 18,562,794 | | 19,551,725 | | 5,688,885 | | | 5,737,599 | | | 136.20 | 121.98 | | 2,154,000 | 3.5 | % | 2024(7) | 19,487,880 | | 13,412,402 | | 5,179,648 | | | 4,407,267 | | | 129.59 | 113.61 | | 2,050,000 | 1 | % | 2023(7) | 24,510,947 | | 29,849,747 | | 9,127,208 | | | 8,514,786 | | | 127.98 | 100.66 | | 1,614,000 | 8 | % | 2022(8) | 10,497,102 | | 7,343,420 | | 4,705,283 | | | 2,963,509 | | | N/A | N/A | | 1,967,000 | 7 | % |
|
|
|
|
| Company Selected Measure Name |
Organic revenue growth*
|
|
|
|
| Named Executive Officers, Footnote |
The dollar amounts reported represent the average of amounts reported for our NEOs as a group (excluding our CEO) in the “Total” column of the SCT in each applicable year. The names of each of the NEOs included for these purposes in each applicable year are as follows: (1) for 2025, Messrs. Saccaro, Kass-Hout, and Jimenez and Ms. Bankes, (2) for 2024, Messrs. Saccaro, Kass-Hout, Jimenez, and Rott, (3) for 2023, Messrs. Saccaro, Kass-Hout, Jimenez, Makela, and Zodl, and (4) for 2022, Messrs. Zodl, Jimenez, and Makela and Ms. Larson.
|
|
|
|
| Peer Group Issuers, Footnote |
The peer group used for this purpose is our Compensation Peer Group. See “Compensation Peer Group” on page 36 for more information.
|
|
|
|
| PEO Total Compensation Amount |
$ 18,562,794
|
$ 19,487,880
|
$ 24,510,947
|
$ 10,497,102
|
| PEO Actually Paid Compensation Amount |
$ 19,551,725
|
13,412,402
|
29,849,747
|
7,343,420
|
| Adjustment To PEO Compensation, Footnote |
CAP to our PEO and the average CAP to our non-PEO NEOs reflect adjustments from total compensation reported in the Summary Compensation Table (“SCT”). The assumptions used to calculate the values for RSUs, PSUs, and Options included in the calculation of CAP did not differ materially from those used to calculate the grant date fair value for such awards. A Monte Carlo simulation model was used to calculate the fair value for PSUs as of the applicable year-end measurement date. A Black-Scholes value was used for Options as of the applicable year-end or vesting date(s), determined using the same methodology used to determine grant date fair value, except that (1) the closing stock price on the applicable reevaluation date was used as the current market price and (2) a reduced expected life was used, given applicable time lapse since grant date. The calculation of CAP for the PEO and Non-PEO NEOs for 2025 is shown in the table below: | | | | | | | | | Compensation Actually Paid | 2025 | PEO ($) | Average
Non-PEO NEOs
($) | SCT Total | 18,562,794 | | 5,688,885 | | Subtract, value of all stock awards and stock options reported in SCT | 14,874,503 | | 3,979,227 | | Add, year-end value of all equity awards granted in the fiscal year that were unvested and outstanding at year-end | 14,286,730 | | 4,010,166 | | Add, change in fair value from prior year-end to current year-end of all prior-year equity awards that were outstanding and unvested at year-end | (362,691) | | (121,505) | | | Add, change in fair value (from prior year-end to vesting date) of prior-year equity awards that vested in fiscal year | 1,945,526 | | 139,280 | | | Less, Change in Present Value of Accumulated Retirement Benefit | 6,131 | | — | | Total Adjustments | 988,931 | | 48,714 | | Compensation Actually Paid | 19,551,725 | | 5,737,599 | |
|
|
|
|
| Non-PEO NEO Average Total Compensation Amount |
$ 5,688,885
|
5,179,648
|
9,127,208
|
4,705,283
|
| Non-PEO NEO Average Compensation Actually Paid Amount |
$ 5,737,599
|
4,407,267
|
8,514,786
|
2,963,509
|
| Adjustment to Non-PEO NEO Compensation Footnote |
CAP to our PEO and the average CAP to our non-PEO NEOs reflect adjustments from total compensation reported in the Summary Compensation Table (“SCT”). The assumptions used to calculate the values for RSUs, PSUs, and Options included in the calculation of CAP did not differ materially from those used to calculate the grant date fair value for such awards. A Monte Carlo simulation model was used to calculate the fair value for PSUs as of the applicable year-end measurement date. A Black-Scholes value was used for Options as of the applicable year-end or vesting date(s), determined using the same methodology used to determine grant date fair value, except that (1) the closing stock price on the applicable reevaluation date was used as the current market price and (2) a reduced expected life was used, given applicable time lapse since grant date. The calculation of CAP for the PEO and Non-PEO NEOs for 2025 is shown in the table below: | | | | | | | | | Compensation Actually Paid | 2025 | PEO ($) | Average
Non-PEO NEOs
($) | SCT Total | 18,562,794 | | 5,688,885 | | Subtract, value of all stock awards and stock options reported in SCT | 14,874,503 | | 3,979,227 | | Add, year-end value of all equity awards granted in the fiscal year that were unvested and outstanding at year-end | 14,286,730 | | 4,010,166 | | Add, change in fair value from prior year-end to current year-end of all prior-year equity awards that were outstanding and unvested at year-end | (362,691) | | (121,505) | | | Add, change in fair value (from prior year-end to vesting date) of prior-year equity awards that vested in fiscal year | 1,945,526 | | 139,280 | | | Less, Change in Present Value of Accumulated Retirement Benefit | 6,131 | | — | | Total Adjustments | 988,931 | | 48,714 | | Compensation Actually Paid | 19,551,725 | | 5,737,599 | |
|
|
|
|
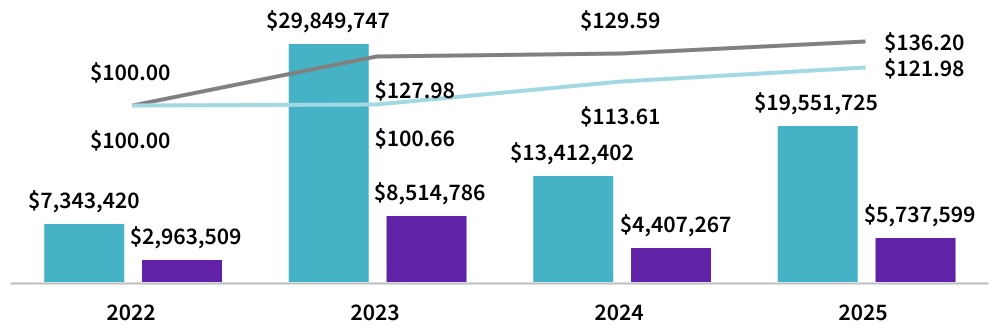
| Compensation Actually Paid vs. Total Shareholder Return |
Compensation Actually Paid vs. Total Shareholder Return | | | | | | | | | | | | | | | | | | | | | | | | | | | | | | | | | g | Compensation Actually Paid to PEO | | g | Average Compensation Actually Paid to Other NEOs | | | GEHC TSR | |
| Peer Group TSR |
|
|
|
|
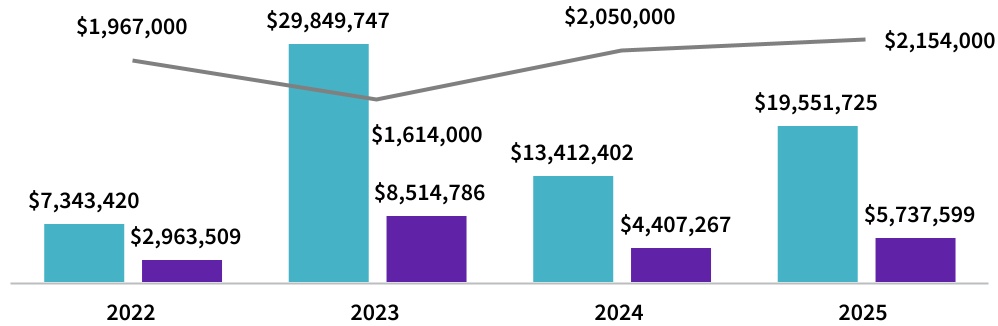
| Compensation Actually Paid vs. Net Income |
Compensation Actually Paid vs. Net Income | | | | | | | | | | | | | | | | | | | | | | | | g | Compensation Actually Paid to PEO | | g | Average Compensation Actually Paid to Other NEOs | | | Net Income (In Thousands) |
|
|
|
|
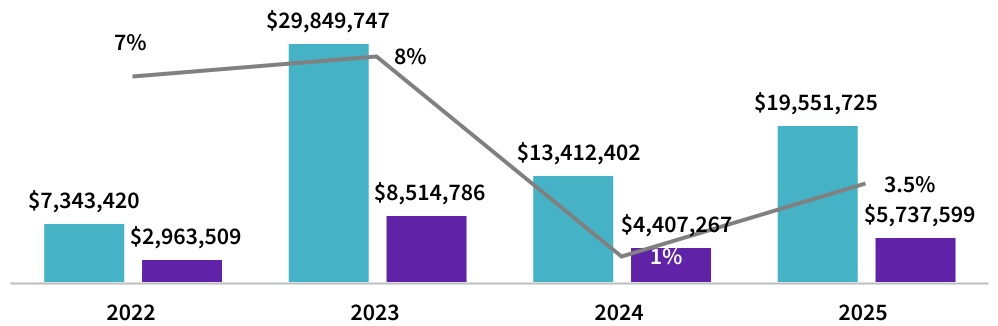
| Compensation Actually Paid vs. Company Selected Measure |
Compensation Actually Paid vs. Organic Revenue Growth* | | | | | | | | | | | | | | | | | | | | | | | | g | Compensation Actually Paid to PEO | | g | Average Compensation Actually Paid to Other NEOs | | | Organic Revenue Growth* |
* Non-GAAP financial measure. See the Appendix for additional information and definitions of these non-GAAP financial measures.
|
|
|
|
| Tabular List, Table |
Three Most Important Measures for Linking NEO Pay to Company Performance •Organic revenue growth* •Adjusted EBIT* •Free cash flow*
|
|
|
|
| Total Shareholder Return Amount |
$ 136.20
|
129.59
|
127.98
|
|
| Peer Group Total Shareholder Return Amount |
121.98
|
113.61
|
100.66
|
|
| Net Income (Loss) |
$ 2,154,000
|
$ 2,050,000
|
$ 1,614,000
|
$ 1,967,000
|
| Company Selected Measure Amount |
0.035
|
0.01
|
0.08
|
0.07
|
| Additional 402(v) Disclosure |
Reflects our TSR, assuming dividend reinvestment, from January 4, 2023, through December 31, 2025.Reflects Net income as reported in each of our Annual Reports on Form 10-K for 2025, 2024, 2023, and 2022. As noted in the Summary Compensation Table, charitable matching contributions made on behalf of NEOs in 2024 and 2023 have been added for completeness. Specifically, a matching gift of $250 made by the GE HealthCare Foundation based on Mr. Saccaro’s charitable contributions has been included for the 2024 amounts, and a matching gift of $3,350 made by the Company based on Mr. Jimenez’s charitable contributions has been included for 2023 amounts.We became an independent, public company effective January 3, 2023, but were required to report pursuant to Section 13(a) or 15(d) of the Exchange Act effective as of December 8, 2022. Because we were a subsidiary of GE during 2022, CAP for our NEOs was largely driven by GE’s stock price and did not bear a close relationship to our Net income or Organic revenue growth* for 2022. The Company did not have a TSR in 2022. * Non-GAAP financial measure. See the Appendix for additional information and definitions of these non-GAAP financial measures.
|
|
|
|
| Measure:: 1 |
|
|
|
|
| Pay vs Performance Disclosure |
|
|
|
|
| Name |
Organic revenue growth*
|
|
|
|
| Non-GAAP Measure Description |
For details on Organic revenue* for 2025, 2024, 2023, and 2022, see Item 7 in each of our Annual Reports on Form 10-K for 2025, 2024, 2023, and 2022.
|
|
|
|
| Measure:: 2 |
|
|
|
|
| Pay vs Performance Disclosure |
|
|
|
|
| Name |
Adjusted EBIT*
|
|
|
|
| Measure:: 3 |
|
|
|
|
| Pay vs Performance Disclosure |
|
|
|
|
| Name |
Free cash flow*
|
|
|
|
| PEO |
|
|
|
|
| Pay vs Performance Disclosure |
|
|
|
|
| Adjustment to Compensation, Amount |
$ 988,931
|
|
|
|
| PEO | Aggregate Change in Present Value of Accumulated Benefit for All Pension Plans Reported in Summary Compensation Table |
|
|
|
|
| Pay vs Performance Disclosure |
|
|
|
|
| Adjustment to Compensation, Amount |
(6,131)
|
|
|
|
| PEO | Aggregate Grant Date Fair Value of Equity Award Amounts Reported in Summary Compensation Table |
|
|
|
|
| Pay vs Performance Disclosure |
|
|
|
|
| Adjustment to Compensation, Amount |
(14,874,503)
|
|
|
|
| PEO | Year-end Fair Value of Equity Awards Granted in Covered Year that are Outstanding and Unvested |
|
|
|
|
| Pay vs Performance Disclosure |
|
|
|
|
| Adjustment to Compensation, Amount |
14,286,730
|
|
|
|
| PEO | Year-over-Year Change in Fair Value of Equity Awards Granted in Prior Years That are Outstanding and Unvested |
|
|
|
|
| Pay vs Performance Disclosure |
|
|
|
|
| Adjustment to Compensation, Amount |
(362,691)
|
|
|
|
| PEO | Change in Fair Value as of Vesting Date of Prior Year Equity Awards Vested in Covered Year |
|
|
|
|
| Pay vs Performance Disclosure |
|
|
|
|
| Adjustment to Compensation, Amount |
1,945,526
|
|
|
|
| Non-PEO NEO |
|
|
|
|
| Pay vs Performance Disclosure |
|
|
|
|
| Adjustment to Compensation, Amount |
48,714
|
|
|
|
| Charitable Matching Contributions |
|
$ 250
|
$ 3,350
|
|
| Non-PEO NEO | Aggregate Change in Present Value of Accumulated Benefit for All Pension Plans Reported in Summary Compensation Table |
|
|
|
|
| Pay vs Performance Disclosure |
|
|
|
|
| Adjustment to Compensation, Amount |
0
|
|
|
|
| Non-PEO NEO | Aggregate Grant Date Fair Value of Equity Award Amounts Reported in Summary Compensation Table |
|
|
|
|
| Pay vs Performance Disclosure |
|
|
|
|
| Adjustment to Compensation, Amount |
(3,979,227)
|
|
|
|
| Non-PEO NEO | Year-end Fair Value of Equity Awards Granted in Covered Year that are Outstanding and Unvested |
|
|
|
|
| Pay vs Performance Disclosure |
|
|
|
|
| Adjustment to Compensation, Amount |
4,010,166
|
|
|
|
| Non-PEO NEO | Year-over-Year Change in Fair Value of Equity Awards Granted in Prior Years That are Outstanding and Unvested |
|
|
|
|
| Pay vs Performance Disclosure |
|
|
|
|
| Adjustment to Compensation, Amount |
(121,505)
|
|
|
|
| Non-PEO NEO | Change in Fair Value as of Vesting Date of Prior Year Equity Awards Vested in Covered Year |
|
|
|
|
| Pay vs Performance Disclosure |
|
|
|
|
| Adjustment to Compensation, Amount |
$ 139,280
|
|
|
|