v3.26.1
Pay vs Performance Disclosure
12 Months Ended
Dec. 31, 2025
USD ($)
Dec. 31, 2024
USD ($)
Dec. 31, 2023
USD ($)
Dec. 31, 2022
USD ($)
Dec. 31, 2021
USD ($)
Pay vs Performance Disclosure          
Pay vs Performance Disclosure, Table

Pay versus Performance

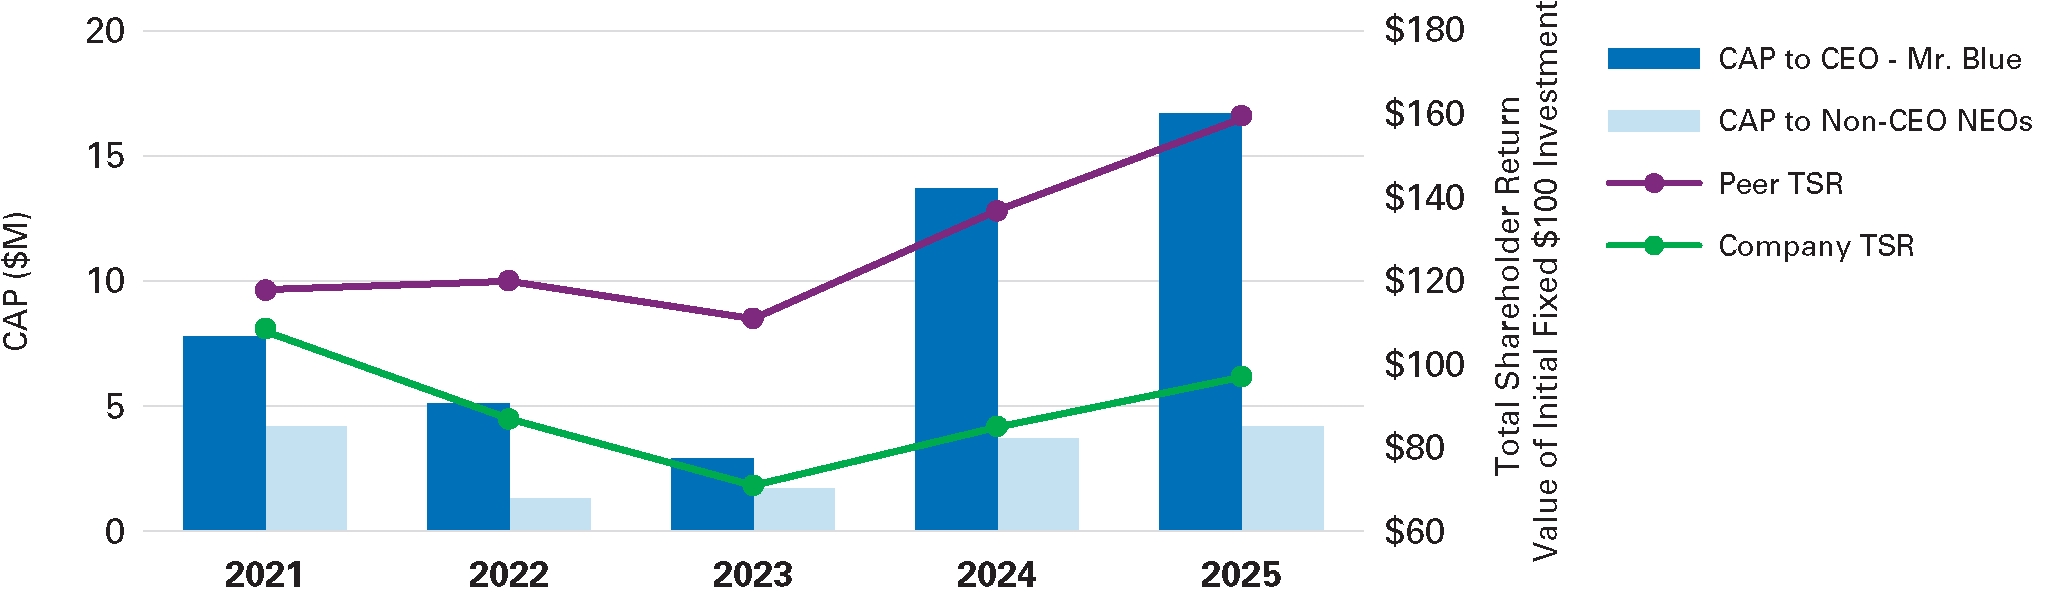
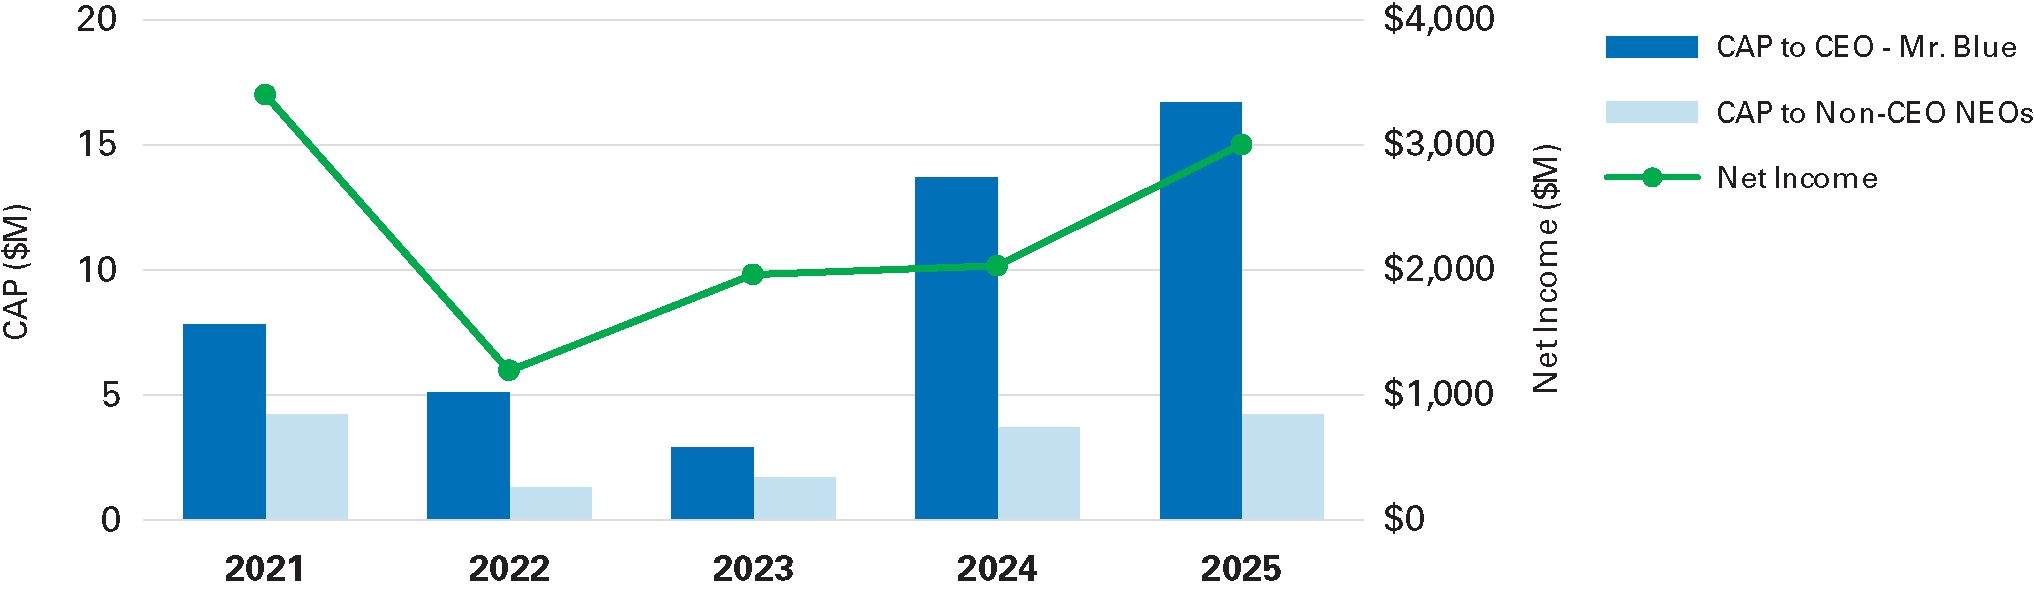
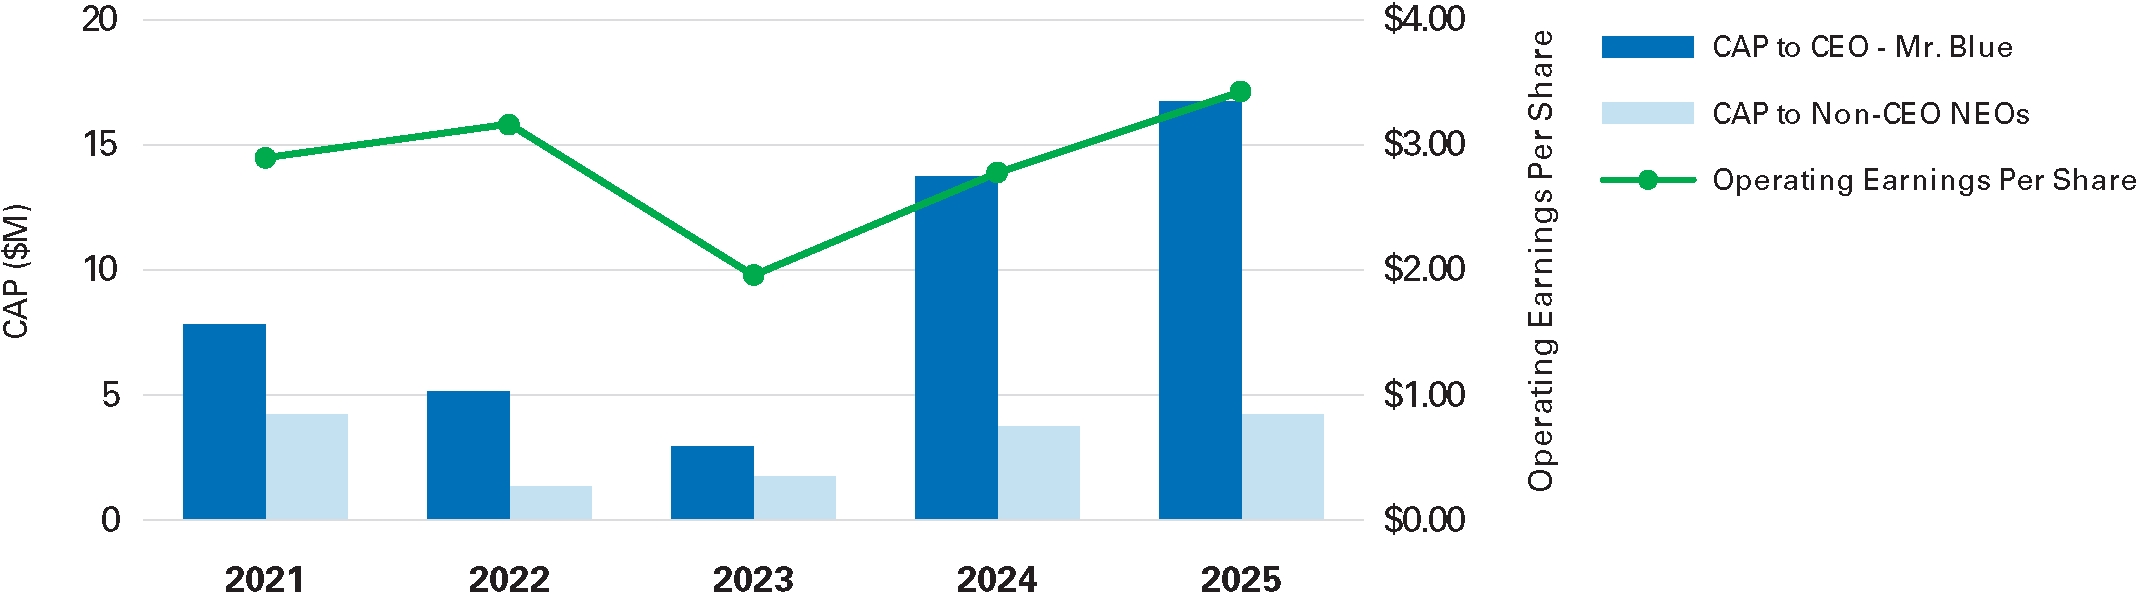
In this section, we provide information about the relationship between the compensation paid to our NEOs and the financial performance of the company, as required by SEC rules. The following table shows the past five fiscal years’ total compensation for our CEO and other NEOs (expressed as an average) as set forth in the Summary Compensation Table, the total compensation actually paid (CAP) to our CEO and other NEOs (expressed as an average), our TSR, our peer group’s TSR over the same period, our net income and our operating EPS.

Pay vs. Performance Table


Average
Summary

Average

Value of Initial Fixed $100
Investment Based On:


Year

Summary
Compensation
Table Total for
CEO
(1) ($)

Compensation
Actually Paid
to CEO
(1)(6) ($)

Compensation
Table Total
for Non-CEO
NEOs
(2) ($)

Compensation
Actually Paid
to Non-CEO
NEOs
(2)(6) ($)

Total
Shareholder
Return
(3) ($)

Peer Group
Total
Shareholder
Return
(3) ($)

Net
Income
(4) ($)
(in millions)

Operating
Earnings Per
Share
(5) ($)


2025


16,037,850


16,650,230


4,011,901


4,192,747


97


159


2,998


3.42


2024


12,904,625


13,741,422


3,578,383


3,743,524


85


137


2,034


2.77


2023


6,278,835


2,851,310


2,525,850


1,690,381


71


111


1,962


1.95


2022


6,794,985


5,095,318


2,042,074


1,260,497


87


120


1,191


3.16


2021


8,161,083


7,796,007


5,002,308


4,186,674


108


118


3,399


2.89


(1)
The amounts in these columns reflect the Summary Compensation Table and CAP totals, respectively, for Mr. Blue for fiscal years 2021–2025. See footnote 6 below for additional information on how CAP is calculated.
(2)
The amounts in these columns reflect the average Summary Compensation Table and average CAP totals, respectively, for our non-CEO NEOs. For 2025, our non-CEO NEOs were Messrs Ridge, Brown, Baine and Carr. For 2024, our non-CEO NEOs were Messrs. Ridge, Brown and Baine and Ms. Diane Leopold. For 2023, our non-CEO NEOs were Messrs. Ridge, Brown, Baine, Mr. Daniel G. Stoddard and Ms. Leopold. For 2022, our non-CEO NEOs were Messrs. Ridge, Stoddard, Brown, Mr. James R. Chapman and Ms. Leopold. For 2021, our non-CEO NEOs were Messrs. Chapman, Stoddard, Brown, Mr. Thomas F. Farrell, II and Ms. Leopold. See footnote 6 below for additional information on how CAP is calculated.
(3)
The calculation of TSR is based on the value of an initial fixed investment of $100 from the beginning of 2021 through the end of 2025 in the table, assuming reinvestment of dividends. The peer group TSR is represented by the S&P 500 Utilities Index.
(4)
As a result of the company’s accounting restatement, the amounts set forth for Net Income in 2023 and 2024 have been revised. For additional information, see the Recovery of Incentive Compensation section of the CD&A.
(5)
See Reconciliation of Reported Earnings (GAAP) to Operating Earnings (non-GAAP) in Appendix A.
(6)
SEC rules require certain adjustments be made to the Summary Compensation Table totals to determine CAP as reported in the Pay vs. Performance Table. The following table details these adjustments:


Year


Executives


Summary
Compensation
Table Total ($)


Deduct
Change
in Pension
Value ($)


Deduct Stock
Awards ($)


Add Pension
Valuation
Adjustment
(a) ($)


Add Equity
Award
Adjustment
(b) ($)


CAP ($)


2025


CEO


16,037,850


818,742


9,309,830


265,986


10,474,966


16,650,230


Other NEOs


4,011,901


261,296


1,937,951


63,541


2,316,552


4,192,747


(a)
SEC rules require certain adjustments be made to pension compensation totals to determine CAP. The following table details these adjustments:


Year


Executives


Pension Service
Cost Adjustment ($)


Prior Service Cost
Adjustment ($)


Pension Valuation
Adjustment ($)


2025


CEO


265,986


0


265,986


Other NEOs


63,541


0


63,541


(b)
SEC rules require certain adjustments be made to equity award totals to determine CAP. The following table details these adjustments:


Unvested Awards


Vested Awards


Year


Executives


Year End Fair
Value of Equity
Awards Granted
During Year and
Outstanding
and Unvested
at Year End ($)


Year over Year
Change in
Fair Value of
Outstanding
and Unvested
Equity Awards
at Year End
($)


Fair Value as
of Vesting
Date of Equity
Awards
Granted and
Vested During
Year ($)


Change as of
Vesting Date
from Prior Year
End of Prior
Awards that
Vested During
Year ($)


Deduct
Forfeited
Awards (Fair
Value at End
of Prior Year)
($)


Value of
Dividends
and Earnings
Paid ($)


Equity
Award
Adjustment
($)


2025


CEO


10,290,665


714,716


0


(530,415

)


0


0


10,474,966


Other NEOs


2,086,549


150,269


0


(20,310

)


0


100,044


2,316,552


Company Selected Measure Name OperatingEarnings PerShare        
Named Executive Officers, Footnote For 2025, our non-CEO NEOs were Messrs Ridge, Brown, Baine and Carr. For 2024, our non-CEO NEOs were Messrs. Ridge, Brown and Baine and Ms. Diane Leopold. For 2023, our non-CEO NEOs were Messrs. Ridge, Brown, Baine, Mr. Daniel G. Stoddard and Ms. Leopold. For 2022, our non-CEO NEOs were Messrs. Ridge, Stoddard, Brown, Mr. James R. Chapman and Ms. Leopold. For 2021, our non-CEO NEOs were Messrs. Chapman, Stoddard, Brown, Mr. Thomas F. Farrell, II and Ms. Leopold.
Peer Group Issuers, Footnote The calculation of TSR is based on the value of an initial fixed investment of $100 from the beginning of 2021 through the end of 2025 in the table, assuming reinvestment of dividends. The peer group TSR is represented by the S&P 500 Utilities Index.        
Adjustment To PEO Compensation, Footnote
(6)
SEC rules require certain adjustments be made to the Summary Compensation Table totals to determine CAP as reported in the Pay vs. Performance Table. The following table details these adjustments:


Year


Executives


Summary
Compensation
Table Total ($)


Deduct
Change
in Pension
Value ($)


Deduct Stock
Awards ($)


Add Pension
Valuation
Adjustment
(a) ($)


Add Equity
Award
Adjustment
(b) ($)


CAP ($)


2025


CEO


16,037,850


818,742


9,309,830


265,986


10,474,966


16,650,230


Other NEOs


4,011,901


261,296


1,937,951


63,541


2,316,552


4,192,747


(a)
SEC rules require certain adjustments be made to pension compensation totals to determine CAP. The following table details these adjustments:


Year


Executives


Pension Service
Cost Adjustment ($)


Prior Service Cost
Adjustment ($)


Pension Valuation
Adjustment ($)


2025


CEO


265,986


0


265,986


Other NEOs


63,541


0


63,541


(b)
SEC rules require certain adjustments be made to equity award totals to determine CAP. The following table details these adjustments:


Unvested Awards


Vested Awards


Year


Executives


Year End Fair
Value of Equity
Awards Granted
During Year and
Outstanding
and Unvested
at Year End ($)


Year over Year
Change in
Fair Value of
Outstanding
and Unvested
Equity Awards
at Year End
($)


Fair Value as
of Vesting
Date of Equity
Awards
Granted and
Vested During
Year ($)


Change as of
Vesting Date
from Prior Year
End of Prior
Awards that
Vested During
Year ($)


Deduct
Forfeited
Awards (Fair
Value at End
of Prior Year)
($)


Value of
Dividends
and Earnings
Paid ($)


Equity
Award
Adjustment
($)


2025


CEO


10,290,665


714,716


0


(530,415

)


0


0


10,474,966


Other NEOs


2,086,549


150,269


0


(20,310

)


0


100,044


2,316,552


Non-PEO NEO Average Total Compensation Amount $ 4,011,901 $ 3,578,383 $ 2,525,850 $ 2,042,074 $ 5,002,308
Non-PEO NEO Average Compensation Actually Paid Amount $ 4,192,747 3,743,524 1,690,381 1,260,497 4,186,674
Equity Valuation Assumption Difference, Footnote
(b)
SEC rules require certain adjustments be made to equity award totals to determine CAP. The following table details these adjustments:


Unvested Awards


Vested Awards


Year


Executives


Year End Fair
Value of Equity
Awards Granted
During Year and
Outstanding
and Unvested
at Year End ($)


Year over Year
Change in
Fair Value of
Outstanding
and Unvested
Equity Awards
at Year End
($)


Fair Value as
of Vesting
Date of Equity
Awards
Granted and
Vested During
Year ($)


Change as of
Vesting Date
from Prior Year
End of Prior
Awards that
Vested During
Year ($)


Deduct
Forfeited
Awards (Fair
Value at End
of Prior Year)
($)


Value of
Dividends
and Earnings
Paid ($)


Equity
Award
Adjustment
($)


2025


CEO


10,290,665


714,716


0


(530,415

)


0


0


10,474,966


Other NEOs


2,086,549


150,269


0


(20,310

)


0


100,044


2,316,552


Compensation Actually Paid vs. Total Shareholder Return

CAP vs. TSR


img183738793_200.jpg

       
Compensation Actually Paid vs. Net Income

CAP vs. Net Income


img183738793_201.jpg

       
Compensation Actually Paid vs. Company Selected Measure

CAP vs. Operating Earnings Per Share


img183738793_202.jpg

       
Total Shareholder Return Vs Peer Group

CAP vs. TSR


img183738793_200.jpg

       
Tabular List, Table

Most Important Performance Measures Table

The three items listed below represent the most important performance measures we used to link compensation actually paid to our NEOs for 2025 to company performance, as further described in the Annual Incentive Plan and the Long-Term Incentive Program sections of our CD&A.


Operating Earnings Per Share

Relative Total Shareholder Return

3-Year Cumulative
Operating Earnings Per Share


Total Shareholder Return Amount $ 97 85 71 87 108
Peer Group Total Shareholder Return Amount 159 137 111 120 118
Net Income (Loss) $ 2,998,000,000 $ 2,034,000,000 $ 1,962,000,000 $ 1,191,000,000 $ 3,399,000,000
Company Selected Measure Amount 3.42 2.77 1.95 3.16 2.89
PEO Name Mr. Blue Mr. Blue Mr. Blue Mr. Blue Mr. Blue
Measure:: 1          
Pay vs Performance Disclosure          
Name Operating Earnings Per Share        
Measure:: 2          
Pay vs Performance Disclosure          
Name Relative Total Shareholder Return        
Measure:: 3          
Pay vs Performance Disclosure          
Name 3-Year Cumulative Operating Earnings Per Share        
Mr. Blue [Member]          
Pay vs Performance Disclosure          
PEO Total Compensation Amount $ 16,037,850 $ 12,904,625 $ 6,278,835 $ 6,794,985 $ 8,161,083
PEO Actually Paid Compensation Amount 16,650,230 $ 13,741,422 $ 2,851,310 $ 5,095,318 $ 7,796,007
PEO | Equity Awards Adjustments, Excluding Value Reported in Compensation Table          
Pay vs Performance Disclosure          
Adjustment to Compensation, Amount 10,474,966        
PEO | Year-end Fair Value of Equity Awards Granted in Covered Year that are Outstanding and Unvested          
Pay vs Performance Disclosure          
Adjustment to Compensation, Amount 10,290,665        
PEO | Year-over-Year Change in Fair Value of Equity Awards Granted in Prior Years That are Outstanding and Unvested          
Pay vs Performance Disclosure          
Adjustment to Compensation, Amount 714,716        
PEO | Vesting Date Fair Value of Equity Awards Granted and Vested in Covered Year          
Pay vs Performance Disclosure          
Adjustment to Compensation, Amount 0        
PEO | Change in Fair Value as of Vesting Date of Prior Year Equity Awards Vested in Covered Year          
Pay vs Performance Disclosure          
Adjustment to Compensation, Amount (530,415)        
PEO | Prior Year End Fair Value of Equity Awards Granted in Any Prior Year that Fail to Meet Applicable Vesting Conditions During Covered Year          
Pay vs Performance Disclosure          
Adjustment to Compensation, Amount 0        
PEO | Dividends or Other Earnings Paid on Equity Awards not Otherwise Reflected in Total Compensation for Covered Year          
Pay vs Performance Disclosure          
Adjustment to Compensation, Amount 0        
PEO | Mr. Blue [Member] | Aggregate Change in Present Value of Accumulated Benefit for All Pension Plans Reported in Summary Compensation Table          
Pay vs Performance Disclosure          
Adjustment to Compensation, Amount (818,742)        
PEO | Mr. Blue [Member] | Aggregate Pension Adjustments Service Cost          
Pay vs Performance Disclosure          
Adjustment to Compensation, Amount 265,986        
PEO | Mr. Blue [Member] | Pension Adjustments Service Cost          
Pay vs Performance Disclosure          
Adjustment to Compensation, Amount 265,986        
PEO | Mr. Blue [Member] | Pension Adjustments Prior Service Cost          
Pay vs Performance Disclosure          
Adjustment to Compensation, Amount 0        
PEO | Mr. Blue [Member] | Aggregate Grant Date Fair Value of Equity Award Amounts Reported in Summary Compensation Table          
Pay vs Performance Disclosure          
Adjustment to Compensation, Amount (9,309,830)        
PEO | Mr. Blue [Member] | Equity Awards Adjustments, Excluding Value Reported in Compensation Table          
Pay vs Performance Disclosure          
Adjustment to Compensation, Amount 10,474,966        
Non-PEO NEO | Aggregate Change in Present Value of Accumulated Benefit for All Pension Plans Reported in Summary Compensation Table          
Pay vs Performance Disclosure          
Adjustment to Compensation, Amount (261,296)        
Non-PEO NEO | Aggregate Pension Adjustments Service Cost          
Pay vs Performance Disclosure          
Adjustment to Compensation, Amount 63,541        
Non-PEO NEO | Pension Adjustments Service Cost          
Pay vs Performance Disclosure          
Adjustment to Compensation, Amount 63,541        
Non-PEO NEO | Pension Adjustments Prior Service Cost          
Pay vs Performance Disclosure          
Adjustment to Compensation, Amount 0        
Non-PEO NEO | Aggregate Grant Date Fair Value of Equity Award Amounts Reported in Summary Compensation Table          
Pay vs Performance Disclosure          
Adjustment to Compensation, Amount (1,937,951)        
Non-PEO NEO | Equity Awards Adjustments, Excluding Value Reported in Compensation Table          
Pay vs Performance Disclosure          
Adjustment to Compensation, Amount 2,316,552        
Non-PEO NEO | Year-end Fair Value of Equity Awards Granted in Covered Year that are Outstanding and Unvested          
Pay vs Performance Disclosure          
Adjustment to Compensation, Amount 2,086,549        
Non-PEO NEO | Year-over-Year Change in Fair Value of Equity Awards Granted in Prior Years That are Outstanding and Unvested          
Pay vs Performance Disclosure          
Adjustment to Compensation, Amount 150,269        
Non-PEO NEO | Vesting Date Fair Value of Equity Awards Granted and Vested in Covered Year          
Pay vs Performance Disclosure          
Adjustment to Compensation, Amount 0        
Non-PEO NEO | Change in Fair Value as of Vesting Date of Prior Year Equity Awards Vested in Covered Year          
Pay vs Performance Disclosure          
Adjustment to Compensation, Amount (20,310)        
Non-PEO NEO | Prior Year End Fair Value of Equity Awards Granted in Any Prior Year that Fail to Meet Applicable Vesting Conditions During Covered Year          
Pay vs Performance Disclosure          
Adjustment to Compensation, Amount 0        
Non-PEO NEO | Dividends or Other Earnings Paid on Equity Awards not Otherwise Reflected in Total Compensation for Covered Year          
Pay vs Performance Disclosure          
Adjustment to Compensation, Amount $ 100,044