Pay vs.
Performance
| Value of Initial Fixed $100 Investment Based on: | ||||||||
Year |
Summary Compensation Table Total for PEO ($) | Compensation Actually Paid to PEO(1) ($) |
Compensation Table Total for Non-PEO NEOs ($) |
Actually Paid to Non-PEO NEOs(2) |
Total Shareholder Return (“TSR”) ($) | Peer Group Total Shareholder Return(3) ($) | Net Income (Loss) ($) in 000s |
Core FFO(4) per Share ($) |
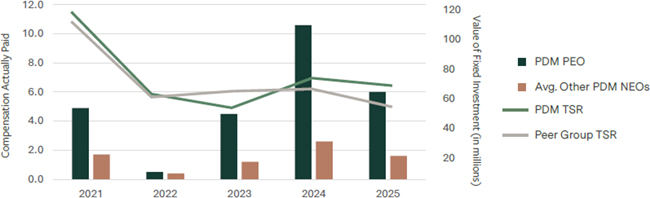
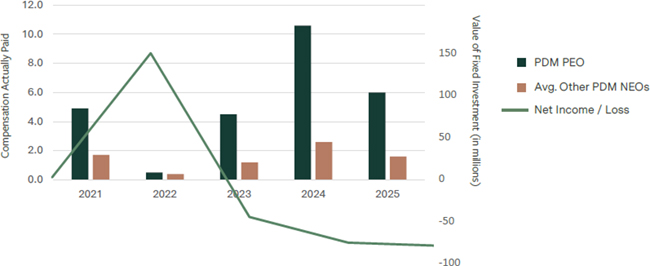
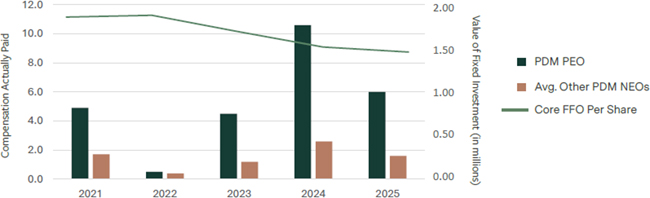
| 2025 | 5,757,342 | 6,002,426 | 1,545,195 | 1,642,846 | 68.56 | 54.52 | (83,620) | 1.41 |
| 2024 | 5,698,958 | 10,643,820 | 1,692,067 | 2,561,983 | 73.91 | 66.63 | (79,069) | 1.49 |
| 2023 | 7,150,720 | 4,506,668 | 1,712,760 | 1,199,819 | 53.88 | 65.05 | (48,377) | 1.74 |
| 2022 | 4,026,288 | 495,657 | 1,309,186 | 412,585 | 63.16 | 61.11 | 146,830 | 2.00 |
| 2021 | 3,560,678 | 4,888,145 | 1,411,844 | 1,731,390 | 118.62 | 112.11 | (1,167) | 1.97 |
| (1) | Compensation actually paid” to our Principal Executive Officer (PEO) in each of the years included in the table above was calculated as set forth in the table below, as determined in accordance with SEC rules. For awards with dividend rights, these amounts are paid in cash once the underlying award vests, and are incorporated as applicable in the table below. The dollar amounts reflected in the table above do not reflect the actual amount of compensation earned by or paid to our PEO during the applicable year. For information regarding the decisions made by our Compensation Committee with regard to the PEO’s compensation for each fiscal year, please see the Compensation Discussion & Analysis section of the proxy statements reporting pay for the fiscal years covered in the table above. |
| (2) | Average “Compensation actually paid” to our non-PEO NEOs in each of year included in the table above was calculated as set forth in the table below, as determined in accordance with SEC rules. For awards with dividend rights, these amounts are paid in cash once the underlying award vests, and are incorporated as applicable in the table below. The dollar amounts reflected in the table above do not reflect the actual amount of compensation earned by or paid to our non-PEO NEOs during the applicable year. For information regarding the decisions made by our Compensation Committee with regard to our non-PEO’s compensation for each fiscal year, please see the Compensation Discussion & Analysis section of the proxy statements reporting pay for the fiscal years covered in the table above. |
| (3) | The Peer Groups utilized for this analysis are the same Peer Groups used for our Performance Share Programs as further described above under Long-Term Incentive Compensation Plan — Performance Share Program. Peer Group Total Shareholder Return for 2025, 2024, 2023 and 2022 assuming the 2021 Peer Group had been used would have been $51.87, $60.90, $64.45 and $63.30, respectively. |
| (4) | See the definition of Core FFO and the reconciliation of GAAP net income applicable to common stock to Core FFO for the year ended December 31, 2025 in Appendix B. |
| 2021 | 2022 | 2023 | 2024 | 2025 | |
| PEO (C. Brent Smith for all periods) | |||||
| Summary Compensation Table Total Compensation | 3,560,678 | 4,026,288 | 7,150,720 | 5,698,958 | 5,757,342 |
| Less: Stock and Option Award Values Reported in Summary Compensation | (2,040,930) | (2,478,040) | (5,377,973) | (3,739,478) | (3,766,342) |
| Plus: Fair Value for Stock and Option Awards Granted in the Covered Year and Unvested at Year End | 1,983,364 |
1,107,509 |
3,157,586 |
6,581,983 |
4,267,560 |
| Plus: Fair Value for Stock and Option Awards Granted in the Covered Year That Vested in the Covered Year | 200,003 |
262,506 |
397,503 |
|
|
| Change in Fair Value of Outstanding Unvested Stock and Option Awards from Prior Years | 1,093,881 |
(2,257,626) |
(674,307) |
2,167,159 |
(540,556) |
| Change in Fair Value of Outstanding Vested Stock and Option Awards from Prior Years | 91,149 | (164,980) | (146,861) | (64,802) | 284,422 |
| Compensation Actually Paid | 4,888,145 | 495,657 | 4,506,668 | 10,643,820 | 6,002,426 |
| 2021 | 2022 | 2023 | 2024 | 2025 | |
| Non-PEO NEOs* | |||||
| Summary Compensation Table Total Compensation | 1,411,844 | 1,309,186 | 1,712,760 | 1,692,067 | 1,545,195 |
| Less: Stock and Option Award Values Reported in Summary Compensation | (616,240) | (551,037) | (917,860) | (511,159) | (664,648) |
| Plus: Fair Value for Stock and Option Awards Granted in the Covered Year and Unvested at Year End | 592,009 |
246,142 |
538,479 |
592,564 |
753,098 |
| Plus: Fair Value for Stock and Option Awards Granted in the Covered Year That Vested in the Covered Year | 68,321 |
71,882 |
70,036 |
151,748 |
|
| Change in Fair Value of Outstanding Unvested Stock and Option Awards from Prior Years | 211,000 |
(637,083) |
(176,112) |
546,076 |
(115,138) |
| Change in Fair Value of Outstanding Vested Stock and Option Awards from Prior Years | 64,456 | (26,505) | (27,484) | 90,687 | 124,339 |
| Compensation Actually Paid | 1,731,390 | 412,585 | 1,199,819 | 2,561,983 | 1,642,846 |
| * | For the years ended December 31, 2021 - 2023, the Non-PEO NEOs included Robert E. Bowers, Christopher A. Kollme, George M. Wells, and Robert K. Wiberg. The year ended December 31, 2024 also includes Sherry L. Rexroad. The year ended December 31, 2025 includes Christopher A. Kollme, Laura P. Moon, Sherry L. Rexroad, and George M Wells. |
Equity Valuations: Deferred Stock Unit Award grant date fair values were calculated based on the closing price as of the grant date; Deferred Stock Unit Award vesting date fair values were calculated based on the closing stock price as of the vest date and adjusting for any accrued dividend rights; Performance Share Program Award grant date fair values and fair values as of each respective period end were determined utilizing a Monte Carlo valuation model that models the plan’s potential payoff depending on our and our peer’s group’s future stock price movements; fair values of Performance Share Program Awards as of each vesting date were determined based on our closing stock price as of the vesting date adjusted for any accrued dividends.
| (1) | Compensation actually paid” to our Principal Executive Officer (PEO) in each of the years included in the table above was calculated as set forth in the table below, as determined in accordance with SEC rules. For awards with dividend rights, these amounts are paid in cash once the underlying award vests, and are incorporated as applicable in the table below. The dollar amounts reflected in the table above do not reflect the actual amount of compensation earned by or paid to our PEO during the applicable year. For information regarding the decisions made by our Compensation Committee with regard to the PEO’s compensation for each fiscal year, please see the Compensation Discussion & Analysis section of the proxy statements reporting pay for the fiscal years covered in the table above. |
| 2021 | 2022 | 2023 | 2024 | 2025 | |
| PEO (C. Brent Smith for all periods) | |||||
| Summary Compensation Table Total Compensation | 3,560,678 | 4,026,288 | 7,150,720 | 5,698,958 | 5,757,342 |
| Less: Stock and Option Award Values Reported in Summary Compensation | (2,040,930) | (2,478,040) | (5,377,973) | (3,739,478) | (3,766,342) |
| Plus: Fair Value for Stock and Option Awards Granted in the Covered Year and Unvested at Year End | 1,983,364 |
1,107,509 |
3,157,586 |
6,581,983 |
4,267,560 |
| Plus: Fair Value for Stock and Option Awards Granted in the Covered Year That Vested in the Covered Year | 200,003 |
262,506 |
397,503 |
|
|
| Change in Fair Value of Outstanding Unvested Stock and Option Awards from Prior Years | 1,093,881 |
(2,257,626) |
(674,307) |
2,167,159 |
(540,556) |
| Change in Fair Value of Outstanding Vested Stock and Option Awards from Prior Years | 91,149 | (164,980) | (146,861) | (64,802) | 284,422 |
| Compensation Actually Paid | 4,888,145 | 495,657 | 4,506,668 | 10,643,820 | 6,002,426 |
| (2) | Average “Compensation actually paid” to our non-PEO NEOs in each of year included in the table above was calculated as set forth in the table below, as determined in accordance with SEC rules. For awards with dividend rights, these amounts are paid in cash once the underlying award vests, and are incorporated as applicable in the table below. The dollar amounts reflected in the table above do not reflect the actual amount of compensation earned by or paid to our non-PEO NEOs during the applicable year. For information regarding the decisions made by our Compensation Committee with regard to our non-PEO’s compensation for each fiscal year, please see the Compensation Discussion & Analysis section of the proxy statements reporting pay for the fiscal years covered in the table above. |
| 2021 | 2022 | 2023 | 2024 | 2025 | |
| Non-PEO NEOs* | |||||
| Summary Compensation Table Total Compensation | 1,411,844 | 1,309,186 | 1,712,760 | 1,692,067 | 1,545,195 |
| Less: Stock and Option Award Values Reported in Summary Compensation | (616,240) | (551,037) | (917,860) | (511,159) | (664,648) |
| Plus: Fair Value for Stock and Option Awards Granted in the Covered Year and Unvested at Year End | 592,009 |
246,142 |
538,479 |
592,564 |
753,098 |
| Plus: Fair Value for Stock and Option Awards Granted in the Covered Year That Vested in the Covered Year | 68,321 |
71,882 |
70,036 |
151,748 |
|
| Change in Fair Value of Outstanding Unvested Stock and Option Awards from Prior Years | 211,000 |
(637,083) |
(176,112) |
546,076 |
(115,138) |
| Change in Fair Value of Outstanding Vested Stock and Option Awards from Prior Years | 64,456 | (26,505) | (27,484) | 90,687 | 124,339 |
| Compensation Actually Paid | 1,731,390 | 412,585 | 1,199,819 | 2,561,983 | 1,642,846 |
| * | For the years ended December 31, 2021 - 2023, the Non-PEO NEOs included Robert E. Bowers, Christopher A. Kollme, George M. Wells, and Robert K. Wiberg. The year ended December 31, 2024 also includes Sherry L. Rexroad. The year ended December 31, 2025 includes Christopher A. Kollme, Laura P. Moon, Sherry L. Rexroad, and George M Wells. |
Compensation Actually Paid vs. Net Income / Loss
Compensation Actually Paid vs. Core FFO Per Share
For 2025, the most important financial performance measures that we used to link our NEO’s compensation, including our CEO’s, to our financial performance were as follows:
| • | Our 3-year TSR relative to the 3-year TSR of our defined peer group; |
| • | Core FFO per share relative to budget; |
| • | Leasing volume, with an emphasis on new tenant leasing; |
| • | Net debt to Core EBITDA ratio relative to budget; and |
| • | Same Store NOI - Cash basis relative to budget. |
| [1] | Compensation actually paid” to our Principal Executive Officer (PEO) in each of the years included in the table above was calculated as set forth in the table below, as determined in accordance with SEC rules. For awards with dividend rights, these amounts are paid in cash once the underlying award vests, and are incorporated as applicable in the table below. The dollar amounts reflected in the table above do not reflect the actual amount of compensation earned by or paid to our PEO during the applicable year. For information regarding the decisions made by our Compensation Committee with regard to the PEO’s compensation for each fiscal year, please see the Compensation Discussion & Analysis section of the proxy statements reporting pay for the fiscal years covered in the table above. |
| [2] | For the years ended December 31, 2021 - 2023, the Non-PEO NEOs included Robert E. Bowers, Christopher A. Kollme, George M. Wells, and Robert K. Wiberg. The year ended December 31, 2024 also includes Sherry L. Rexroad. The year ended December 31, 2025 includes Christopher A. Kollme, Laura P. Moon, Sherry L. Rexroad, and George M Wells. |
| [3] | Average “Compensation actually paid” to our non-PEO NEOs in each of year included in the table above was calculated as set forth in the table below, as determined in accordance with SEC rules. For awards with dividend rights, these amounts are paid in cash once the underlying award vests, and are incorporated as applicable in the table below. The dollar amounts reflected in the table above do not reflect the actual amount of compensation earned by or paid to our non-PEO NEOs during the applicable year. For information regarding the decisions made by our Compensation Committee with regard to our non-PEO’s compensation for each fiscal year, please see the Compensation Discussion & Analysis section of the proxy statements reporting pay for the fiscal years covered in the table above. |
| [4] | The Peer Groups utilized for this analysis are the same Peer Groups used for our Performance Share Programs as further described above under Long-Term Incentive Compensation Plan — Performance Share Program. Peer Group Total Shareholder Return for 2025, 2024, 2023 and 2022 assuming the 2021 Peer Group had been used would have been $51.87, $60.90, $64.45 and $63.30, respectively. |
| [5] | See the definition of Core FFO and the reconciliation of GAAP net income applicable to common stock to Core FFO for the year ended December 31, 2025 in Appendix B. |