Pay Versus Performance
|
|
|
|
|
|
Average |
Average |
Value of Initial Fixed |
Net |
Adjusted |
|
|
Year |
Summary |
Compensation |
Total |
Peer Group |
||||||
|
(a) |
(b) |
(c) |
(d) |
(e) |
(f) |
(g) |
(h) |
(i) |
||
|
|
PEO – 1 |
PEO – 2 |
PEO – 1 |
PEO – 2 |
|
|
|
|
|
|
|
2025 |
6,741,212 |
n.a. |
8,798,416 |
n.a. |
1,874,143 |
2,208,203 |
869,193 |
42.89 |
||
|
2024 |
6,938,864 |
n.a. |
6,518,309 |
n.a. |
1,647,649 |
1,724,112 |
863,140 |
41.11 |
||
|
2023 |
8,530,989 |
n.a. |
4,664,662 |
n.a. |
1,438,196 |
309,455 |
788,778 |
38.26 |
||
|
2022 |
6,472,835 |
n.a. |
4,632,617 |
n.a. |
1,534,933 |
1,165,135 |
872,502 |
39.39 |
||
|
2021 |
12,046,903 |
816,467 |
15,803,547 |
17,202,243 |
1,977,815 |
4,311,764 |
768,985 |
33.61 |
||
| (1) | The dollar amounts reported in column (b) are the amounts of total compensation reported for our Principal Executive Officer(s) for each corresponding year in the “Total” column of the Summary Compensation Table. |
| (2) | In 2021, the company had two Principal Executive Officers (PEO). Olivier Filliol (PEO – 2, in the table above) was the PEO until April 1, 2021. Patrick Kaltenbach (PEO – 1, in the table above) is the PEO since April 1, 2021. |
| (3) | The dollar amounts reported in column (c) represent the “Compensation Actually Paid” to the applicable PEO for the corresponding year. Compensation Actually Paid is calculated pursuant to the requirements of Item 402(v) of Regulation S-K, adjusting Summary Compensation Table totals to reflect equity award valuation changes at certain points over time. It does not reflect dollar amounts actually paid to our PEOs. |
The equity award adjustments for 2025 include the addition (or subtraction, as applicable) of the following, as shown in the table below:
|
Year |
Reported |
Reported |
Year End |
Year over Year |
Change in |
Compensation |
|
PEO – 1 |
|
|
|
|
|
|
|
2025 |
6,741,212 |
4,902,841 |
5,518,423 |
634,953 |
806,668 |
8,798,416 |
The grant date fair value of equity awards represents the total of the amounts reported in the “Stock Awards” and “Option Awards” columns in the Summary Compensation Table for the applicable year. The equity award adjustments for each applicable year include the addition (or subtraction, as applicable) of the following: (i) the year-end fair value of any equity awards granted in the applicable year that are outstanding and unvested as of the end of the year; (ii) the amount of change as of the end of the applicable year (from the end of the prior fiscal year) in fair value of any awards granted in prior years that are outstanding and unvested as of the end of the applicable year; and (iii) for awards granted in prior years that vest in the applicable year, the amount equal to the change as of the vesting date (from the end of the prior fiscal year) in fair value. The valuation assumptions used to calculate fair values did not materially differ from those disclosed at the time of grant.
(4)The dollar amounts reported in column (d) represent the average of the amounts reported for the company’s named executive officers (NEOs) as a group (excluding the PEOs) in the “Total” column of the Summary Compensation Table in each applicable year. The non-PEO NEOs were Shawn P. Vadala and Marc de La Guéronnière for all periods shown above. For 2021, Peter Aggersbjerg, the Head of Divisions during those periods, was also an NEO. For 2021 through 2024, Gerry Keller, Head of Process Analytics, was also an NEO. For 2022, 2023, 2024, and 2025 Richard Wong is also an NEO. For 2025, Susan Graham-Bryce, Chief Human Resources Officer, is also an NEO.
(5)The dollar amounts reported in column (e) represent the average amount of “Compensation Actually Paid” to the NEOs as a group (excluding the PEOs) for the corresponding year. Compensation Actually Paid is calculated pursuant to the requirements of Item 402(v) of Regulation S-K, adjusting Summary Compensation table totals to reflect equity award valuation changes at certain points over time. It does not reflect dollar amounts actually paid to our NEOs. The NEOs included for purposes of these calculations are described in footnote 4.
The equity award adjustments for 2025 include the addition (or subtraction, as applicable) of the following, as shown in the table below:
|
Year |
Average |
Average |
Average |
Year over |
Average Change in |
Average |
|
2025 |
1,874,143 |
1,128,213 |
1,260,926 |
36,458 |
164,888 |
2,208,203 |
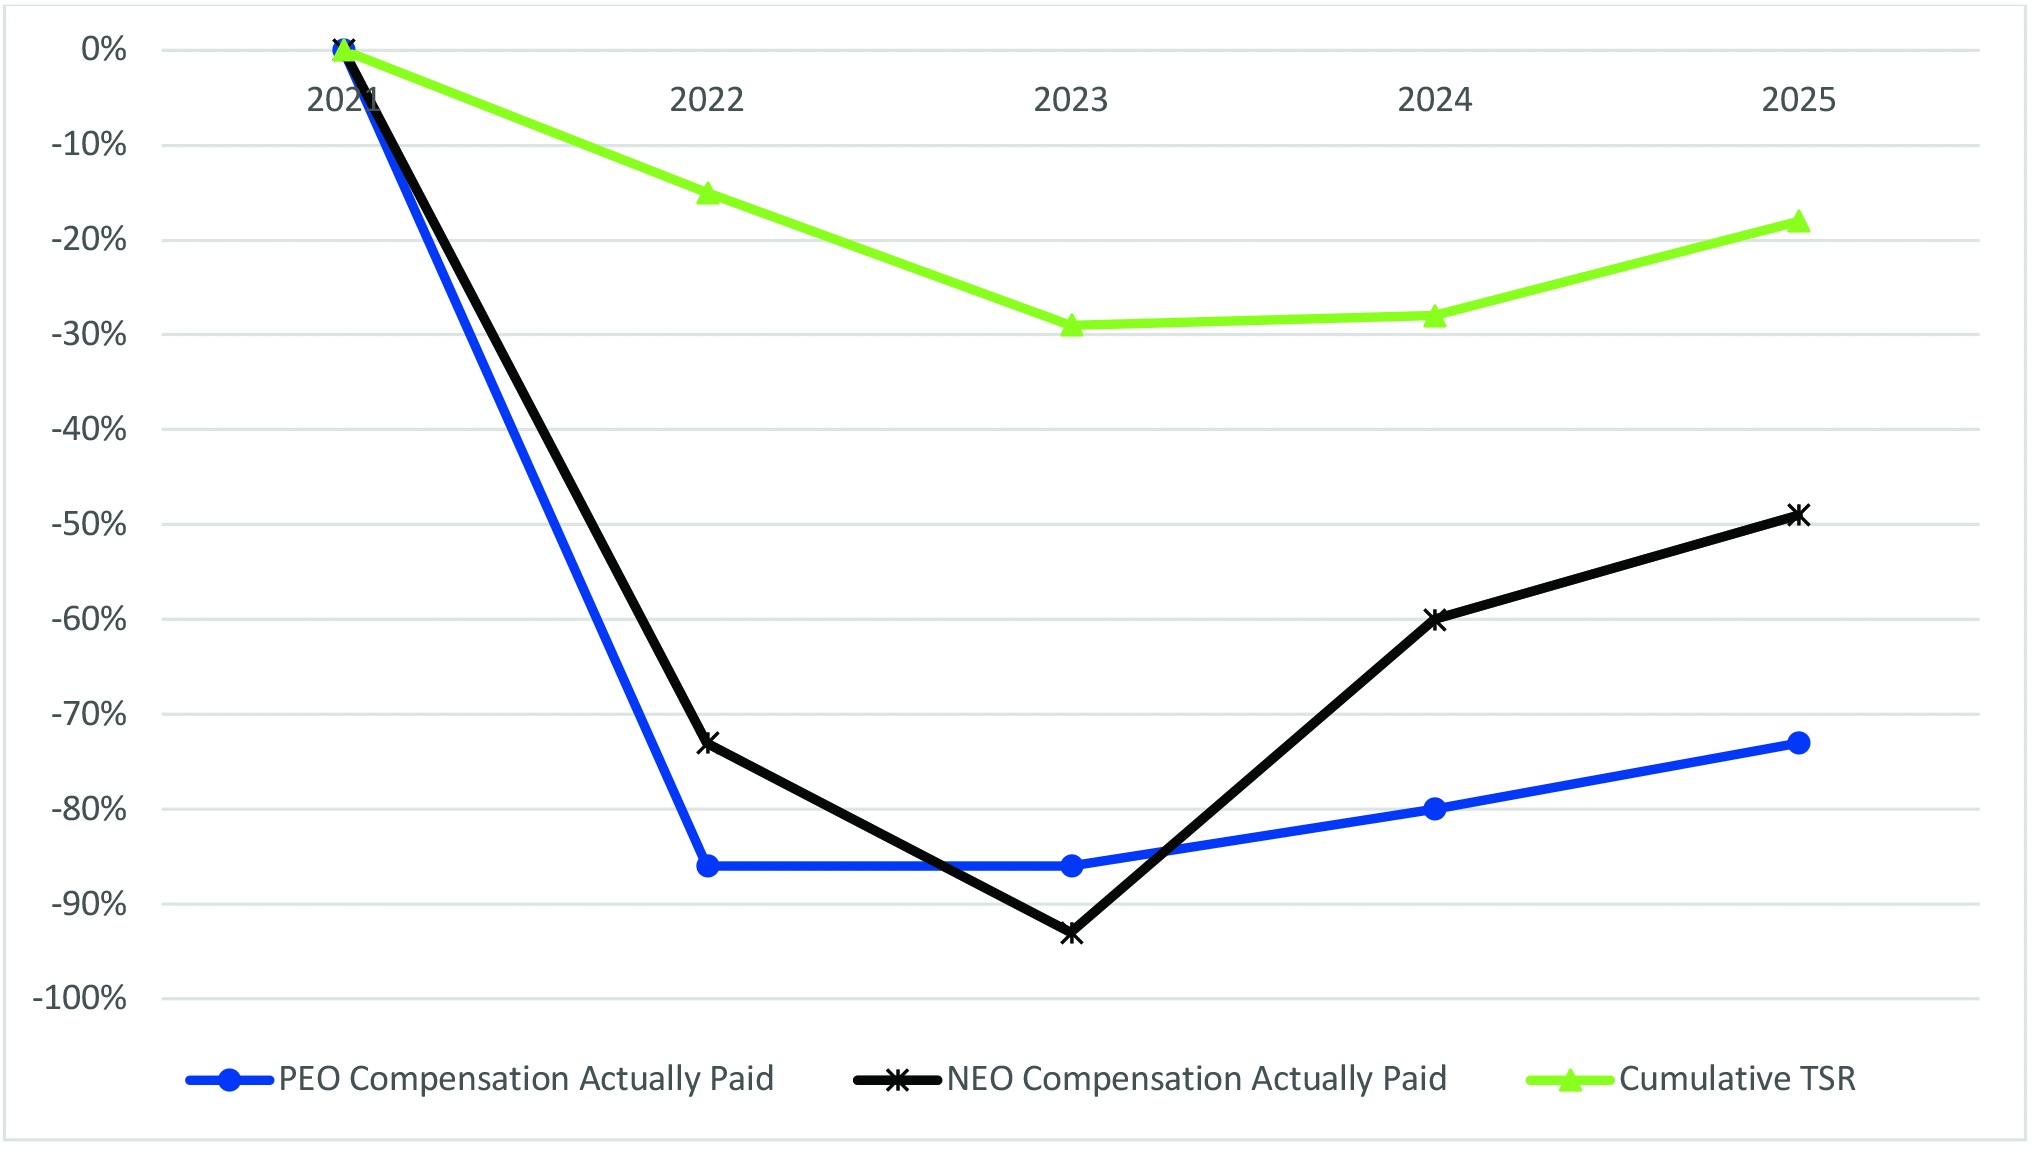
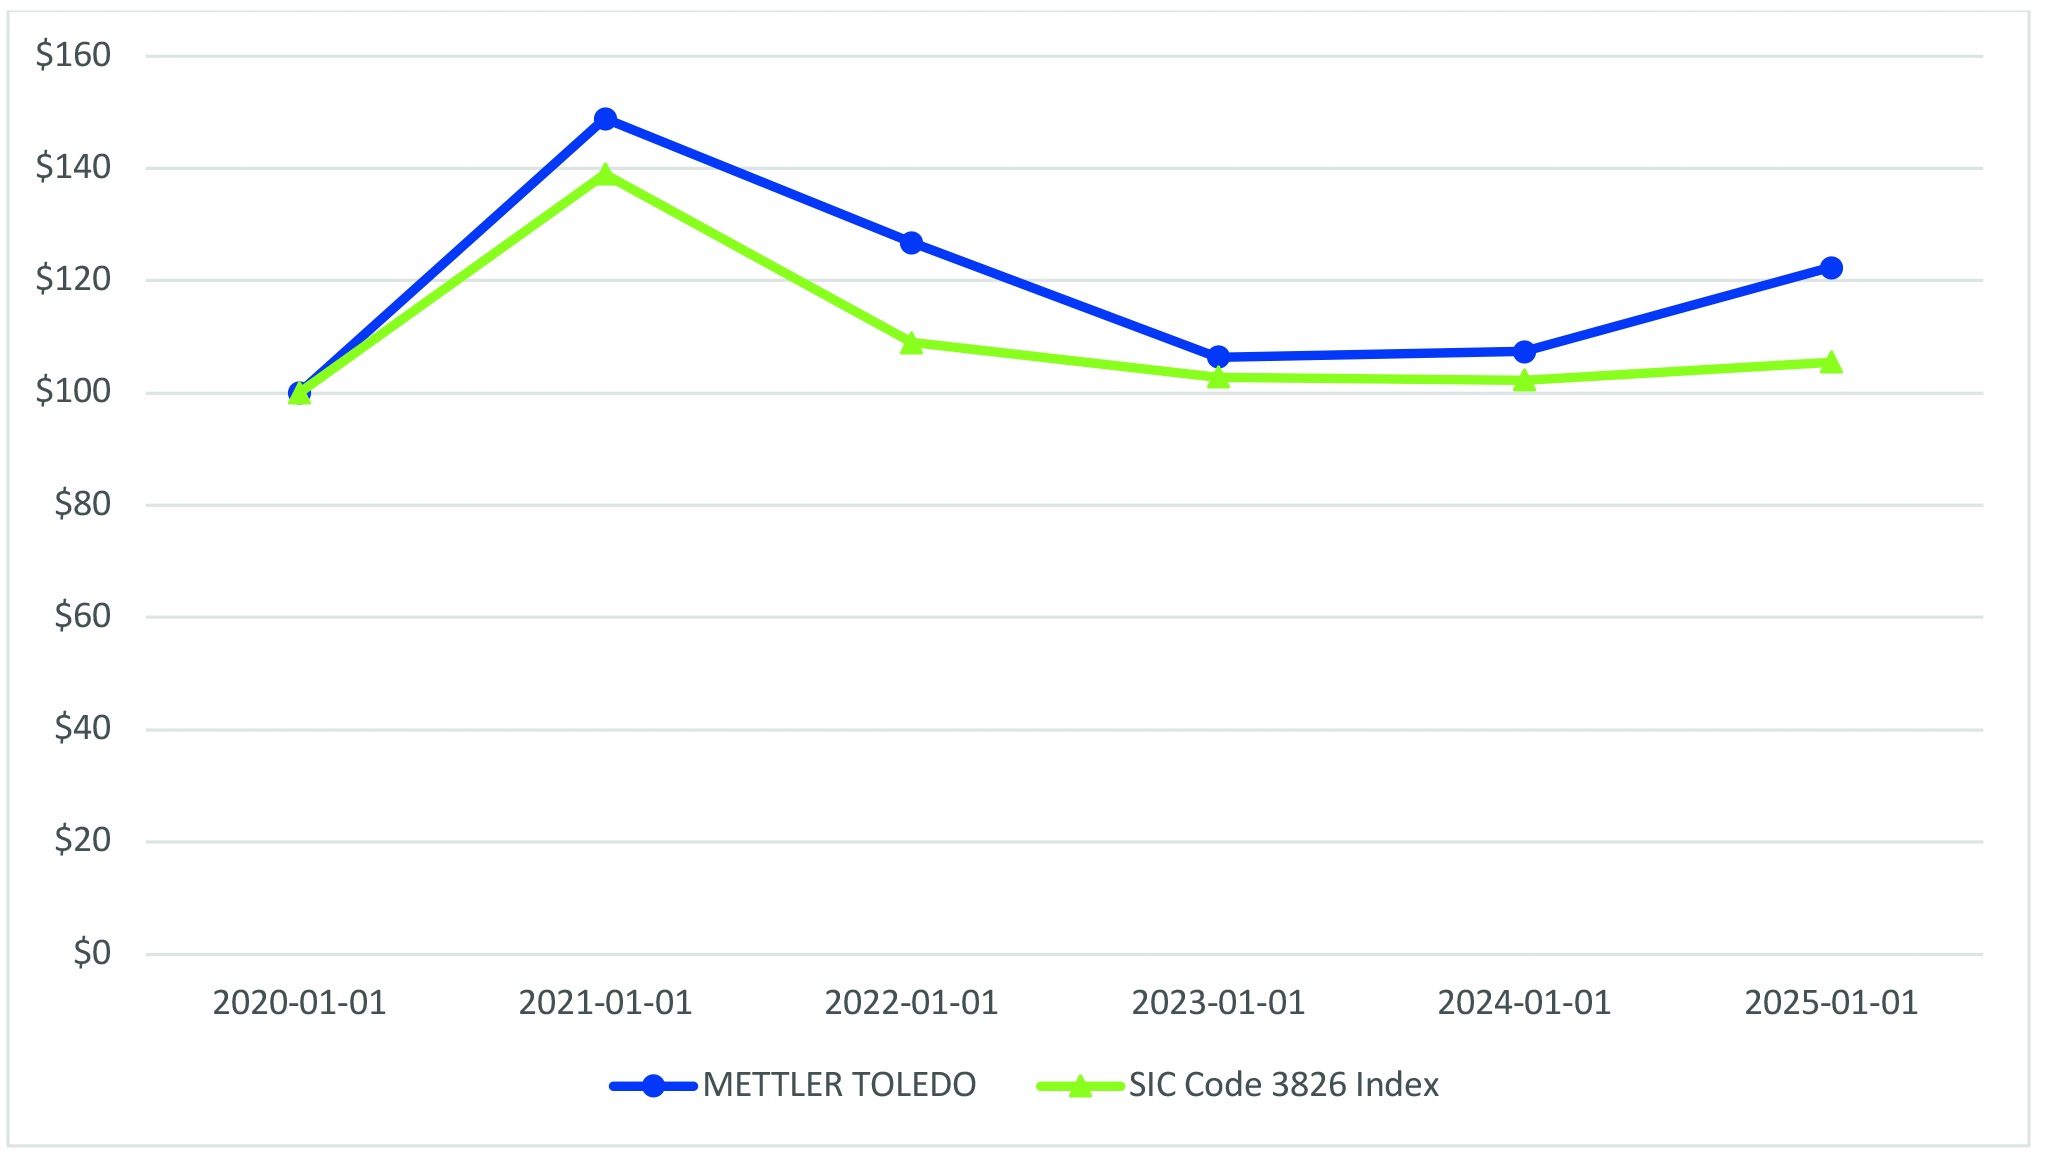
| (6) | Represents the weighted peer group TSR, weighted according to the respective companies’ stock market capitalization at the beginning of each period for which a return is indicated. The peer group used for this purpose is the following published industry index: SIC Code 3826 Index – Laboratory Analytical Instruments. |
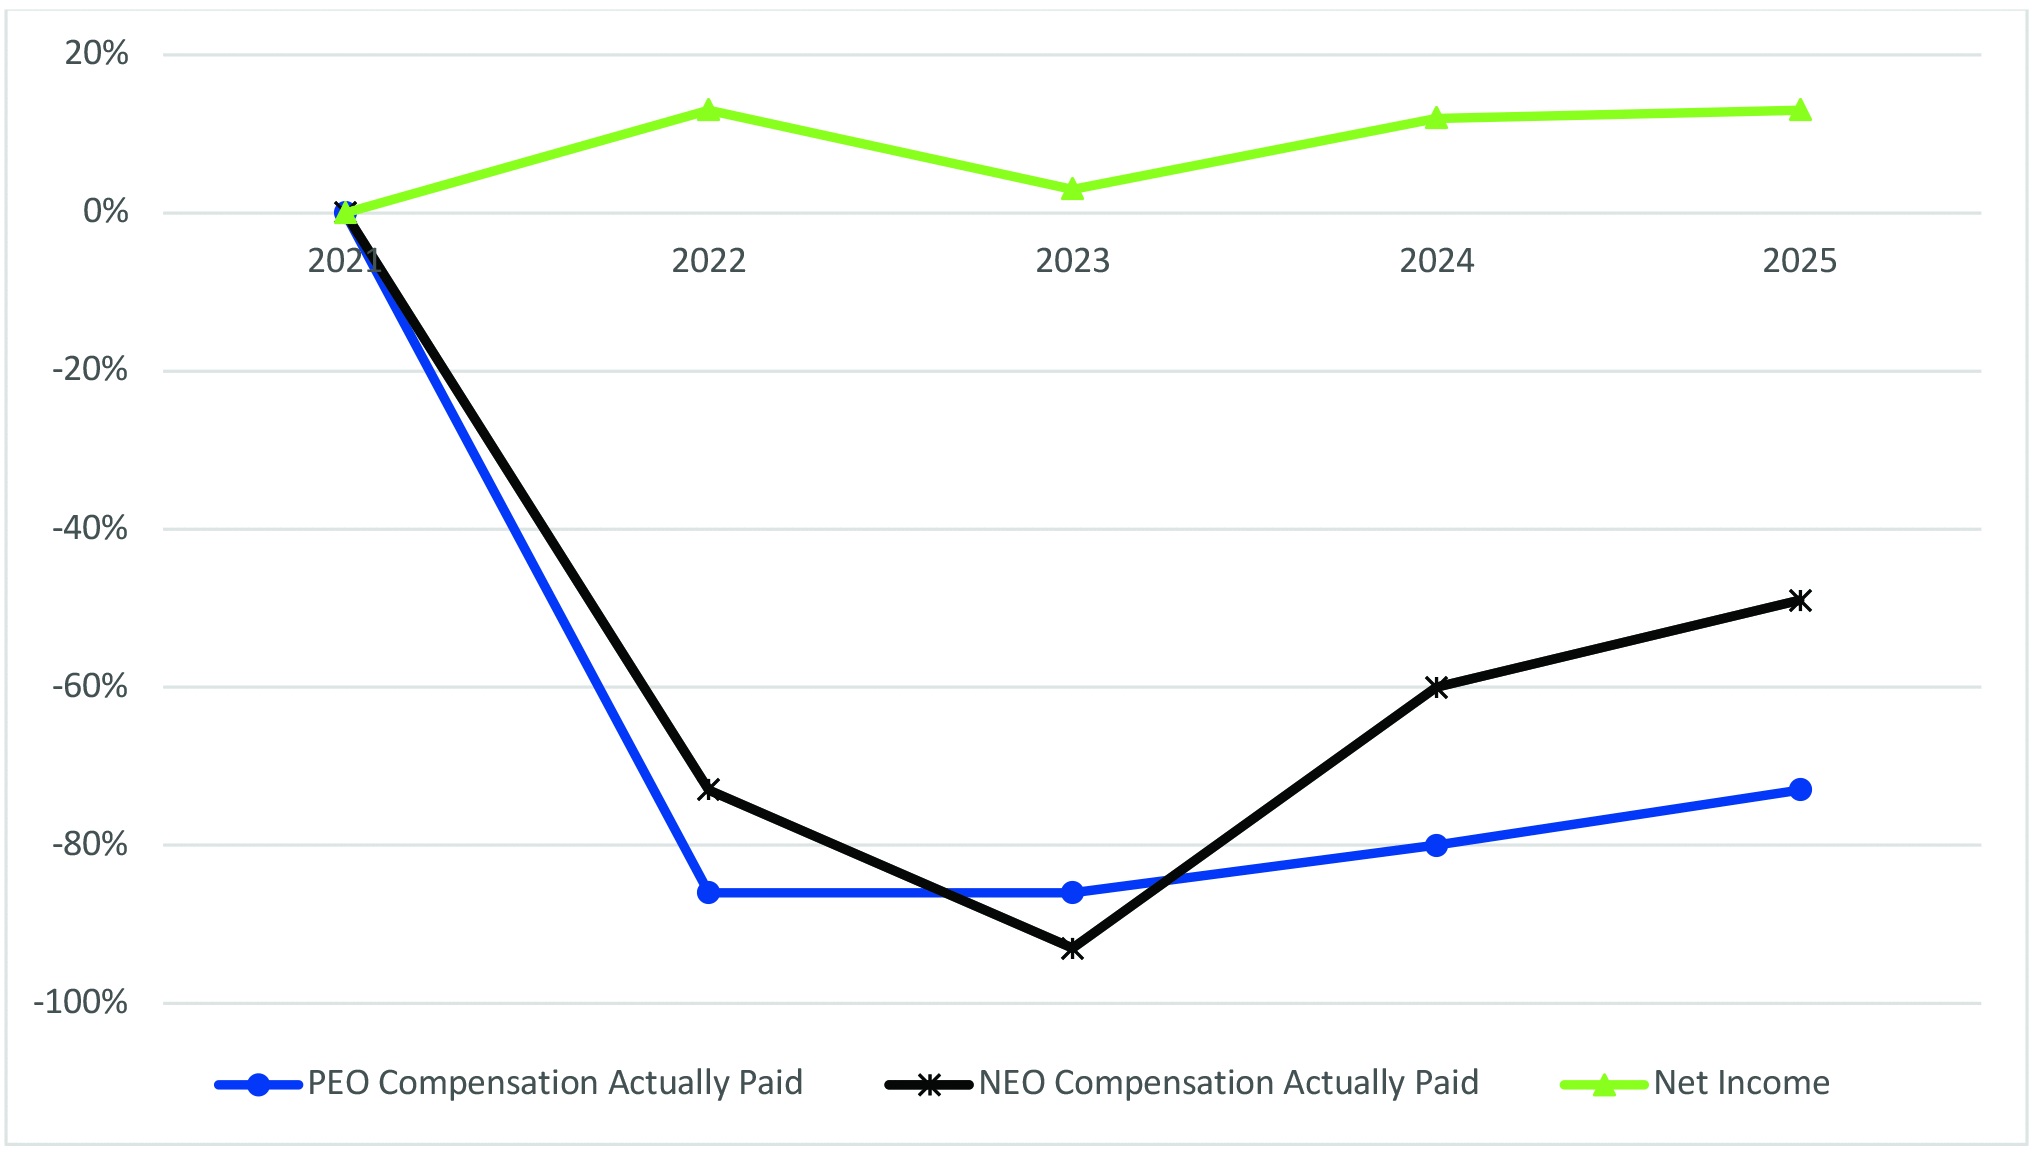
| (7) | The dollar amounts reported represent the amount of net income reflected in the company’s audited financial statements for the applicable year. |
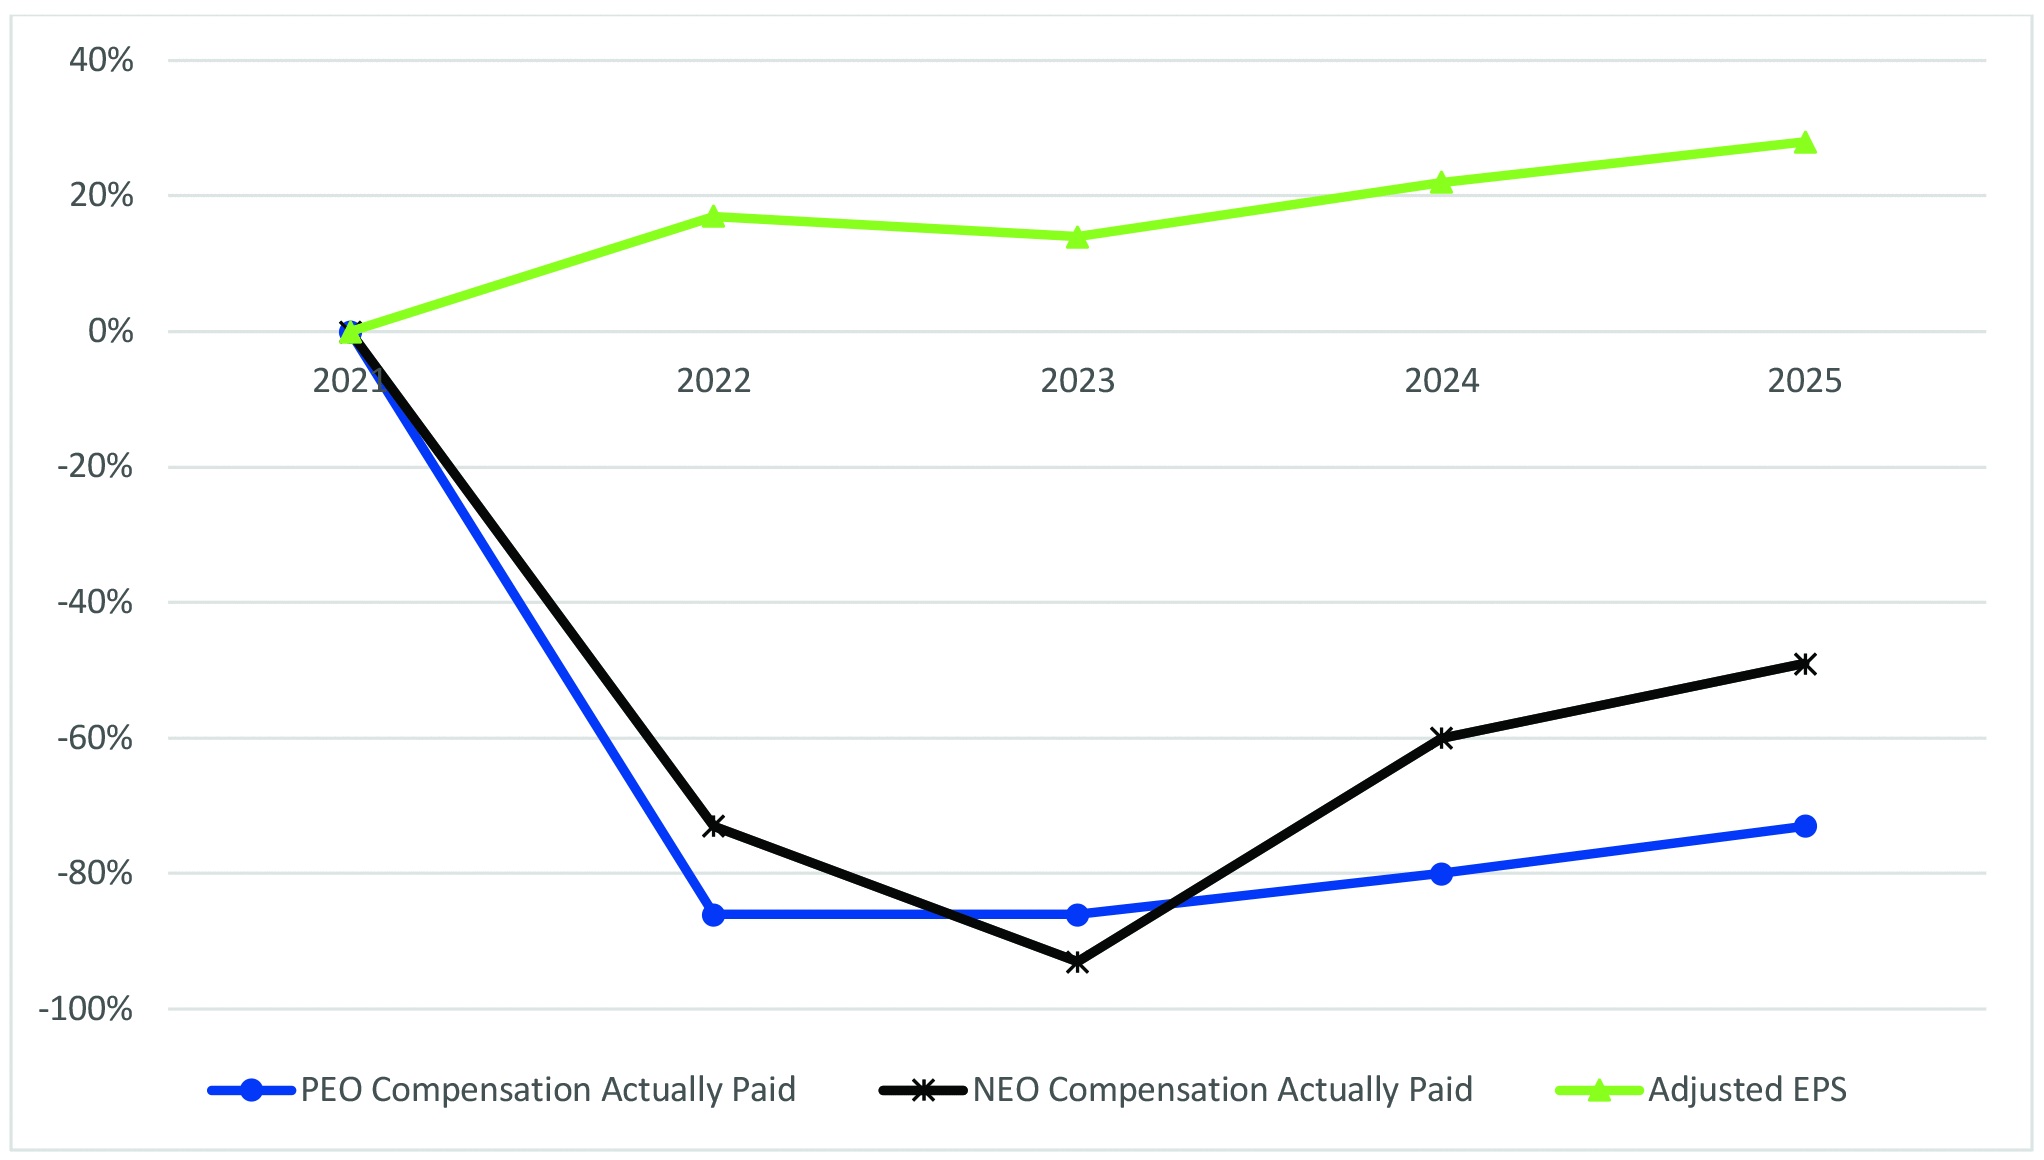
| (8) | While the company uses numerous financial and non-financial performance measures for the purpose of evaluating performance for the company’s compensation programs, the company has determined that non-GAAP earnings per share is the financial performance measure that, in the company’s assessment, represents the most important performance measure (that is not otherwise required to be disclosed in the table) used by the company to link compensation actually paid to the company’s NEOs (including the PEOs), for the most recently completed fiscal year, to company performance. |
Adjusted earnings per share (EPS) is a non-GAAP measure. For 2025, excludes purchased intangible amortization (net of tax) of $21.1 million, restructuring charges (net of tax) of $14.5 million and a net benefit (net of tax) of $3.6 million related to contingent consideration associated with previous acquisitions less acquisition transaction costs (net of tax) of $1.7 million. Also excludes operating results not considered in the target and a $19.5 million non-cash benefit resulting from the reduction of uncertain tax position liabilities and valuation allowance related to the settlement of a tax audit. For 2024, excludes purchased intangible amortization (net of tax) of $20.1 million, restructuring charges (net of tax) of $16.0 million,
and other costs (net of tax) of $0.3 million. Also excludes a $23.0 million one-time non-cash benefit resulting from the reduction of uncertain tax position liabilities related to the settlement of a tax audit. For 2023, excludes purchased intangible amortization (net of tax) of $20.5 million and restructuring charges (net of tax) of $26.5 million. Adjusted EPS also was increased to restate our actual tax rate to our budgeted tax rate before non-recurring items. For 2022, excludes purchased intangible amortization (net of tax) of $19.8 million, acquisition transaction costs (net of tax) of $0.7 million, and restructuring charges (net of tax) of $7.8 million. Adjusted EPS also was reduced in 2022 to restate our actual tax rate to our budgeted tax rate before non-recurring items and exclude operating results not considered in the target. For 2021, excludes purchased intangible amortization (net of tax) of $16.3 million, acquisition charges (net of tax) of $8.2 million pertaining to increased contingent consideration and transaction costs, and restructuring charges (net of tax) of $4.2 million. Adjusted EPS also was reduced in 2021 to restate our actual tax rate to our budgeted tax rate before non-recurring items and exclude operating results not considered in the target.
The equity award adjustments for 2025 include the addition (or subtraction, as applicable) of the following, as shown in the table below:
|
Year |
Reported |
Reported |
Year End |
Year over Year |
Change in |
Compensation |
|
PEO – 1 |
|
|
|
|
|
|
|
2025 |
6,741,212 |
4,902,841 |
5,518,423 |
634,953 |
806,668 |
8,798,416 |
The equity award adjustments for 2025 include the addition (or subtraction, as applicable) of the following, as shown in the table below:
|
Year |
Average |
Average |
Average |
Year over |
Average Change in |
Average |
|
2025 |
1,874,143 |
1,128,213 |
1,260,926 |
36,458 |
164,888 |
2,208,203 |
Compensation Actually Paid and Net Income
Compensation Actually Paid and Adjusted non-GAAP Earnings Per Share
The following chart describes the relationship between our TSR and that of our peer group: the SIC Code 3826 Index – Laboratory Analytical Instruments, assuming an investment of $100.00 on December 31, 2020.
|
Most Important Measures for Determining NEO Pay |
|
Non-GAAP earnings per share |
|
Net cash flow |
|
Group sales at budgeted currency rates |
|
Total shareholder return relative to the S&P 500 Healthcare Index and the S&P 500 Industrials Index |
| [1] | The dollar amounts reported in column (d) represent the average of the amounts reported for the company’s named executive officers (NEOs) as a group (excluding the PEOs) in the “Total” column of the Summary Compensation Table in each applicable year. The non-PEO NEOs were Shawn P. Vadala and Marc de La Guéronnière for all periods shown above. For 2021, Peter Aggersbjerg, the Head of Divisions during those periods, was also an NEO. For 2021 through 2024, Gerry Keller, Head of Process Analytics, was also an NEO. For 2022, 2023, 2024, and 2025 Richard Wong is also an NEO. For 2025, Susan Graham-Bryce, Chief Human Resources Officer, is also an NEO. |
| [2] | The dollar amounts reported in column (e) represent the average amount of “Compensation Actually Paid” to the NEOs as a group (excluding the PEOs) for the corresponding year. Compensation Actually Paid is calculated pursuant to the requirements of Item 402(v) of Regulation S-K, adjusting Summary Compensation table totals to reflect equity award valuation changes at certain points over time. It does not reflect dollar amounts actually paid to our NEOs. The NEOs included for purposes of these calculations are described in footnote 4. |
| [3] | Represents the weighted peer group TSR, weighted according to the respective companies’ stock market capitalization at the beginning of each period for which a return is indicated. The peer group used for this purpose is the following published industry index: SIC Code 3826 Index – Laboratory Analytical Instruments. |
| [4] | The dollar amounts reported represent the amount of net income reflected in the company’s audited financial statements for the applicable year. |
| [5] | While the company uses numerous financial and non-financial performance measures for the purpose of evaluating performance for the company’s compensation programs, the company has determined that non-GAAP earnings per share is the financial performance measure that, in the company’s assessment, represents the most important performance measure (that is not otherwise required to be disclosed in the table) used by the company to link compensation actually paid to the company’s NEOs (including the PEOs), for the most recently completed fiscal year, to company performance. |
| [6] | In 2021, the company had two Principal Executive Officers (PEO). Olivier Filliol (PEO – 2, in the table above) was the PEO until April 1, 2021. Patrick Kaltenbach (PEO – 1, in the table above) is the PEO since April 1, 2021. |
| [7] | The dollar amounts reported in column (b) are the amounts of total compensation reported for our Principal Executive Officer(s) for each corresponding year in the “Total” column of the Summary Compensation Table. |
| [8] | The dollar amounts reported in column (c) represent the “Compensation Actually Paid” to the applicable PEO for the corresponding year. Compensation Actually Paid is calculated pursuant to the requirements of Item 402(v) of Regulation S-K, adjusting Summary Compensation Table totals to reflect equity award valuation changes at certain points over time. It does not reflect dollar amounts actually paid to our PEOs. |