Pay vs Performance Disclosure - USD ($)
Dec. 31, 2025
Dec. 31, 2024
Dec. 31, 2023
PAY VERSUS PERFORMANCE
In accordance with rules adopted by the Securities and Exchange Commission pursuant to the Dodd-Frank Wall Street Reform and Consumer Protection Act of 2010, we are providing the following disclosure regarding executive compensation for our principal executive officer (“PEO”) and Non-PEO NEOs and Company performance for the fiscal years listed below. The Compensation Committee did not consider the pay versus performance disclosure below in making its pay decisions for any of the years shown.
Year |
Summary Compensation Table Total for PEO (1) |
Compensation Actually Paid to PEO (1)(2)(3) |
Average Summary Compensation Table Total for Non-PEO NEOs (1) |
Average Compensation Actually Paid to Non-PEO NEOs (1)(2)(3) |
Value of Initial Fixed $100 Investment Based on TSR (4) |
Net Income (in thousands) | ||||||||||||||||||||||||
2025 |
$ | 580,943 | $ | 601,214 | $ | 382,658 | $ | 392,659 | $ | 171.62 | $ | 5,992 | ||||||||||||||||||
2024 |
644,151 | 681,468 | 401,374 | 419,440 | 151.35 | 8,170 | ||||||||||||||||||||||||
2023 |
724,672 | 745,430 | 442,015 | 451,384 | 121.62 | 8,485 | ||||||||||||||||||||||||
(1) |
The PEO for 2025, 2024 and 2023 was James F. House. The non-PEO NEOs for 2025, 2024 and 2023 were Thomas S. Elley (Senior Executive Vice President, Chief Financial Officer, Treasurer and Assistant Secretary) and William C. Mitchell (Senior Executive Vice President, Consumer Lending of the Bank). |
(2) |
The amounts shown for Compensation Actually Paid have been calculated in accordance with Item 402(v) of Regulation S-K and do not reflect compensation actually earned, realized, or received by the Company’s NEOs. These amounts reflect the Summary Compensation Table Total with certain adjustments as described in footnote 3 below. |
(3 ) |
Compensation Actually Paid reflects the exclusions and inclusions of certain amounts for the PEO and the Non-PEO NEOs as set forth below. Equity values are calculated in accordance with FASB ASC Topic 718. To calculate the amounts of Compensation Actually Paid to the PEO in 2025, the following adjustments were made to the PEO’s Summary Compensation Table Total: |
| a. | We deducted $85,475 reported in the Summary Compensation Table, reflecting the grant date fair value of 6,500 shares of restricted stock granted to the PEO in fiscal year 2025; |
| b. | We added $90,805, reflecting the fair value of such shares of restricted stock as of the end of fiscal year 2025; |
| c. | We added $11,363, reflecting the change in the fair value during fiscal year 2025 of 8,234 shares of restricted stock granted to the PEO before fiscal year 2025 that were outstanding and unvested as of the end of fiscal year 2025; and |
| d. | We added $3,578, reflecting, as of the applicable vesting date, the change in the fair value during fiscal year 2025 of 8,245 shares of restricted stock granted to the PEO before fiscal year 2025 that vested during fiscal year 2025. |
To calculate the amounts of Compensation Actually Paid, on average, to our
non-PEO
NEOs in 2025, the following adjustments were made to the Average Summary Compensation Table Total for Non-PEO
NEOs: | a. | We deducted $42,738 reported in the Summary Compensation Table, reflecting the average grant date fair value of restricted stock granted to the non-PEO NEOs in fiscal year 2025; |
| b. | We added $45,403, reflecting the average fair value of such restricted stock as of the end of fiscal year 2025; |
| c. | We added $5,682, reflecting the average change in the fair value during fiscal year 2025 of restricted stock granted to the non-PEO NEOs before fiscal year 2025 that were outstanding and unvested as of the end of fiscal year 2025; and |
| d. | We added $1,653, reflecting, as of the applicable vesting date, the average change in the fair value during fiscal year 2025 of restricted stock granted to the non-PEO NEOs before fiscal year 2025 that vested during fiscal year 2025. |
(4) |
The values disclosed in this TSR column represent the measurement period value of an investment of $100 in our common stock as of December 31, 2022, and then valued again on each of December 31, 2023, December 31, 2024 and December 31, 2025. Historical stock performance is not necessarily indicative of future stock performance. |
(3 ) |
Compensation Actually Paid reflects the exclusions and inclusions of certain amounts for the PEO and the Non-PEO NEOs as set forth below. Equity values are calculated in accordance with FASB ASC Topic 718. To calculate the amounts of Compensation Actually Paid to the PEO in 2025, the following adjustments were made to the PEO’s Summary Compensation Table Total: |
| a. | We deducted $85,475 reported in the Summary Compensation Table, reflecting the grant date fair value of 6,500 shares of restricted stock granted to the PEO in fiscal year 2025; |
| b. | We added $90,805, reflecting the fair value of such shares of restricted stock as of the end of fiscal year 2025; |
| c. | We added $11,363, reflecting the change in the fair value during fiscal year 2025 of 8,234 shares of restricted stock granted to the PEO before fiscal year 2025 that were outstanding and unvested as of the end of fiscal year 2025; and |
| d. | We added $3,578, reflecting, as of the applicable vesting date, the change in the fair value during fiscal year 2025 of 8,245 shares of restricted stock granted to the PEO before fiscal year 2025 that vested during fiscal year 2025. |
To calculate the amounts of Compensation Actually Paid, on average, to our
non-PEO
NEOs in 2025, the following adjustments were made to the Average Summary Compensation Table Total for Non-PEO
NEOs: | a. | We deducted $42,738 reported in the Summary Compensation Table, reflecting the average grant date fair value of restricted stock granted to the non-PEO NEOs in fiscal year 2025; |
| b. | We added $45,403, reflecting the average fair value of such restricted stock as of the end of fiscal year 2025; |
| c. | We added $5,682, reflecting the average change in the fair value during fiscal year 2025 of restricted stock granted to the non-PEO NEOs before fiscal year 2025 that were outstanding and unvested as of the end of fiscal year 2025; and |
| d. | We added $1,653, reflecting, as of the applicable vesting date, the average change in the fair value during fiscal year 2025 of restricted stock granted to the non-PEO NEOs before fiscal year 2025 that vested during fiscal year 2025. |
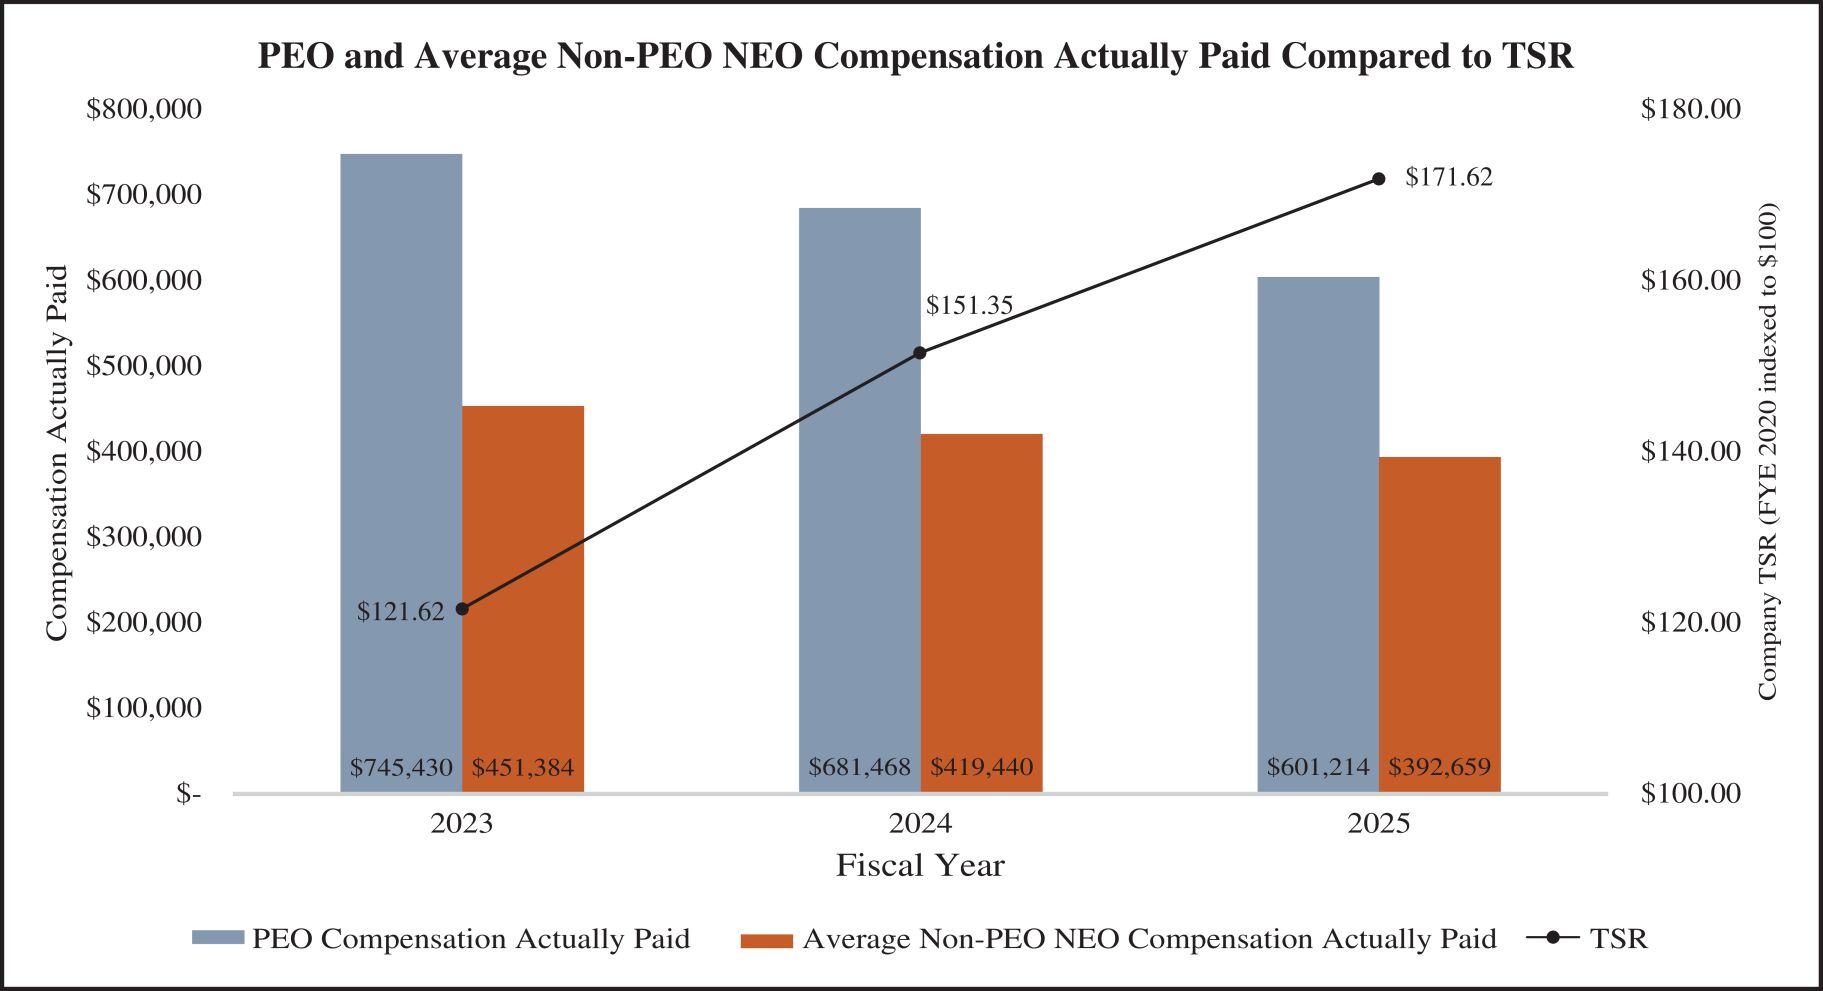
Description of Relationship Between PEO and Other NEO Compensation Actually Paid and Company Total Shareholder Return (“TSR”)
The following chart sets forth the relationship between Compensation Actually Paid to our PEO, the average of Compensation Actually Paid to our other NEOs, and the Company’s cumulative TSR over the three most recently completed fiscal years.
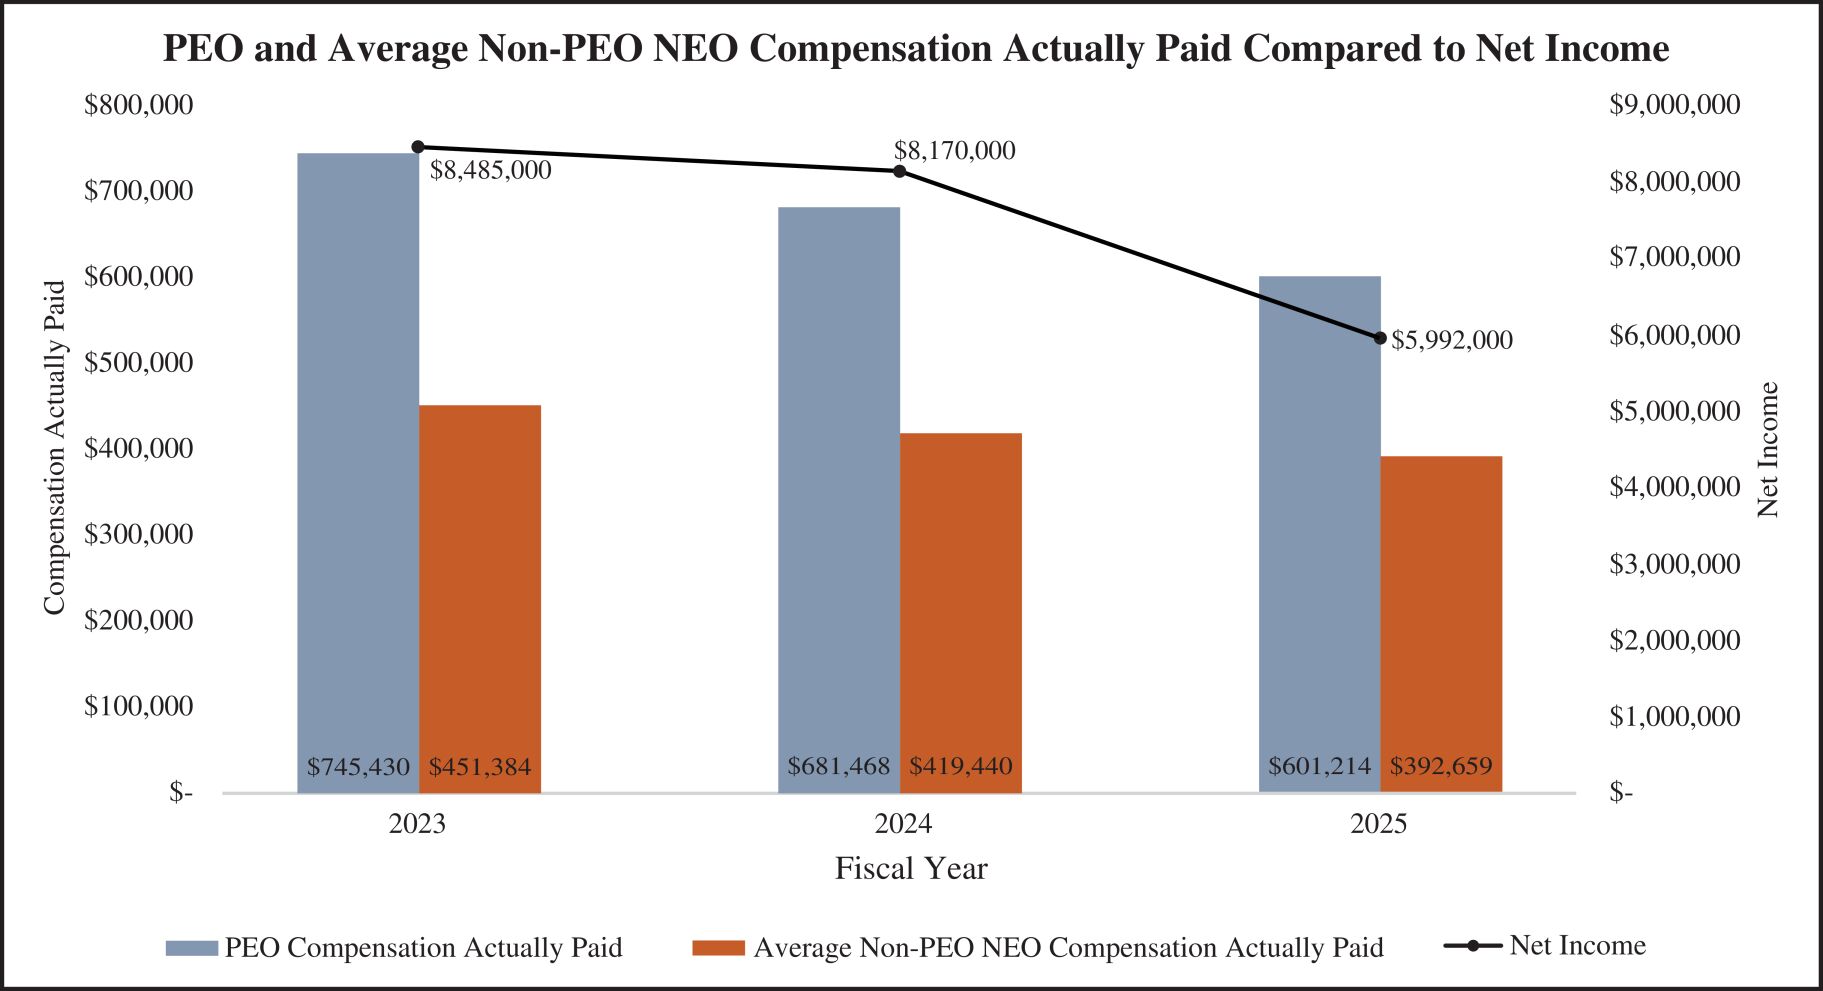
Description of Relationship Between PEO and Other NEO Compensation Actually Paid and Net Income
The following chart sets forth the relationship between Compensation Actually Paid to our PEO, the average of Compensation Actually Paid to our other NEOs, and our Net Income during the three most recently completed fiscal years
.