Pay vs Performance Disclosure
Feb. 07, 2022
Dec. 31, 2022
Dec. 31, 2025
USD ($)
$ / shares
Companies
Dec. 31, 2024
USD ($)
$ / shares
Dec. 31, 2023
USD ($)
$ / shares
Dec. 31, 2022
USD ($)
$ / shares
Dec. 31, 2021
USD ($)
$ / shares
PAY VERSUS PERFORMANCE
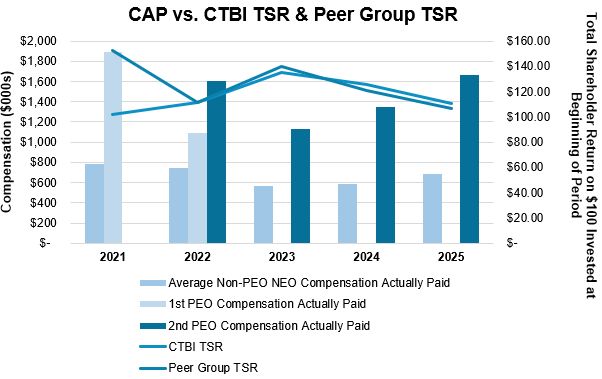
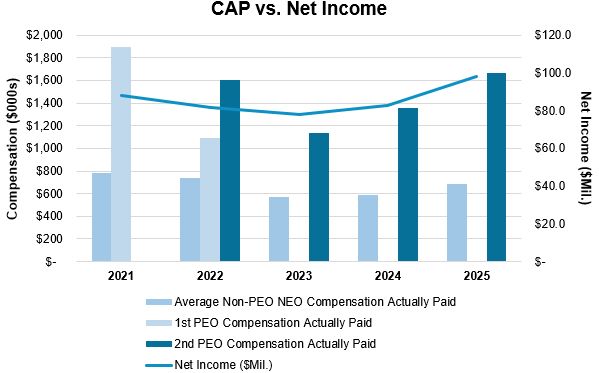
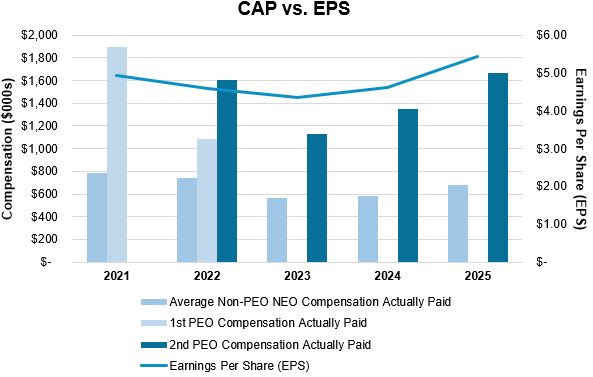
The table below shows the following information for the past five fiscal years: (i) total compensation for our NEOs as set
forth in the Summary Compensation Table (“SCT”), (ii) the “compensation actually paid” (“CAP”) to our PEOs and, on an average basis, our non-PEO NEOs (in each case, as determined under SEC rules), (iii) our total shareholder return (“TSR”),
(iv) the TSR of our peer group (as set forth in our Compensation Discussion and Analysis), (v) our net income, and (vi) our financial performance measure for compensatory purposes, EPS.
PAY VERSUS PERFORMANCE TABLE
|
Year
|
SCT
Total for
PEO 1 ($)
|
SCT
Total for
PEO 2 ($)
|
CAP to
PEO 1 ($)
|
CAP to
PEO 2 ($)
|
Average
SCT Total
for Non-
PEO
NEOs ($)
|
Average
CAP to
Non-PEO
NEOs ($)
|
Year-End Value of
$100 Invested on
12/31/2019:
|
Net
Income
($)
(in
thousands)
|
EPS
($)
|
|
|
TSR
($)
|
Peer
Group
TSR ($)
|
|||||||||
|
(a)
|
(b)
|
(c)
|
(c)
|
(d)
|
(c)(d)
|
(e)
|
(f)
|
|||
|
2025
|
-
|
1,639,760
|
-
|
1,665,249
|
674,175
|
684,423
|
110.50
|
106.44
|
98,058
|
5.44
|
|
2024
|
-
|
1,314,119
|
-
|
1,352,906
|
561,005
|
584,837
|
125.93
|
121.20
|
82,813
|
4.61
|
|
2023
|
-
|
1,137,008
|
-
|
1,132,396
|
551,053
|
568,935
|
135.13
|
141.16
|
78,004
|
4.36
|
|
2022
|
1,083,896
|
1,591,746
|
1,088,746
|
1,601,451
|
732,813
|
742,633
|
111.37
|
111.31
|
81,814
|
4.59
|
|
2021
|
1,853,539
|
-
|
1,895,857
|
-
|
756,261
|
783,671
|
101.72
|
152.38
|
87,939
|
4.94
|
| a) |
Jean R. Hale, who served as Chairman and Chief Executive Officer until her retirement on February 7, 2022, is listed as
PEO 1 for years 2021 and 2022.
|
| b) |
Following Ms. Hale’s retirement, Mark A. Gooch became Chief Executive Officer, and as such, is listed as PEO 2 for
years 2022 through 2025.
|
| c) |
SEC rules require certain adjustments be made to the SCT totals to determine CAP as reported in the Pay Versus Performance table. CAP does not necessarily represent cash and/or equity value transferred to
the applicable NEO without restriction, but rather is a value calculated under applicable SEC rules. In general, CAP is calculated as SCT total compensation adjusted to include the fair market value of equity awards as of December 31 of
the applicable year or, if earlier, the vesting date (rather than the grant date). NEOs do not participate in a defined benefit plan so no adjustment for pension benefits is included in the table below. Similarly, we had no awards that
failed to meet vesting conditions. The following table details these adjustments:
|
|
Year
|
Executives
|
SCT Total
($)
|
Subtract
Stock
Awards ($)
|
Add Year-
End Equity
Value ($)
|
Change in
Value of
Prior
Equity
Awards ($)
|
Add
Change in
Value of
Vested
Equity
Awards ($)
|
Add
Dividends
Paid on
Unvested
Shares ($)
|
CAP ($)
|
|
2025
|
PEO 2
|
1,639,760
|
137,090
|
144,697
|
7,823
|
1,209
|
8,850
|
1,665,249
|
|
Other NEOs
|
674,175
|
52,352
|
55,257
|
3,246
|
532
|
3,565
|
684,423
|
|
|
2024
|
PEO 2
|
1,314,119
|
0
|
0
|
34,535
|
(3,514)
|
7,766
|
1,352,906
|
|
Other NEOs
|
561,005
|
0
|
0
|
20,861
|
(1,608)
|
4,579
|
584,837
|
|
|
2023
|
PEO 2
|
1,137,008
|
153,796
|
150,221
|
(4,302)
|
(5,619)
|
8,884
|
1,132,396
|
|
Other NEOs
|
551,053
|
40,028
|
59,233
|
(3,579)
|
(2,942)
|
5,198
|
568,935
|
|
|
2022
|
PEO 1
|
1,083,896
|
160,989
|
162,546
|
-
|
1,834
|
1,458
|
1,088,746
|
|
PEO 2
|
1,591,746
|
98,622
|
99,576
|
2,932
|
655
|
5,162
|
1,601,451
|
|
|
Other NEOs
|
732,813
|
52,687
|
53,196
|
2,557
|
2,802
|
3,952
|
742,633
|
|
|
2021
|
PEO 1
|
1,853,539
|
28,174
|
31,748
|
19,136
|
13,509
|
6,099
|
1,895,857
|
|
Other NEOs
|
756,261
|
11,485
|
12,941
|
20,088
|
467
|
5,398
|
783,671
|
| d) |
For 2021, the non-PEO NEOs included Mark A. Gooch, Kevin J. Stumbo, James B. Draughn, and Larry W. Jones. For 2022, Mr. Gooch was excluded from the non-PEO NEOs and Richard W. Newsom and Ricky D. Sparkman were added. In 2023, Mr.
Jones was excluded from the non-PEO NEOs due to his retirement in December 2022. In 2025, Charles Wayne Hancock II was added, and James B. Draughn was excluded due to his retirement on January 31, 2025. The following tables summarizes
which NEOs were included in the non-PEO calculations for the five years ended December 31, 2025.
|
|
Non-PEO NEO
|
2021
|
2022
|
2023
|
2024
|
2025
|
|
|
Mark A. Gooch
|
X
|
|||||
|
Kevin J. Stumbo
|
X
|
X
|
X
|
X
|
X
|
|
|
James B. Draughn
|
X
|
X
|
X
|
X
|
||
|
Larry W. Jones
|
X
|
X
|
||||
|
Richard W. Newsom
|
X
|
X
|
X
|
X
|
||
|
Ricky D. Sparkman
|
X
|
X
|
X
|
X
|
||
|
C. Wayne Hancock II
|
X
|
| e) |
CTBI periodically compares its executive pay and business performance, as well as the compensation of the Board, to a group of comparable, publicly traded financial institutions. In establishing a Peer Group, CTBI seeks to include
regional bank holding companies that are similar to CTBI in terms of assets, business lines, and geographic markets. During 2025, the Committee worked with Pearl Meyer to review the Peer Group to ensure it continued to include
organizations that were comparable to CTBI. Based on this review, the Committee determined that no changes to the Peer Group were necessary. The Peer Group consists of twenty-one companies listed below. The Committee believes the Peer Group provides a reasonable basis of comparison for CTBI due to their similar business lines and
geographic locations, as well as their comparable size, reflected by total assets. At the time of the 2025 review, the median assets of the Peer Group were $6.6 billion, compared to CTBI’s assets of approximately $6.4 billion. The companies included
in the Peer Group ranged in asset size from $3.2 billion to $9.5 billion.
|
|
Bank
|
Ticker
|
Bank
|
Ticker
|
|
Capital City Bank Group, Inc.
|
CCBG
|
Mercantile Bank Corporation
|
MBWM
|
|
City Holding Company
|
CHCO
|
Midland States Bancorp, Inc.
|
MSBI
|
|
Farmers National Banc Corp.
|
FMNB
|
Nicolet Bankshares, Inc.
|
NIC
|
|
First Community Bancshares, Inc.
|
FCBC
|
Peoples Bancorp Inc.
|
PEBO
|
|
First Financial Corporation
|
THFF
|
QCR Holdings, Inc.
|
QCRH
|
|
First Mid Bancshares, Inc.
|
FMBH
|
Republic Bancorp, Inc.
|
RBCA.A
|
|
German American Bancorp, Inc.
|
GABC
|
SmartFinancial, Inc.
|
SMBK
|
|
Great Southern Bancorp, Inc.
|
GSBC
|
Stock Yards Bancorp, Inc.
|
SYBT
|
|
HomeTrust Bancshares, Inc.
|
HTBI
|
Univest Financial Corporation
|
UVSP
|
|
Independent Bank Corporation
|
IBCP
|
Wilson Bank Holding Company
|
WBHC
|
|
Lakeland Financial Corporation
|
LKFN
|
Below is a comparison of our TSR for 2025 to the Peer Group:
|
Year-End Value of $100 Invested on 12/31/2020:
|
||
|
Year
|
TSR ($)
|
Peer Group TSR ($)
|
|
2025
|
110.50
|
106.44
|
| (f) |
CTBI has selected GAAP basic earnings per share as the most important financial performance measure (that is not otherwise
disclosed in the Pay Versus Performance Table above) used by CTBI to link compensation actually paid to CTBI’s NEOs for 2025 to CTBI’s performance.
|
| a) |
Jean R. Hale, who served as Chairman and Chief Executive Officer until her retirement on February 7, 2022, is listed as
PEO 1 for years 2021 and 2022.
|
| b) |
Following Ms. Hale’s retirement, Mark A. Gooch became Chief Executive Officer, and as such, is listed as PEO 2 for
years 2022 through 2025.
|
| d) |
For 2021, the non-PEO NEOs included Mark A. Gooch, Kevin J. Stumbo, James B. Draughn, and Larry W. Jones. For 2022, Mr. Gooch was excluded from the non-PEO NEOs and Richard W. Newsom and Ricky D. Sparkman were added. In 2023, Mr.
Jones was excluded from the non-PEO NEOs due to his retirement in December 2022. In 2025, Charles Wayne Hancock II was added, and James B. Draughn was excluded due to his retirement on January 31, 2025. The following tables summarizes
which NEOs were included in the non-PEO calculations for the five years ended December 31, 2025.
|
|
Non-PEO NEO
|
2021
|
2022
|
2023
|
2024
|
2025
|
|
|
Mark A. Gooch
|
X
|
|||||
|
Kevin J. Stumbo
|
X
|
X
|
X
|
X
|
X
|
|
|
James B. Draughn
|
X
|
X
|
X
|
X
|
||
|
Larry W. Jones
|
X
|
X
|
||||
|
Richard W. Newsom
|
X
|
X
|
X
|
X
|
||
|
Ricky D. Sparkman
|
X
|
X
|
X
|
X
|
||
|
C. Wayne Hancock II
|
X
|
| e) |
CTBI periodically compares its executive pay and business performance, as well as the compensation of the Board, to a group of comparable, publicly traded financial institutions. In establishing a Peer Group, CTBI seeks to include
regional bank holding companies that are similar to CTBI in terms of assets, business lines, and geographic markets. During 2025, the Committee worked with Pearl Meyer to review the Peer Group to ensure it continued to include
organizations that were comparable to CTBI. Based on this review, the Committee determined that no changes to the Peer Group were necessary. The Peer Group consists of twenty-one companies listed below. The Committee believes the Peer Group provides a reasonable basis of comparison for CTBI due to their similar business lines and
geographic locations, as well as their comparable size, reflected by total assets. At the time of the 2025 review, the median assets of the Peer Group were $6.6 billion, compared to CTBI’s assets of approximately $6.4 billion. The companies included
in the Peer Group ranged in asset size from $3.2 billion to $9.5 billion.
|
|
Bank
|
Ticker
|
Bank
|
Ticker
|
|
Capital City Bank Group, Inc.
|
CCBG
|
Mercantile Bank Corporation
|
MBWM
|
|
City Holding Company
|
CHCO
|
Midland States Bancorp, Inc.
|
MSBI
|
|
Farmers National Banc Corp.
|
FMNB
|
Nicolet Bankshares, Inc.
|
NIC
|
|
First Community Bancshares, Inc.
|
FCBC
|
Peoples Bancorp Inc.
|
PEBO
|
|
First Financial Corporation
|
THFF
|
QCR Holdings, Inc.
|
QCRH
|
|
First Mid Bancshares, Inc.
|
FMBH
|
Republic Bancorp, Inc.
|
RBCA.A
|
|
German American Bancorp, Inc.
|
GABC
|
SmartFinancial, Inc.
|
SMBK
|
|
Great Southern Bancorp, Inc.
|
GSBC
|
Stock Yards Bancorp, Inc.
|
SYBT
|
|
HomeTrust Bancshares, Inc.
|
HTBI
|
Univest Financial Corporation
|
UVSP
|
|
Independent Bank Corporation
|
IBCP
|
Wilson Bank Holding Company
|
WBHC
|
|
Lakeland Financial Corporation
|
LKFN
|
Below is a comparison of our TSR for 2025 to the Peer Group:
|
Year-End Value of $100 Invested on 12/31/2020:
|
||
|
Year
|
TSR ($)
|
Peer Group TSR ($)
|
|
2025
|
110.50
|
106.44
|
| c) |
SEC rules require certain adjustments be made to the SCT totals to determine CAP as reported in the Pay Versus Performance table. CAP does not necessarily represent cash and/or equity value transferred to
the applicable NEO without restriction, but rather is a value calculated under applicable SEC rules. In general, CAP is calculated as SCT total compensation adjusted to include the fair market value of equity awards as of December 31 of
the applicable year or, if earlier, the vesting date (rather than the grant date). NEOs do not participate in a defined benefit plan so no adjustment for pension benefits is included in the table below. Similarly, we had no awards that
failed to meet vesting conditions. The following table details these adjustments:
|
|
Year
|
Executives
|
SCT Total
($)
|
Subtract
Stock
Awards ($)
|
Add Year-
End Equity
Value ($)
|
Change in
Value of
Prior
Equity
Awards ($)
|
Add
Change in
Value of
Vested
Equity
Awards ($)
|
Add
Dividends
Paid on
Unvested
Shares ($)
|
CAP ($)
|
|
2025
|
PEO 2
|
1,639,760
|
137,090
|
144,697
|
7,823
|
1,209
|
8,850
|
1,665,249
|
|
Other NEOs
|
674,175
|
52,352
|
55,257
|
3,246
|
532
|
3,565
|
684,423
|
|
|
2024
|
PEO 2
|
1,314,119
|
0
|
0
|
34,535
|
(3,514)
|
7,766
|
1,352,906
|
|
Other NEOs
|
561,005
|
0
|
0
|
20,861
|
(1,608)
|
4,579
|
584,837
|
|
|
2023
|
PEO 2
|
1,137,008
|
153,796
|
150,221
|
(4,302)
|
(5,619)
|
8,884
|
1,132,396
|
|
Other NEOs
|
551,053
|
40,028
|
59,233
|
(3,579)
|
(2,942)
|
5,198
|
568,935
|
|
|
2022
|
PEO 1
|
1,083,896
|
160,989
|
162,546
|
-
|
1,834
|
1,458
|
1,088,746
|
|
PEO 2
|
1,591,746
|
98,622
|
99,576
|
2,932
|
655
|
5,162
|
1,601,451
|
|
|
Other NEOs
|
732,813
|
52,687
|
53,196
|
2,557
|
2,802
|
3,952
|
742,633
|
|
|
2021
|
PEO 1
|
1,853,539
|
28,174
|
31,748
|
19,136
|
13,509
|
6,099
|
1,895,857
|
|
Other NEOs
|
756,261
|
11,485
|
12,941
|
20,088
|
467
|
5,398
|
783,671
|
CAP and Cumulative TSR / Cumulative TSR of the Peer Group
CAP and CTBI Net Income
CAP and Earnings Per Share
CAP and Cumulative TSR / Cumulative TSR of the Peer Group
Tabular List of Financial Performance Measures
Pursuant to the requirements of Item 402(v) of the SEC’s Regulation S-K, we provide the following list of the three most important financial
performance measures used to link CAP (as calculated in accordance with the SEC rules) to our NEOs to CTBI’s performance in 2025. Please refer to the section entitled “Annual Incentive Plan” in our Compensation Discussion and Analysis
(“CD&A”) for more information.
Pay Versus
|
Measure 1
|
Net Income
|
|
|
Measure 2
|
EPS
|
|
|
Measure 3
|
ROAA
|