Shareholder Report
Oct. 31, 2025
USD ($)
Holding
What were the Fund costs for the last year?
(Based on a hypothetical $10,000 investment)
| Share Class Name | Costs of a $10,000 investment | Costs paid as a percentage of a $10,000 investment |
| SIMPLE Class | $120 | 1.16% |
What factors influenced Fund performance during the reporting period?
During the 12-month reporting period ended October 31, 2025, the Fund’s performance relative to the ICE BofA U.S. High Yield Constrained Index was affected by security selection and asset allocation. The strongest positive contributions to relative returns came from positions in utilities, capital goods and basic industries. The weakest relative performance came from positions in telecommunications, retail and media.
The following table outlines the key factors (securities, sectors, industries, market events and/or other characteristics) that materially affected the Fund’s performance during the reporting period.
| Key Factor | Summary | Impact |
| Utilities | Security selection (a position in Lightning Power Holdings and lack of exposure to Sunnova) | Contributed |
| Capital goods | Security selection (lack of exposure to Ardagh Packaging) and overweight exposure | Contributed |
| Basic industry | Security selection and overweight exposure (a position in First Quantum Minerals) | Contributed |
| Telecommunications | Security selection and underweight exposure (a position in Liberty Media Puerto Rico and underweight exposure to EchoStar) | Detracted |
| Retail | Security selection (a position in Saks) | Detracted |
| Media | Security selection (a position in OT Midco Inc.) and an underweight allocation (underweight Discovery Communications) | Detracted |
Fund Performance
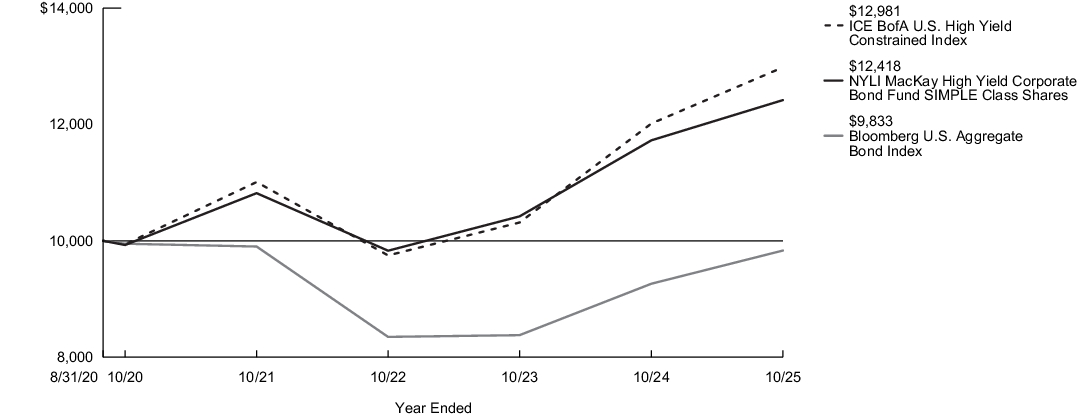
The following graph compares the initial and subsequent account values at the end of each of the most recently completed 10 fiscal years of the Fund (or for the life of the Fund, if shorter). It assumes a $10,000 initial investment at the beginning of the first fiscal year in an appropriate, broad-based securities market index and other indexes, if applicable, for the same period and reflects the deduction of all sales charges, where applicable.
| Average Annual Total Returns for the Year Ended October 31, 2025 | Inception Date |
One Year |
Five Years |
Since Inception |
| SIMPLE Class Shares | 8/31/2020 | 5.90% | 4.58% | 4.28% |
| Bloomberg U.S. Aggregate Bond Index1 | 6.16% | (0.24)% | (0.32)% | |
| ICE BofA U.S. High Yield Constrained Index2 | 8.03% | 5.48% | 5.18% | |
| Morningstar High Yield Bond Category Average3 | 7.61% | 5.14% | 4.67% |
| 1. |
The Fund has selected the Bloomberg U.S. Aggregate Bond Index to represent a broad measure of market performance. The Bloomberg U.S. Aggregate Bond Index is a broad-based benchmark that measures the performance of the investment grade, U.S. dollar-denominated, fixed-rate taxable bond market, including Treasuries, government-related and corporate securities, mortgage-backed securities (agency fixed-rate and hybrid adjustable rate mortgage pass-throughs), asset-backed securities and commercial mortgage-backed securities. |
| 2. |
The ICE BofA U.S. High Yield Constrained Index, which is generally representative of the market sectors or types of investments in which the Fund invests, is a market value-weighted index of all domestic and Yankee high-yield bonds, including deferred interest bonds and payment-in-kind securities. Issuers included in the ICE BofA U.S. High Yield Constrained Index have maturities of one year or more and have a credit rating lower than BBB-/Baa3, but are not in default. No single issuer may constitute greater than 2% of the ICE BofA U.S. High Yield Constrained Index. |
| 3. |
The Morningstar High Yield Bond Category Average is representative of funds that concentrate on lower-quality bonds, which are riskier than those of higher-quality companies. These funds primarily invest in U.S. high-income debt securities where at least 65% or more of bond assets are not rated or are rated by a major agency such as Standard & Poor’s or Moody’s at the level of BB and below. Results are based on average total returns of similar funds with all dividends and capital gain distributions reinvested. |
Key Fund Statistics
| Fund's net assets | $11,167,394,534 |
| Total number of portfolio holdings | 625 |
| Total advisory fees paid | $60,991,221 |
| Portfolio turnover rate | 34% |
Graphical Representation of Holdings
The tables below show the investment makeup of the Fund; percentages indicated are based on the Fund's net assets.
Top Ten Holdings and/or Issuers*
| TransDigm, Inc., 4.625%-7.125%, due 8/15/28-1/31/34 | 2.8% |
| CCO Holdings LLC, 4.25%-5.375%, due 5/1/27-1/15/34 | 1.9% |
| Hilton Domestic Operating Co., Inc., 4.00%-5.875%, due 5/1/28-9/15/33 | 1.2% |
| Yum! Brands, Inc., 3.625%-5.375%, due 1/15/30-4/1/32 | 1.2% |
| Talen Energy Supply LLC, 6.25%-8.625%, due 5/17/30-2/1/36 | 1.2% |
| Churchill Downs, Inc., 4.75%-6.75%, due 4/1/27-5/1/31 | 1.2% |
| Jane Street Group, 6.125%-7.125%, due 4/30/31-5/1/33 | 1.1% |
| LifePoint Health, Inc., 5.375%-11.00%, due 1/15/29-6/1/32 | 1.1% |
| Cloud Software Group, Inc., 6.50%-9.00%, due 3/31/29-8/15/33 | 1.0% |
| 1011778 B.C. Unlimited Liability Co., 3.875%-6.125%, due 1/15/28-10/15/30 | 0.9% |
| * Excluding short-term investments |
Portfolio Composition
| Corporate Bonds | 86.7% |
| Loan Assignments | 6.9% |
| Common Stocks | 0.9% |
| Convertible Bonds | 0.4% |
| Exchange-Traded Funds | 0.4% |
| Preferred Stock | 0.3% |
| Foreign Government Bond | 0.0%‡ |
| Convertible Preferred Stock | 0.0%‡ |
| Other Assets, Less Liabilities | 4.4% |
| ‡ Less than one-tenth of a percent. |
Top Ten Holdings and/or Issuers*
| TransDigm, Inc., 4.625%-7.125%, due 8/15/28-1/31/34 | 2.8% |
| CCO Holdings LLC, 4.25%-5.375%, due 5/1/27-1/15/34 | 1.9% |
| Hilton Domestic Operating Co., Inc., 4.00%-5.875%, due 5/1/28-9/15/33 | 1.2% |
| Yum! Brands, Inc., 3.625%-5.375%, due 1/15/30-4/1/32 | 1.2% |
| Talen Energy Supply LLC, 6.25%-8.625%, due 5/17/30-2/1/36 | 1.2% |
| Churchill Downs, Inc., 4.75%-6.75%, due 4/1/27-5/1/31 | 1.2% |
| Jane Street Group, 6.125%-7.125%, due 4/30/31-5/1/33 | 1.1% |
| LifePoint Health, Inc., 5.375%-11.00%, due 1/15/29-6/1/32 | 1.1% |
| Cloud Software Group, Inc., 6.50%-9.00%, due 3/31/29-8/15/33 | 1.0% |
| 1011778 B.C. Unlimited Liability Co., 3.875%-6.125%, due 1/15/28-10/15/30 | 0.9% |
| * Excluding short-term investments |
What were the Fund costs for the last year?
(Based on a hypothetical $10,000 investment)
| Share Class Name | Costs of a $10,000 investment | Costs paid as a percentage of a $10,000 investment |
| Investor Class | $119 | 1.16% |
What factors influenced Fund performance during the reporting period?
During the 12-month reporting period ended October 31, 2025, the Fund’s performance relative to the ICE BofA U.S. High Yield Constrained Index was affected by security selection and asset allocation. The strongest positive contributions to relative returns came from positions in utilities, capital goods and basic industries. The weakest relative performance came from positions in telecommunications, retail and media.
The following table outlines the key factors (securities, sectors, industries, market events and/or other characteristics) that materially affected the Fund’s performance during the reporting period.
| Key Factor | Summary | Impact |
| Utilities | Security selection (a position in Lightning Power Holdings and lack of exposure to Sunnova) | Contributed |
| Capital goods | Security selection (lack of exposure to Ardagh Packaging) and overweight exposure | Contributed |
| Basic industry | Security selection and overweight exposure (a position in First Quantum Minerals) | Contributed |
| Telecommunications | Security selection and underweight exposure (a position in Liberty Media Puerto Rico and underweight exposure to EchoStar) | Detracted |
| Retail | Security selection (a position in Saks) | Detracted |
| Media | Security selection (a position in OT Midco Inc.) and an underweight allocation (underweight Discovery Communications) | Detracted |
Fund Performance
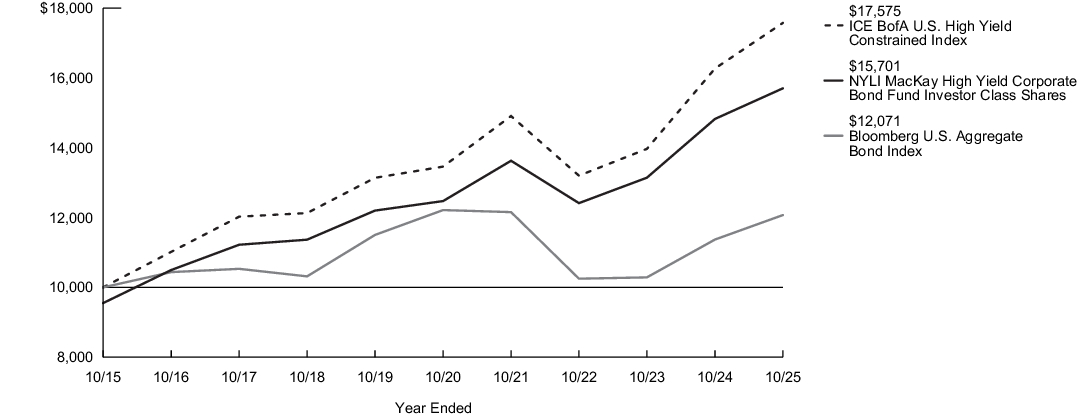
The following graph compares the initial and subsequent account values at the end of each of the most recently completed 10 fiscal years of the Fund (or for the life of the Fund, if shorter). It assumes a $10,000 initial investment at the beginning of the first fiscal year in an appropriate, broad-based securities market index and other indexes, if applicable, for the same period and reflects the deduction of all sales charges, where applicable.
| Average Annual Total Returns for the Year Ended October 31, 2025 | Inception Date |
One Year |
Five Years |
Ten Years |
| Investor Class Shares - Including sales charges | 2/28/2008 | 1.68% | 3.86% | 4.61% |
| Investor Class Shares - Excluding sales charges | 5.92% | 4.71% | 5.10% | |
| Bloomberg U.S. Aggregate Bond Index1 | 6.16% | (0.24)% | 1.90% | |
| ICE BofA U.S. High Yield Constrained Index2 | 8.03% | 5.48% | 5.80% | |
| Morningstar High Yield Bond Category Average3 | 7.61% | 5.14% | 5.01% |
| 1. |
The Fund has selected the Bloomberg U.S. Aggregate Bond Index to represent a broad measure of market performance. The Bloomberg U.S. Aggregate Bond Index is a broad-based benchmark that measures the performance of the investment grade, U.S. dollar-denominated, fixed-rate taxable bond market, including Treasuries, government-related and corporate securities, mortgage-backed securities (agency fixed-rate and hybrid adjustable rate mortgage pass-throughs), asset-backed securities and commercial mortgage-backed securities. |
| 2. |
The ICE BofA U.S. High Yield Constrained Index, which is generally representative of the market sectors or types of investments in which the Fund invests, is a market value-weighted index of all domestic and Yankee high-yield bonds, including deferred interest bonds and payment-in-kind securities. Issuers included in the ICE BofA U.S. High Yield Constrained Index have maturities of one year or more and have a credit rating lower than BBB-/Baa3, but are not in default. No single issuer may constitute greater than 2% of the ICE BofA U.S. High Yield Constrained Index. |
| 3. |
The Morningstar High Yield Bond Category Average is representative of funds that concentrate on lower-quality bonds, which are riskier than those of higher-quality companies. These funds primarily invest in U.S. high-income debt securities where at least 65% or more of bond assets are not rated or are rated by a major agency such as Standard & Poor’s or Moody’s at the level of BB and below. Results are based on average total returns of similar funds with all dividends and capital gain distributions reinvested. |
Key Fund Statistics
| Fund's net assets | $11,167,394,534 |
| Total number of portfolio holdings | 625 |
| Total advisory fees paid | $60,991,221 |
| Portfolio turnover rate | 34% |
Graphical Representation of Holdings
The tables below show the investment makeup of the Fund; percentages indicated are based on the Fund's net assets.
Top Ten Holdings and/or Issuers*
| TransDigm, Inc., 4.625%-7.125%, due 8/15/28-1/31/34 | 2.8% |
| CCO Holdings LLC, 4.25%-5.375%, due 5/1/27-1/15/34 | 1.9% |
| Hilton Domestic Operating Co., Inc., 4.00%-5.875%, due 5/1/28-9/15/33 | 1.2% |
| Yum! Brands, Inc., 3.625%-5.375%, due 1/15/30-4/1/32 | 1.2% |
| Talen Energy Supply LLC, 6.25%-8.625%, due 5/17/30-2/1/36 | 1.2% |
| Churchill Downs, Inc., 4.75%-6.75%, due 4/1/27-5/1/31 | 1.2% |
| Jane Street Group, 6.125%-7.125%, due 4/30/31-5/1/33 | 1.1% |
| LifePoint Health, Inc., 5.375%-11.00%, due 1/15/29-6/1/32 | 1.1% |
| Cloud Software Group, Inc., 6.50%-9.00%, due 3/31/29-8/15/33 | 1.0% |
| 1011778 B.C. Unlimited Liability Co., 3.875%-6.125%, due 1/15/28-10/15/30 | 0.9% |
| * Excluding short-term investments |
Portfolio Composition
| Corporate Bonds | 86.7% |
| Loan Assignments | 6.9% |
| Common Stocks | 0.9% |
| Convertible Bonds | 0.4% |
| Exchange-Traded Funds | 0.4% |
| Preferred Stock | 0.3% |
| Foreign Government Bond | 0.0%‡ |
| Convertible Preferred Stock | 0.0%‡ |
| Other Assets, Less Liabilities | 4.4% |
| ‡ Less than one-tenth of a percent. |
Top Ten Holdings and/or Issuers*
| TransDigm, Inc., 4.625%-7.125%, due 8/15/28-1/31/34 | 2.8% |
| CCO Holdings LLC, 4.25%-5.375%, due 5/1/27-1/15/34 | 1.9% |
| Hilton Domestic Operating Co., Inc., 4.00%-5.875%, due 5/1/28-9/15/33 | 1.2% |
| Yum! Brands, Inc., 3.625%-5.375%, due 1/15/30-4/1/32 | 1.2% |
| Talen Energy Supply LLC, 6.25%-8.625%, due 5/17/30-2/1/36 | 1.2% |
| Churchill Downs, Inc., 4.75%-6.75%, due 4/1/27-5/1/31 | 1.2% |
| Jane Street Group, 6.125%-7.125%, due 4/30/31-5/1/33 | 1.1% |
| LifePoint Health, Inc., 5.375%-11.00%, due 1/15/29-6/1/32 | 1.1% |
| Cloud Software Group, Inc., 6.50%-9.00%, due 3/31/29-8/15/33 | 1.0% |
| 1011778 B.C. Unlimited Liability Co., 3.875%-6.125%, due 1/15/28-10/15/30 | 0.9% |
| * Excluding short-term investments |
What were the Fund costs for the last year?
(Based on a hypothetical $10,000 investment)
| Share Class Name | Costs of a $10,000 investment | Costs paid as a percentage of a $10,000 investment |
| Class R6 | $59 | 0.57% |
What factors influenced Fund performance during the reporting period?
During the 12-month reporting period ended October 31, 2025, the Fund’s performance relative to the ICE BofA U.S. High Yield Constrained Index was affected by security selection and asset allocation. The strongest positive contributions to relative returns came from positions in utilities, capital goods and basic industries. The weakest relative performance came from positions in telecommunications, retail and media.
The following table outlines the key factors (securities, sectors, industries, market events and/or other characteristics) that materially affected the Fund’s performance during the reporting period.
| Key Factor | Summary | Impact |
| Utilities | Security selection (a position in Lightning Power Holdings and lack of exposure to Sunnova) | Contributed |
| Capital goods | Security selection (lack of exposure to Ardagh Packaging) and overweight exposure | Contributed |
| Basic industry | Security selection and overweight exposure (a position in First Quantum Minerals) | Contributed |
| Telecommunications | Security selection and underweight exposure (a position in Liberty Media Puerto Rico and underweight exposure to EchoStar) | Detracted |
| Retail | Security selection (a position in Saks) | Detracted |
| Media | Security selection (a position in OT Midco Inc.) and an underweight allocation (underweight Discovery Communications) | Detracted |
Fund Performance
The following graph compares the initial and subsequent account values at the end of each of the most recently completed 10 fiscal years of the Fund (or for the life of the Fund, if shorter). It assumes a $10,000 initial investment at the beginning of the first fiscal year in an appropriate, broad-based securities market index and other indexes, if applicable, for the same period and reflects the deduction of all sales charges, where applicable.

| Average Annual Total Returns for the Year Ended October 31, 2025 | Inception Date |
One Year |
Five Years |
Ten Years |
| Class R6 Shares | 6/17/2013 | 6.61% | 5.29% | 5.60% |
| Bloomberg U.S. Aggregate Bond Index1 | 6.16% | (0.24)% | 1.90% | |
| ICE BofA U.S. High Yield Constrained Index2 | 8.03% | 5.48% | 5.80% | |
| Morningstar High Yield Bond Category Average3 | 7.61% | 5.14% | 5.01% |
| 1. |
The Fund has selected the Bloomberg U.S. Aggregate Bond Index to represent a broad measure of market performance. The Bloomberg U.S. Aggregate Bond Index is a broad-based benchmark that measures the performance of the investment grade, U.S. dollar-denominated, fixed-rate taxable bond market, including Treasuries, government-related and corporate securities, mortgage-backed securities (agency fixed-rate and hybrid adjustable rate mortgage pass-throughs), asset-backed securities and commercial mortgage-backed securities. |
| 2. |
The ICE BofA U.S. High Yield Constrained Index, which is generally representative of the market sectors or types of investments in which the Fund invests, is a market value-weighted index of all domestic and Yankee high-yield bonds, including deferred interest bonds and payment-in-kind securities. Issuers included in the ICE BofA U.S. High Yield Constrained Index have maturities of one year or more and have a credit rating lower than BBB-/Baa3, but are not in default. No single issuer may constitute greater than 2% of the ICE BofA U.S. High Yield Constrained Index. |
| 3. |
The Morningstar High Yield Bond Category Average is representative of funds that concentrate on lower-quality bonds, which are riskier than those of higher-quality companies. These funds primarily invest in U.S. high-income debt securities where at least 65% or more of bond assets are not rated or are rated by a major agency such as Standard & Poor’s or Moody’s at the level of BB and below. Results are based on average total returns of similar funds with all dividends and capital gain distributions reinvested. |
Key Fund Statistics
| Fund's net assets | $11,167,394,534 |
| Total number of portfolio holdings | 625 |
| Total advisory fees paid | $60,991,221 |
| Portfolio turnover rate | 34% |
Graphical Representation of Holdings
The tables below show the investment makeup of the Fund; percentages indicated are based on the Fund's net assets.
Top Ten Holdings and/or Issuers*
| TransDigm, Inc., 4.625%-7.125%, due 8/15/28-1/31/34 | 2.8% |
| CCO Holdings LLC, 4.25%-5.375%, due 5/1/27-1/15/34 | 1.9% |
| Hilton Domestic Operating Co., Inc., 4.00%-5.875%, due 5/1/28-9/15/33 | 1.2% |
| Yum! Brands, Inc., 3.625%-5.375%, due 1/15/30-4/1/32 | 1.2% |
| Talen Energy Supply LLC, 6.25%-8.625%, due 5/17/30-2/1/36 | 1.2% |
| Churchill Downs, Inc., 4.75%-6.75%, due 4/1/27-5/1/31 | 1.2% |
| Jane Street Group, 6.125%-7.125%, due 4/30/31-5/1/33 | 1.1% |
| LifePoint Health, Inc., 5.375%-11.00%, due 1/15/29-6/1/32 | 1.1% |
| Cloud Software Group, Inc., 6.50%-9.00%, due 3/31/29-8/15/33 | 1.0% |
| 1011778 B.C. Unlimited Liability Co., 3.875%-6.125%, due 1/15/28-10/15/30 | 0.9% |
| * Excluding short-term investments |
Portfolio Composition
| Corporate Bonds | 86.7% |
| Loan Assignments | 6.9% |
| Common Stocks | 0.9% |
| Convertible Bonds | 0.4% |
| Exchange-Traded Funds | 0.4% |
| Preferred Stock | 0.3% |
| Foreign Government Bond | 0.0%‡ |
| Convertible Preferred Stock | 0.0%‡ |
| Other Assets, Less Liabilities | 4.4% |
| ‡ Less than one-tenth of a percent. |
Top Ten Holdings and/or Issuers*
| TransDigm, Inc., 4.625%-7.125%, due 8/15/28-1/31/34 | 2.8% |
| CCO Holdings LLC, 4.25%-5.375%, due 5/1/27-1/15/34 | 1.9% |
| Hilton Domestic Operating Co., Inc., 4.00%-5.875%, due 5/1/28-9/15/33 | 1.2% |
| Yum! Brands, Inc., 3.625%-5.375%, due 1/15/30-4/1/32 | 1.2% |
| Talen Energy Supply LLC, 6.25%-8.625%, due 5/17/30-2/1/36 | 1.2% |
| Churchill Downs, Inc., 4.75%-6.75%, due 4/1/27-5/1/31 | 1.2% |
| Jane Street Group, 6.125%-7.125%, due 4/30/31-5/1/33 | 1.1% |
| LifePoint Health, Inc., 5.375%-11.00%, due 1/15/29-6/1/32 | 1.1% |
| Cloud Software Group, Inc., 6.50%-9.00%, due 3/31/29-8/15/33 | 1.0% |
| 1011778 B.C. Unlimited Liability Co., 3.875%-6.125%, due 1/15/28-10/15/30 | 0.9% |
| * Excluding short-term investments |
What were the Fund costs for the last year?
(Based on a hypothetical $10,000 investment)
| Share Class Name | Costs of a $10,000 investment | Costs paid as a percentage of a $10,000 investment |
| Class R3 | $136 | 1.32% |
What factors influenced Fund performance during the reporting period?
During the 12-month reporting period ended October 31, 2025, the Fund’s performance relative to the ICE BofA U.S. High Yield Constrained Index was affected by security selection and asset allocation. The strongest positive contributions to relative returns came from positions in utilities, capital goods and basic industries. The weakest relative performance came from positions in telecommunications, retail and media.
The following table outlines the key factors (securities, sectors, industries, market events and/or other characteristics) that materially affected the Fund’s performance during the reporting period.
| Key Factor | Summary | Impact |
| Utilities | Security selection (a position in Lightning Power Holdings and lack of exposure to Sunnova) | Contributed |
| Capital goods | Security selection (lack of exposure to Ardagh Packaging) and overweight exposure | Contributed |
| Basic industry | Security selection and overweight exposure (a position in First Quantum Minerals) | Contributed |
| Telecommunications | Security selection and underweight exposure (a position in Liberty Media Puerto Rico and underweight exposure to EchoStar) | Detracted |
| Retail | Security selection (a position in Saks) | Detracted |
| Media | Security selection (a position in OT Midco Inc.) and an underweight allocation (underweight Discovery Communications) | Detracted |
Fund Performance
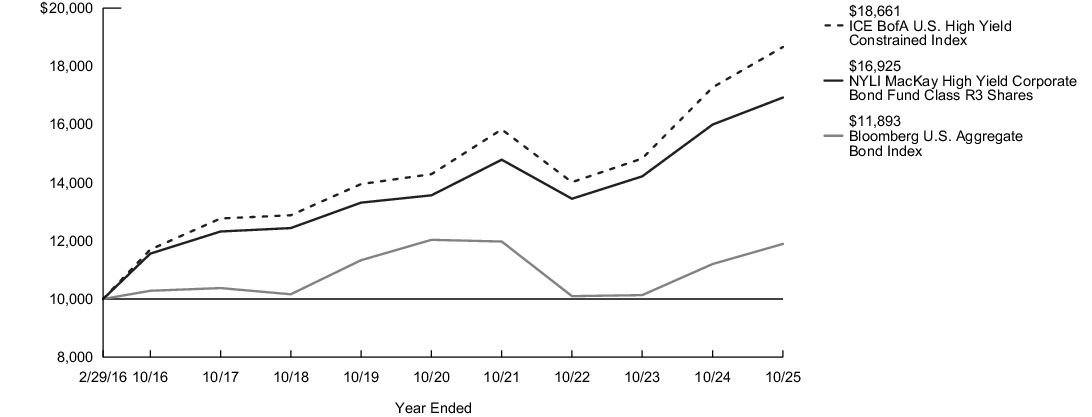
The following graph compares the initial and subsequent account values at the end of each of the most recently completed 10 fiscal years of the Fund (or for the life of the Fund, if shorter). It assumes a $10,000 initial investment at the beginning of the first fiscal year in an appropriate, broad-based securities market index and other indexes, if applicable, for the same period and reflects the deduction of all sales charges, where applicable.
| Average Annual Total Returns for the Year Ended October 31, 2025 | Inception Date |
One Year |
Five Years |
Since Inception |
| Class R3 Shares | 2/29/2016 | 5.81% | 4.53% | 5.59% |
| Bloomberg U.S. Aggregate Bond Index1 | 6.16% | (0.24)% | 1.81% | |
| ICE BofA U.S. High Yield Constrained Index2 | 8.03% | 5.48% | 6.67% | |
| Morningstar High Yield Bond Category Average3 | 7.61% | 5.14% | 5.55% |
| 1. |
The Fund has selected the Bloomberg U.S. Aggregate Bond Index to represent a broad measure of market performance. The Bloomberg U.S. Aggregate Bond Index is a broad-based benchmark that measures the performance of the investment grade, U.S. dollar-denominated, fixed-rate taxable bond market, including Treasuries, government-related and corporate securities, mortgage-backed securities (agency fixed-rate and hybrid adjustable rate mortgage pass-throughs), asset-backed securities and commercial mortgage-backed securities. |
| 2. |
The ICE BofA U.S. High Yield Constrained Index, which is generally representative of the market sectors or types of investments in which the Fund invests, is a market value-weighted index of all domestic and Yankee high-yield bonds, including deferred interest bonds and payment-in-kind securities. Issuers included in the ICE BofA U.S. High Yield Constrained Index have maturities of one year or more and have a credit rating lower than BBB-/Baa3, but are not in default. No single issuer may constitute greater than 2% of the ICE BofA U.S. High Yield Constrained Index. |
| 3. |
The Morningstar High Yield Bond Category Average is representative of funds that concentrate on lower-quality bonds, which are riskier than those of higher-quality companies. These funds primarily invest in U.S. high-income debt securities where at least 65% or more of bond assets are not rated or are rated by a major agency such as Standard & Poor’s or Moody’s at the level of BB and below. Results are based on average total returns of similar funds with all dividends and capital gain distributions reinvested. |
Key Fund Statistics
| Fund's net assets | $11,167,394,534 |
| Total number of portfolio holdings | 625 |
| Total advisory fees paid | $60,991,221 |
| Portfolio turnover rate | 34% |
Graphical Representation of Holdings
The tables below show the investment makeup of the Fund; percentages indicated are based on the Fund's net assets.
Top Ten Holdings and/or Issuers*
| TransDigm, Inc., 4.625%-7.125%, due 8/15/28-1/31/34 | 2.8% |
| CCO Holdings LLC, 4.25%-5.375%, due 5/1/27-1/15/34 | 1.9% |
| Hilton Domestic Operating Co., Inc., 4.00%-5.875%, due 5/1/28-9/15/33 | 1.2% |
| Yum! Brands, Inc., 3.625%-5.375%, due 1/15/30-4/1/32 | 1.2% |
| Talen Energy Supply LLC, 6.25%-8.625%, due 5/17/30-2/1/36 | 1.2% |
| Churchill Downs, Inc., 4.75%-6.75%, due 4/1/27-5/1/31 | 1.2% |
| Jane Street Group, 6.125%-7.125%, due 4/30/31-5/1/33 | 1.1% |
| LifePoint Health, Inc., 5.375%-11.00%, due 1/15/29-6/1/32 | 1.1% |
| Cloud Software Group, Inc., 6.50%-9.00%, due 3/31/29-8/15/33 | 1.0% |
| 1011778 B.C. Unlimited Liability Co., 3.875%-6.125%, due 1/15/28-10/15/30 | 0.9% |
| * Excluding short-term investments |
Portfolio Composition
| Corporate Bonds | 86.7% |
| Loan Assignments | 6.9% |
| Common Stocks | 0.9% |
| Convertible Bonds | 0.4% |
| Exchange-Traded Funds | 0.4% |
| Preferred Stock | 0.3% |
| Foreign Government Bond | 0.0%‡ |
| Convertible Preferred Stock | 0.0%‡ |
| Other Assets, Less Liabilities | 4.4% |
| ‡ Less than one-tenth of a percent. |
Top Ten Holdings and/or Issuers*
| TransDigm, Inc., 4.625%-7.125%, due 8/15/28-1/31/34 | 2.8% |
| CCO Holdings LLC, 4.25%-5.375%, due 5/1/27-1/15/34 | 1.9% |
| Hilton Domestic Operating Co., Inc., 4.00%-5.875%, due 5/1/28-9/15/33 | 1.2% |
| Yum! Brands, Inc., 3.625%-5.375%, due 1/15/30-4/1/32 | 1.2% |
| Talen Energy Supply LLC, 6.25%-8.625%, due 5/17/30-2/1/36 | 1.2% |
| Churchill Downs, Inc., 4.75%-6.75%, due 4/1/27-5/1/31 | 1.2% |
| Jane Street Group, 6.125%-7.125%, due 4/30/31-5/1/33 | 1.1% |
| LifePoint Health, Inc., 5.375%-11.00%, due 1/15/29-6/1/32 | 1.1% |
| Cloud Software Group, Inc., 6.50%-9.00%, due 3/31/29-8/15/33 | 1.0% |
| 1011778 B.C. Unlimited Liability Co., 3.875%-6.125%, due 1/15/28-10/15/30 | 0.9% |
| * Excluding short-term investments |
What were the Fund costs for the last year?
(Based on a hypothetical $10,000 investment)
| Share Class Name | Costs of a $10,000 investment | Costs paid as a percentage of a $10,000 investment |
| Class R2 | $110 | 1.07% |
What factors influenced Fund performance during the reporting period?
During the 12-month reporting period ended October 31, 2025, the Fund’s performance relative to the ICE BofA U.S. High Yield Constrained Index was affected by security selection and asset allocation. The strongest positive contributions to relative returns came from positions in utilities, capital goods and basic industries. The weakest relative performance came from positions in telecommunications, retail and media.
The following table outlines the key factors (securities, sectors, industries, market events and/or other characteristics) that materially affected the Fund’s performance during the reporting period.
| Key Factor | Summary | Impact |
| Utilities | Security selection (a position in Lightning Power Holdings and lack of exposure to Sunnova) | Contributed |
| Capital goods | Security selection (lack of exposure to Ardagh Packaging) and overweight exposure | Contributed |
| Basic industry | Security selection and overweight exposure (a position in First Quantum Minerals) | Contributed |
| Telecommunications | Security selection and underweight exposure (a position in Liberty Media Puerto Rico and underweight exposure to EchoStar) | Detracted |
| Retail | Security selection (a position in Saks) | Detracted |
| Media | Security selection (a position in OT Midco Inc.) and an underweight allocation (underweight Discovery Communications) | Detracted |
Fund Performance
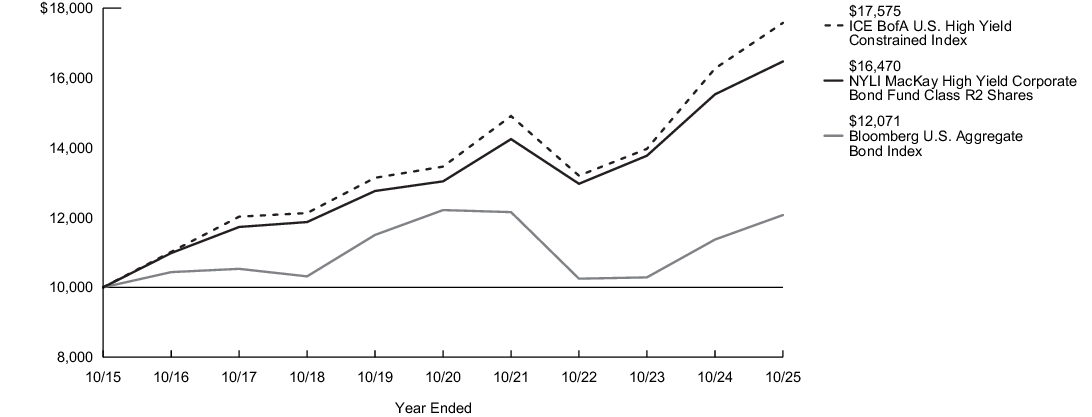
The following graph compares the initial and subsequent account values at the end of each of the most recently completed 10 fiscal years of the Fund (or for the life of the Fund, if shorter). It assumes a $10,000 initial investment at the beginning of the first fiscal year in an appropriate, broad-based securities market index and other indexes, if applicable, for the same period and reflects the deduction of all sales charges, where applicable.
| Average Annual Total Returns for the Year Ended October 31, 2025 | Inception Date |
One Year |
Five Years |
Ten Years |
| Class R2 Shares | 5/1/2008 | 6.06% | 4.79% | 5.12% |
| Bloomberg U.S. Aggregate Bond Index1 | 6.16% | (0.24)% | 1.90% | |
| ICE BofA U.S. High Yield Constrained Index2 | 8.03% | 5.48% | 5.80% | |
| Morningstar High Yield Bond Category Average3 | 7.61% | 5.14% | 5.01% |
| 1. |
The Fund has selected the Bloomberg U.S. Aggregate Bond Index to represent a broad measure of market performance. The Bloomberg U.S. Aggregate Bond Index is a broad-based benchmark that measures the performance of the investment grade, U.S. dollar-denominated, fixed-rate taxable bond market, including Treasuries, government-related and corporate securities, mortgage-backed securities (agency fixed-rate and hybrid adjustable rate mortgage pass-throughs), asset-backed securities and commercial mortgage-backed securities. |
| 2. |
The ICE BofA U.S. High Yield Constrained Index, which is generally representative of the market sectors or types of investments in which the Fund invests, is a market value-weighted index of all domestic and Yankee high-yield bonds, including deferred interest bonds and payment-in-kind securities. Issuers included in the ICE BofA U.S. High Yield Constrained Index have maturities of one year or more and have a credit rating lower than BBB-/Baa3, but are not in default. No single issuer may constitute greater than 2% of the ICE BofA U.S. High Yield Constrained Index. |
| 3. |
The Morningstar High Yield Bond Category Average is representative of funds that concentrate on lower-quality bonds, which are riskier than those of higher-quality companies. These funds primarily invest in U.S. high-income debt securities where at least 65% or more of bond assets are not rated or are rated by a major agency such as Standard & Poor’s or Moody’s at the level of BB and below. Results are based on average total returns of similar funds with all dividends and capital gain distributions reinvested. |
Key Fund Statistics
| Fund's net assets | $11,167,394,534 |
| Total number of portfolio holdings | 625 |
| Total advisory fees paid | $60,991,221 |
| Portfolio turnover rate | 34% |
Graphical Representation of Holdings
The tables below show the investment makeup of the Fund; percentages indicated are based on the Fund's net assets.
Top Ten Holdings and/or Issuers*
| TransDigm, Inc., 4.625%-7.125%, due 8/15/28-1/31/34 | 2.8% |
| CCO Holdings LLC, 4.25%-5.375%, due 5/1/27-1/15/34 | 1.9% |
| Hilton Domestic Operating Co., Inc., 4.00%-5.875%, due 5/1/28-9/15/33 | 1.2% |
| Yum! Brands, Inc., 3.625%-5.375%, due 1/15/30-4/1/32 | 1.2% |
| Talen Energy Supply LLC, 6.25%-8.625%, due 5/17/30-2/1/36 | 1.2% |
| Churchill Downs, Inc., 4.75%-6.75%, due 4/1/27-5/1/31 | 1.2% |
| Jane Street Group, 6.125%-7.125%, due 4/30/31-5/1/33 | 1.1% |
| LifePoint Health, Inc., 5.375%-11.00%, due 1/15/29-6/1/32 | 1.1% |
| Cloud Software Group, Inc., 6.50%-9.00%, due 3/31/29-8/15/33 | 1.0% |
| 1011778 B.C. Unlimited Liability Co., 3.875%-6.125%, due 1/15/28-10/15/30 | 0.9% |
| * Excluding short-term investments |
Portfolio Composition
| Corporate Bonds | 86.7% |
| Loan Assignments | 6.9% |
| Common Stocks | 0.9% |
| Convertible Bonds | 0.4% |
| Exchange-Traded Funds | 0.4% |
| Preferred Stock | 0.3% |
| Foreign Government Bond | 0.0%‡ |
| Convertible Preferred Stock | 0.0%‡ |
| Other Assets, Less Liabilities | 4.4% |
| ‡ Less than one-tenth of a percent. |
Top Ten Holdings and/or Issuers*
| TransDigm, Inc., 4.625%-7.125%, due 8/15/28-1/31/34 | 2.8% |
| CCO Holdings LLC, 4.25%-5.375%, due 5/1/27-1/15/34 | 1.9% |
| Hilton Domestic Operating Co., Inc., 4.00%-5.875%, due 5/1/28-9/15/33 | 1.2% |
| Yum! Brands, Inc., 3.625%-5.375%, due 1/15/30-4/1/32 | 1.2% |
| Talen Energy Supply LLC, 6.25%-8.625%, due 5/17/30-2/1/36 | 1.2% |
| Churchill Downs, Inc., 4.75%-6.75%, due 4/1/27-5/1/31 | 1.2% |
| Jane Street Group, 6.125%-7.125%, due 4/30/31-5/1/33 | 1.1% |
| LifePoint Health, Inc., 5.375%-11.00%, due 1/15/29-6/1/32 | 1.1% |
| Cloud Software Group, Inc., 6.50%-9.00%, due 3/31/29-8/15/33 | 1.0% |
| 1011778 B.C. Unlimited Liability Co., 3.875%-6.125%, due 1/15/28-10/15/30 | 0.9% |
| * Excluding short-term investments |
What were the Fund costs for the last year?
(Based on a hypothetical $10,000 investment)
| Share Class Name | Costs of a $10,000 investment | Costs paid as a percentage of a $10,000 investment |
| Class I | $74 | 0.72% |
What factors influenced Fund performance during the reporting period?
During the 12-month reporting period ended October 31, 2025, the Fund’s performance relative to the ICE BofA U.S. High Yield Constrained Index was affected by security selection and asset allocation. The strongest positive contributions to relative returns came from positions in utilities, capital goods and basic industries. The weakest relative performance came from positions in telecommunications, retail and media.
The following table outlines the key factors (securities, sectors, industries, market events and/or other characteristics) that materially affected the Fund’s performance during the reporting period.
| Key Factor | Summary | Impact |
| Utilities | Security selection (a position in Lightning Power Holdings and lack of exposure to Sunnova) | Contributed |
| Capital goods | Security selection (lack of exposure to Ardagh Packaging) and overweight exposure | Contributed |
| Basic industry | Security selection and overweight exposure (a position in First Quantum Minerals) | Contributed |
| Telecommunications | Security selection and underweight exposure (a position in Liberty Media Puerto Rico and underweight exposure to EchoStar) | Detracted |
| Retail | Security selection (a position in Saks) | Detracted |
| Media | Security selection (a position in OT Midco Inc.) and an underweight allocation (underweight Discovery Communications) | Detracted |
Fund Performance
The following graph compares the initial and subsequent account values at the end of each of the most recently completed 10 fiscal years of the Fund (or for the life of the Fund, if shorter). It assumes a $10,000 initial investment at the beginning of the first fiscal year in an appropriate, broad-based securities market index and other indexes, if applicable, for the same period and reflects the deduction of all sales charges, where applicable.

| Average Annual Total Returns for the Year Ended October 31, 2025 | Inception Date |
One Year |
Five Years |
Ten Years |
| Class I Shares | 1/2/2004 | 6.43% | 5.15% | 5.47% |
| Bloomberg U.S. Aggregate Bond Index1 | 6.16% | (0.24)% | 1.90% | |
| ICE BofA U.S. High Yield Constrained Index2 | 8.03% | 5.48% | 5.80% | |
| Morningstar High Yield Bond Category Average3 | 7.61% | 5.14% | 5.01% |
| 1. |
The Fund has selected the Bloomberg U.S. Aggregate Bond Index to represent a broad measure of market performance. The Bloomberg U.S. Aggregate Bond Index is a broad-based benchmark that measures the performance of the investment grade, U.S. dollar-denominated, fixed-rate taxable bond market, including Treasuries, government-related and corporate securities, mortgage-backed securities (agency fixed-rate and hybrid adjustable rate mortgage pass-throughs), asset-backed securities and commercial mortgage-backed securities. |
| 2. |
The ICE BofA U.S. High Yield Constrained Index, which is generally representative of the market sectors or types of investments in which the Fund invests, is a market value-weighted index of all domestic and Yankee high-yield bonds, including deferred interest bonds and payment-in-kind securities. Issuers included in the ICE BofA U.S. High Yield Constrained Index have maturities of one year or more and have a credit rating lower than BBB-/Baa3, but are not in default. No single issuer may constitute greater than 2% of the ICE BofA U.S. High Yield Constrained Index. |
| 3. |
The Morningstar High Yield Bond Category Average is representative of funds that concentrate on lower-quality bonds, which are riskier than those of higher-quality companies. These funds primarily invest in U.S. high-income debt securities where at least 65% or more of bond assets are not rated or are rated by a major agency such as Standard & Poor’s or Moody’s at the level of BB and below. Results are based on average total returns of similar funds with all dividends and capital gain distributions reinvested. |
Key Fund Statistics
| Fund's net assets | $11,167,394,534 |
| Total number of portfolio holdings | 625 |
| Total advisory fees paid | $60,991,221 |
| Portfolio turnover rate | 34% |
Graphical Representation of Holdings
The tables below show the investment makeup of the Fund; percentages indicated are based on the Fund's net assets.
Top Ten Holdings and/or Issuers*
| TransDigm, Inc., 4.625%-7.125%, due 8/15/28-1/31/34 | 2.8% |
| CCO Holdings LLC, 4.25%-5.375%, due 5/1/27-1/15/34 | 1.9% |
| Hilton Domestic Operating Co., Inc., 4.00%-5.875%, due 5/1/28-9/15/33 | 1.2% |
| Yum! Brands, Inc., 3.625%-5.375%, due 1/15/30-4/1/32 | 1.2% |
| Talen Energy Supply LLC, 6.25%-8.625%, due 5/17/30-2/1/36 | 1.2% |
| Churchill Downs, Inc., 4.75%-6.75%, due 4/1/27-5/1/31 | 1.2% |
| Jane Street Group, 6.125%-7.125%, due 4/30/31-5/1/33 | 1.1% |
| LifePoint Health, Inc., 5.375%-11.00%, due 1/15/29-6/1/32 | 1.1% |
| Cloud Software Group, Inc., 6.50%-9.00%, due 3/31/29-8/15/33 | 1.0% |
| 1011778 B.C. Unlimited Liability Co., 3.875%-6.125%, due 1/15/28-10/15/30 | 0.9% |
| * Excluding short-term investments |
Portfolio Composition
| Corporate Bonds | 86.7% |
| Loan Assignments | 6.9% |
| Common Stocks | 0.9% |
| Convertible Bonds | 0.4% |
| Exchange-Traded Funds | 0.4% |
| Preferred Stock | 0.3% |
| Foreign Government Bond | 0.0%‡ |
| Convertible Preferred Stock | 0.0%‡ |
| Other Assets, Less Liabilities | 4.4% |
| ‡ Less than one-tenth of a percent. |
Top Ten Holdings and/or Issuers*
| TransDigm, Inc., 4.625%-7.125%, due 8/15/28-1/31/34 | 2.8% |
| CCO Holdings LLC, 4.25%-5.375%, due 5/1/27-1/15/34 | 1.9% |
| Hilton Domestic Operating Co., Inc., 4.00%-5.875%, due 5/1/28-9/15/33 | 1.2% |
| Yum! Brands, Inc., 3.625%-5.375%, due 1/15/30-4/1/32 | 1.2% |
| Talen Energy Supply LLC, 6.25%-8.625%, due 5/17/30-2/1/36 | 1.2% |
| Churchill Downs, Inc., 4.75%-6.75%, due 4/1/27-5/1/31 | 1.2% |
| Jane Street Group, 6.125%-7.125%, due 4/30/31-5/1/33 | 1.1% |
| LifePoint Health, Inc., 5.375%-11.00%, due 1/15/29-6/1/32 | 1.1% |
| Cloud Software Group, Inc., 6.50%-9.00%, due 3/31/29-8/15/33 | 1.0% |
| 1011778 B.C. Unlimited Liability Co., 3.875%-6.125%, due 1/15/28-10/15/30 | 0.9% |
| * Excluding short-term investments |
What were the Fund costs for the last year?
(Based on a hypothetical $10,000 investment)
| Share Class Name | Costs of a $10,000 investment | Costs paid as a percentage of a $10,000 investment |
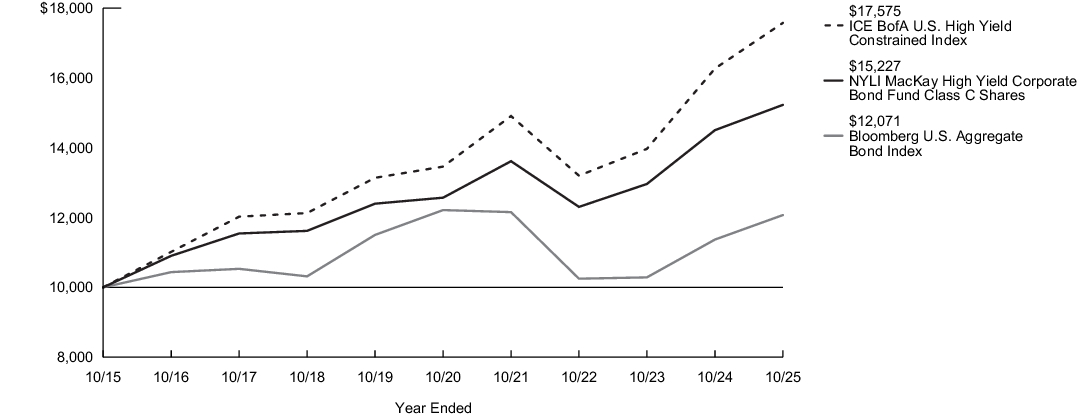
| Class C | $195 | 1.91% |
What factors influenced Fund performance during the reporting period?
During the 12-month reporting period ended October 31, 2025, the Fund’s performance relative to the ICE BofA U.S. High Yield Constrained Index was affected by security selection and asset allocation. The strongest positive contributions to relative returns came from positions in utilities, capital goods and basic industries. The weakest relative performance came from positions in telecommunications, retail and media.
The following table outlines the key factors (securities, sectors, industries, market events and/or other characteristics) that materially affected the Fund’s performance during the reporting period.
| Key Factor | Summary | Impact |
| Utilities | Security selection (a position in Lightning Power Holdings and lack of exposure to Sunnova) | Contributed |
| Capital goods | Security selection (lack of exposure to Ardagh Packaging) and overweight exposure | Contributed |
| Basic industry | Security selection and overweight exposure (a position in First Quantum Minerals) | Contributed |
| Telecommunications | Security selection and underweight exposure (a position in Liberty Media Puerto Rico and underweight exposure to EchoStar) | Detracted |
| Retail | Security selection (a position in Saks) | Detracted |
| Media | Security selection (a position in OT Midco Inc.) and an underweight allocation (underweight Discovery Communications) | Detracted |
Fund Performance
The following graph compares the initial and subsequent account values at the end of each of the most recently completed 10 fiscal years of the Fund (or for the life of the Fund, if shorter). It assumes a $10,000 initial investment at the beginning of the first fiscal year in an appropriate, broad-based securities market index and other indexes, if applicable, for the same period and reflects the deduction of all sales charges, where applicable.
| Average Annual Total Returns for the Year Ended October 31, 2025 | Inception Date |
One Year |
Five Years |
Ten Years |
| Class C Shares - Including sales charges | 9/1/1998 | 4.00% | 3.91% | 4.29% |
| Class C Shares - Excluding sales charges | 4.99% | 3.91% | 4.29% | |
| Bloomberg U.S. Aggregate Bond Index1 | 6.16% | (0.24)% | 1.90% | |
| ICE BofA U.S. High Yield Constrained Index2 | 8.03% | 5.48% | 5.80% | |
| Morningstar High Yield Bond Category Average3 | 7.61% | 5.14% | 5.01% |
| 1. |
The Fund has selected the Bloomberg U.S. Aggregate Bond Index to represent a broad measure of market performance. The Bloomberg U.S. Aggregate Bond Index is a broad-based benchmark that measures the performance of the investment grade, U.S. dollar-denominated, fixed-rate taxable bond market, including Treasuries, government-related and corporate securities, mortgage-backed securities (agency fixed-rate and hybrid adjustable rate mortgage pass-throughs), asset-backed securities and commercial mortgage-backed securities. |
| 2. |
The ICE BofA U.S. High Yield Constrained Index, which is generally representative of the market sectors or types of investments in which the Fund invests, is a market value-weighted index of all domestic and Yankee high-yield bonds, including deferred interest bonds and payment-in-kind securities. Issuers included in the ICE BofA U.S. High Yield Constrained Index have maturities of one year or more and have a credit rating lower than BBB-/Baa3, but are not in default. No single issuer may constitute greater than 2% of the ICE BofA U.S. High Yield Constrained Index. |
| 3. |
The Morningstar High Yield Bond Category Average is representative of funds that concentrate on lower-quality bonds, which are riskier than those of higher-quality companies. These funds primarily invest in U.S. high-income debt securities where at least 65% or more of bond assets are not rated or are rated by a major agency such as Standard & Poor’s or Moody’s at the level of BB and below. Results are based on average total returns of similar funds with all dividends and capital gain distributions reinvested. |
Key Fund Statistics
| Fund's net assets | $11,167,394,534 |
| Total number of portfolio holdings | 625 |
| Total advisory fees paid | $60,991,221 |
| Portfolio turnover rate | 34% |
Graphical Representation of Holdings
The tables below show the investment makeup of the Fund; percentages indicated are based on the Fund's net assets.
Top Ten Holdings and/or Issuers*
| TransDigm, Inc., 4.625%-7.125%, due 8/15/28-1/31/34 | 2.8% |
| CCO Holdings LLC, 4.25%-5.375%, due 5/1/27-1/15/34 | 1.9% |
| Hilton Domestic Operating Co., Inc., 4.00%-5.875%, due 5/1/28-9/15/33 | 1.2% |
| Yum! Brands, Inc., 3.625%-5.375%, due 1/15/30-4/1/32 | 1.2% |
| Talen Energy Supply LLC, 6.25%-8.625%, due 5/17/30-2/1/36 | 1.2% |
| Churchill Downs, Inc., 4.75%-6.75%, due 4/1/27-5/1/31 | 1.2% |
| Jane Street Group, 6.125%-7.125%, due 4/30/31-5/1/33 | 1.1% |
| LifePoint Health, Inc., 5.375%-11.00%, due 1/15/29-6/1/32 | 1.1% |
| Cloud Software Group, Inc., 6.50%-9.00%, due 3/31/29-8/15/33 | 1.0% |
| 1011778 B.C. Unlimited Liability Co., 3.875%-6.125%, due 1/15/28-10/15/30 | 0.9% |
| * Excluding short-term investments |
Portfolio Composition
| Corporate Bonds | 86.7% |
| Loan Assignments | 6.9% |
| Common Stocks | 0.9% |
| Convertible Bonds | 0.4% |
| Exchange-Traded Funds | 0.4% |
| Preferred Stock | 0.3% |
| Foreign Government Bond | 0.0%‡ |
| Convertible Preferred Stock | 0.0%‡ |
| Other Assets, Less Liabilities | 4.4% |
| ‡ Less than one-tenth of a percent. |
Top Ten Holdings and/or Issuers*
| TransDigm, Inc., 4.625%-7.125%, due 8/15/28-1/31/34 | 2.8% |
| CCO Holdings LLC, 4.25%-5.375%, due 5/1/27-1/15/34 | 1.9% |
| Hilton Domestic Operating Co., Inc., 4.00%-5.875%, due 5/1/28-9/15/33 | 1.2% |
| Yum! Brands, Inc., 3.625%-5.375%, due 1/15/30-4/1/32 | 1.2% |
| Talen Energy Supply LLC, 6.25%-8.625%, due 5/17/30-2/1/36 | 1.2% |
| Churchill Downs, Inc., 4.75%-6.75%, due 4/1/27-5/1/31 | 1.2% |
| Jane Street Group, 6.125%-7.125%, due 4/30/31-5/1/33 | 1.1% |
| LifePoint Health, Inc., 5.375%-11.00%, due 1/15/29-6/1/32 | 1.1% |
| Cloud Software Group, Inc., 6.50%-9.00%, due 3/31/29-8/15/33 | 1.0% |
| 1011778 B.C. Unlimited Liability Co., 3.875%-6.125%, due 1/15/28-10/15/30 | 0.9% |
| * Excluding short-term investments |
What were the Fund costs for the last year?
(Based on a hypothetical $10,000 investment)
| Share Class Name | Costs of a $10,000 investment | Costs paid as a percentage of a $10,000 investment |
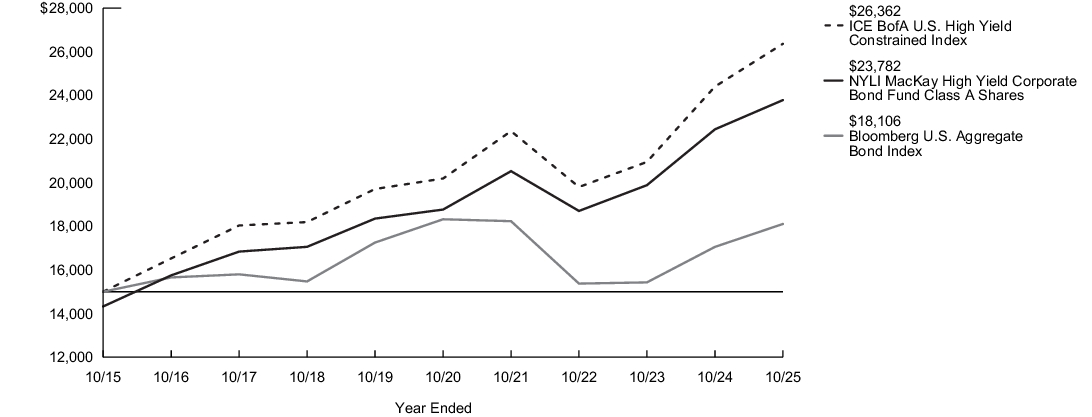
| Class A | $100 | 0.97% |
What factors influenced Fund performance during the reporting period?
During the 12-month reporting period ended October 31, 2025, the Fund’s performance relative to the ICE BofA U.S. High Yield Constrained Index was affected by security selection and asset allocation. The strongest positive contributions to relative returns came from positions in utilities, capital goods and basic industries. The weakest relative performance came from positions in telecommunications, retail and media.
The following table outlines the key factors (securities, sectors, industries, market events and/or other characteristics) that materially affected the Fund’s performance during the reporting period.
| Key Factor | Summary | Impact |
| Utilities | Security selection (a position in Lightning Power Holdings and lack of exposure to Sunnova) | Contributed |
| Capital goods | Security selection (lack of exposure to Ardagh Packaging) and overweight exposure | Contributed |
| Basic industry | Security selection and overweight exposure (a position in First Quantum Minerals) | Contributed |
| Telecommunications | Security selection and underweight exposure (a position in Liberty Media Puerto Rico and underweight exposure to EchoStar) | Detracted |
| Retail | Security selection (a position in Saks) | Detracted |
| Media | Security selection (a position in OT Midco Inc.) and an underweight allocation (underweight Discovery Communications) | Detracted |
Fund Performance
The following graph compares the initial and subsequent account values at the end of each of the most recently completed 10 fiscal years of the Fund (or for the life of the Fund, if shorter). It assumes a $15,000 initial investment at the beginning of the first fiscal year in an appropriate, broad-based securities market index and other indexes, if applicable, for the same period and reflects the deduction of all sales charges, where applicable.
| Average Annual Total Returns for the Year Ended October 31, 2025 | Inception Date |
One Year |
Five Years |
Ten Years |
| Class A Shares - Including sales charges | 1/3/1995 | 1.20% | 3.89% | 4.72% |
| Class A Shares - Excluding sales charges | 5.96% | 4.85% | 5.20% | |
| Bloomberg U.S. Aggregate Bond Index1 | 6.16% | (0.24)% | 1.90% | |
| ICE BofA U.S. High Yield Constrained Index2 | 8.03% | 5.48% | 5.80% | |
| Morningstar High Yield Bond Category Average3 | 7.61% | 5.14% | 5.01% |
| 1. |
The Fund has selected the Bloomberg U.S. Aggregate Bond Index to represent a broad measure of market performance. The Bloomberg U.S. Aggregate Bond Index is a broad-based benchmark that measures the performance of the investment grade, U.S. dollar-denominated, fixed-rate taxable bond market, including Treasuries, government-related and corporate securities, mortgage-backed securities (agency fixed-rate and hybrid adjustable rate mortgage pass-throughs), asset-backed securities and commercial mortgage-backed securities. |
| 2. |
The ICE BofA U.S. High Yield Constrained Index, which is generally representative of the market sectors or types of investments in which the Fund invests, is a market value-weighted index of all domestic and Yankee high-yield bonds, including deferred interest bonds and payment-in-kind securities. Issuers included in the ICE BofA U.S. High Yield Constrained Index have maturities of one year or more and have a credit rating lower than BBB-/Baa3, but are not in default. No single issuer may constitute greater than 2% of the ICE BofA U.S. High Yield Constrained Index. |
| 3. |
The Morningstar High Yield Bond Category Average is representative of funds that concentrate on lower-quality bonds, which are riskier than those of higher-quality companies. These funds primarily invest in U.S. high-income debt securities where at least 65% or more of bond assets are not rated or are rated by a major agency such as Standard & Poor’s or Moody’s at the level of BB and below. Results are based on average total returns of similar funds with all dividends and capital gain distributions reinvested. |
Key Fund Statistics
| Fund's net assets | $11,167,394,534 |
| Total number of portfolio holdings | 625 |
| Total advisory fees paid | $60,991,221 |
| Portfolio turnover rate | 34% |
Graphical Representation of Holdings
The tables below show the investment makeup of the Fund; percentages indicated are based on the Fund's net assets.
Top Ten Holdings and/or Issuers*
| TransDigm, Inc., 4.625%-7.125%, due 8/15/28-1/31/34 | 2.8% |
| CCO Holdings LLC, 4.25%-5.375%, due 5/1/27-1/15/34 | 1.9% |
| Hilton Domestic Operating Co., Inc., 4.00%-5.875%, due 5/1/28-9/15/33 | 1.2% |
| Yum! Brands, Inc., 3.625%-5.375%, due 1/15/30-4/1/32 | 1.2% |
| Talen Energy Supply LLC, 6.25%-8.625%, due 5/17/30-2/1/36 | 1.2% |
| Churchill Downs, Inc., 4.75%-6.75%, due 4/1/27-5/1/31 | 1.2% |
| Jane Street Group, 6.125%-7.125%, due 4/30/31-5/1/33 | 1.1% |
| LifePoint Health, Inc., 5.375%-11.00%, due 1/15/29-6/1/32 | 1.1% |
| Cloud Software Group, Inc., 6.50%-9.00%, due 3/31/29-8/15/33 | 1.0% |
| 1011778 B.C. Unlimited Liability Co., 3.875%-6.125%, due 1/15/28-10/15/30 | 0.9% |
| * Excluding short-term investments |
Portfolio Composition
| Corporate Bonds | 86.7% |
| Loan Assignments | 6.9% |
| Common Stocks | 0.9% |
| Convertible Bonds | 0.4% |
| Exchange-Traded Funds | 0.4% |
| Preferred Stock | 0.3% |
| Foreign Government Bond | 0.0%‡ |
| Convertible Preferred Stock | 0.0%‡ |
| Other Assets, Less Liabilities | 4.4% |
| ‡ Less than one-tenth of a percent. |
Top Ten Holdings and/or Issuers*
| TransDigm, Inc., 4.625%-7.125%, due 8/15/28-1/31/34 | 2.8% |
| CCO Holdings LLC, 4.25%-5.375%, due 5/1/27-1/15/34 | 1.9% |
| Hilton Domestic Operating Co., Inc., 4.00%-5.875%, due 5/1/28-9/15/33 | 1.2% |
| Yum! Brands, Inc., 3.625%-5.375%, due 1/15/30-4/1/32 | 1.2% |
| Talen Energy Supply LLC, 6.25%-8.625%, due 5/17/30-2/1/36 | 1.2% |
| Churchill Downs, Inc., 4.75%-6.75%, due 4/1/27-5/1/31 | 1.2% |
| Jane Street Group, 6.125%-7.125%, due 4/30/31-5/1/33 | 1.1% |
| LifePoint Health, Inc., 5.375%-11.00%, due 1/15/29-6/1/32 | 1.1% |
| Cloud Software Group, Inc., 6.50%-9.00%, due 3/31/29-8/15/33 | 1.0% |
| 1011778 B.C. Unlimited Liability Co., 3.875%-6.125%, due 1/15/28-10/15/30 | 0.9% |
| * Excluding short-term investments |