Pay vs Performance Disclosure - USD ($)
Mar. 10, 2025
Dec. 31, 2023
Jun. 14, 2024
Dec. 31, 2025
Nov. 06, 2023
Dec. 31, 2025
Dec. 31, 2024
Dec. 31, 2023
Dec. 31, 2022
Dec. 31, 2021
Dec. 29, 2023
Dec. 30, 2022
Dec. 31, 2020
Pay Versus Performance
As required by Section 953(a) of the Dodd-Frank Wall Street Reform and Consumer Protection Act, and Item 402(v) of Regulation S-K, we are providing the following information about the relationship between executive compensation actually paid and certain financial performance metrics of the Company. For further information concerning how the Company aligns executive compensation with the Company’s performance, refer to the section entitled “Compensation Discussion and Analysis.”
In 2025, we had two PEOs, Mr. Nielsen (“First PEO”), who served as President and PEO from June 14, 2024 through March 10, 2025, and Mr. Lemonis (“Second PEO” in 2025), our then Executive Chairman, who began serving as PEO on March 10, 2025. In 2024, we had two PEOs, Mr. Nielsen (“First PEO”), who served as our PEO until February 20, 2024, our Division CEO of Overstock and co-PEO from February 20, 2024 through June 14, 2024, and our President and PEO from June 14, 2024 through March 10, 2025, and Ms. Holt (“Second PEO” in 2024), who served as our Division CEO of Bed Bath & Beyond and co-PEO from February 20, 2024 through June 14, 2024. In 2023, we had two PEOs, Mr. Nielsen (“First PEO”), our then Interim CEO, and Mr. Johnson (“Second PEO” in 2023, 2022, and 2021), our former CEO. The following Pay Versus Performance Table sets forth information concerning the compensation of our PEOs and other non-PEO NEOs for each of the fiscal years (“FY”) ending December 31, 2021, 2022, 2023, 2024, and 2025 and our financial performance for each such fiscal year.
Pay Versus Performance Table
Year | Summary Compensation Table Total | Compensation Actually Paid | Average Summary Compensation Table Total for Non-PEO Named Executive Officers ($) (1) | Average Compensation Actually Paid to Non-PEO Named Executive Officers ($) (2) | Value of Initial Fixed $100 Investment Based on: | Net Income (loss) (thousands) | Adjusted EBITDA (thousands) (5) | |||||||||||||||||||||||||
for First PEO ($) (1) | for Second PEO ($) (1) | to First PEO ($) (2) | to Second PEO ($) (2) | Total Shareholder Return ($) (3) | Peer Group Total Shareholder Return ($) (4) | |||||||||||||||||||||||||||
2025 | $2,545,979 | $5,928,963 | $1,362,133 | $4,709,178 | $1,269,338 | $1,011,883 | $11.38 | $143.95 | ($84,621) | ($30,688) | ||||||||||||||||||||||
2024 | $4,558,064 | $5,110,167 | $102,781 | $613,667 | $3,834,103 | $170,723 | $10.27 | $133.04 | ($258,795) | ($143,983) | ||||||||||||||||||||||
2023 | $2,026,272 | $6,141,284 | $2,568,391 | $4,219,767 | $1,226,098 | $1,308,216 | $57.71 | $118.65 | ($307,842) | ($61,293) | ||||||||||||||||||||||
2022 | — | $2,948,959 | — | $265,216 | $1,104,506 | $138,218 | $40.35 | $97.63 | ($35,236) | $63,485 | ||||||||||||||||||||||
2021 | — | $2,855,412 | — | $3,904,925 | $1,199,845 | $1,647,994 | $123.01 | $142.97 | $389,372 | $141,640 | ||||||||||||||||||||||
(1) | Amounts represent the amounts reported in the “Total” column of our Summary Compensation Table, as disclosed in the corresponding Proxy Statement for the relevant year, to our PEO(s) and other NEOs for the relevant fiscal year, as determined under SEC rules, which include the individuals outlined in the Historical NEO Table. |
(2) | The Total Compensation Adjustments Table below provides the adjustments to the amount reported in the “Total” column of our Summary Compensation Table, as disclosed in the corresponding Proxy Statement for the relevant year, to arrive at the compensation actually paid for the PEO(s) and the average compensation actually paid for Non-PEO NEOs for each relevant year, which include the individuals outlined in the Historical NEO Table. We made certain assumptions in valuing equity for our compensation actually paid calculations to determine the fair value or change in fair value as of the applicable year-end date. The assumptions used for each valuation date included stock price, risk-free rate, stock price volatility, expected exercise behavior and the probable outcome of any applicable performance conditions. These assumptions were determined based on the same methodologies as used to determine grant date fair values and were estimated in accordance with FASB ASC Topic 718. |
(3) | Our Total Shareholder Return (“TSR”) amounts reported in the table include an initial fixed investment of $100 on December 31, 2020 and are calculated using the stock price at market close on the following days: (i) December 31, 2020 ($47.97 per share); (ii) December 31, 2021 ($59.01 per share); (iii) December 30, 2022, the last business day before December 31, 2022 ($19.36 per share); (iv) December 29, 2023, the last business day of 2023 ($27.69 per share); (v) December 31, 2024 ($4.93 per share); and (vi) December 31, 2025 ($5.46 per share). TSR amounts exclude a digital dividend of preferred stock (OSTKO) issued by the Company on May 19, 2020 as the preferred stock (OSTKO) was subsequently converted into shares of common stock (OSTK) on or about June 14, 2022. |
(4) | Peer Group TSR is cumulative for the measurement periods beginning on December 31, 2020 and ending on December 31 of each of 2025, 2024, 2023, 2022, and 2021, respectively, calculated in accordance with Item 201(e) of Regulation S-K. The S&P Retail Select Index is the same index we use in our performance graph in the 2025 Form 10-K (“Peer Group”). |
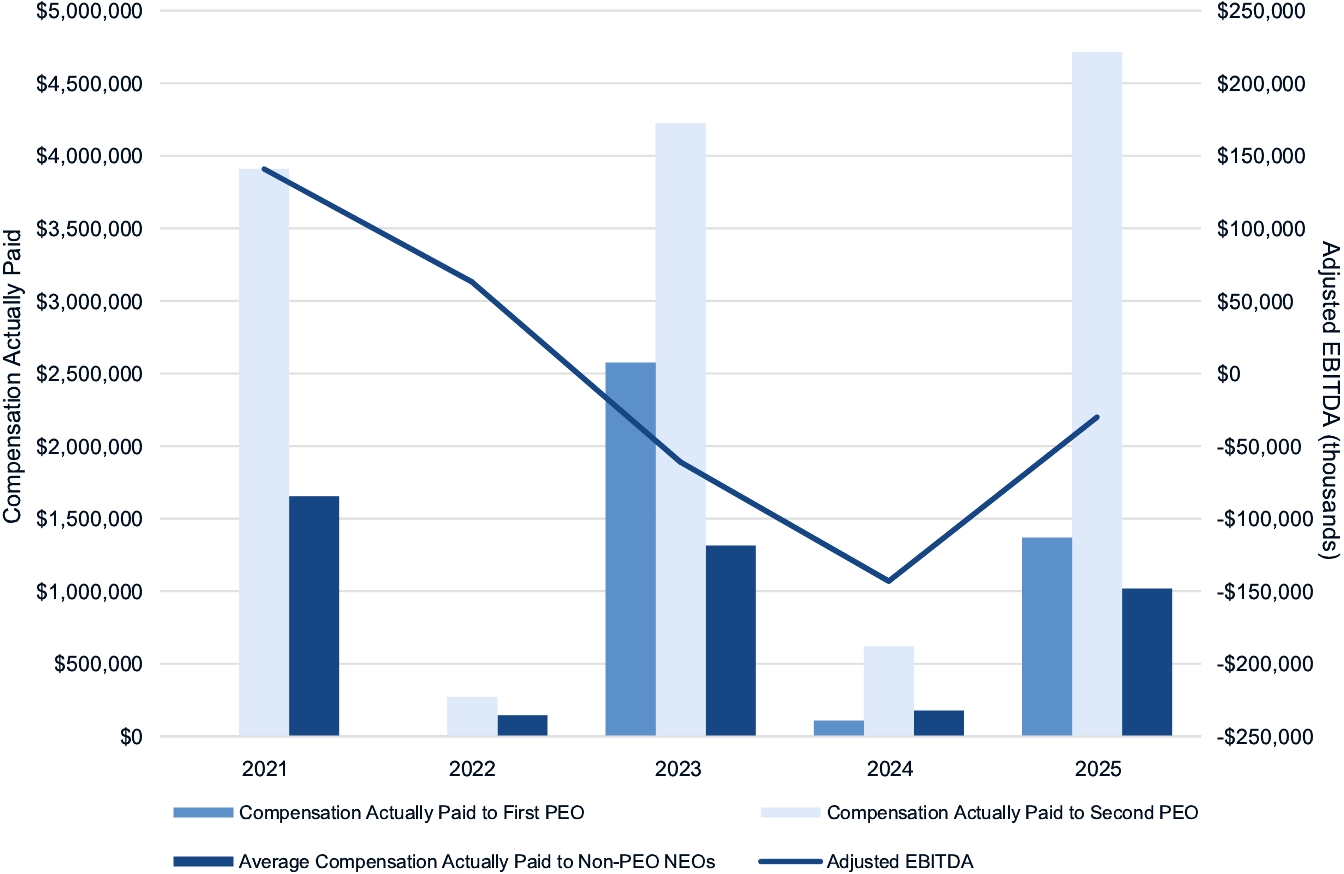
(5) | We have identified Adjusted EBITDA as our “most important” financial performance measure used to link executive compensation to our Company performance. Adjusted EBITDA is a non-GAAP measure. For a description of how this measure is calculated from the nearest GAAP counterpart, please see “—Key 2025 Executive Compensation Actions Reflect Pay for Performance Philosophy” above. |
Historical NEO Table (part of footnotes 1 and 2 to Pay Versus Performance Table)
The following table indicates our PEO and remaining NEOs for each relevant fiscal year, as determined under SEC rules.
Year | PEO(s) | Non-PEO NEOs | ||||||
2025 | David J. Nielsen and Marcus A. Lemonis | Adrianne B. Lee, Leah R. Putnam, Rick S. Lockton, Alexander W. Thomas | ||||||
2024 | David J. Nielsen and Chandra R. Holt | Adrianne B. Lee, Marcus A. Lemonis, E. Glen Nickle, and Carlisha B. Robinson | ||||||
2023 | David J. Nielsen and Jonathan E. Johnson III | Adrianne B. Lee, E. Glen Nickle, Carlisha B. Robinson, Joel G. Weight, Carter P. Lee, and Angela Hsu | ||||||
2022 | Jonathan E. Johnson III | Adrianne B. Lee, David J. Nielsen, Angela Hsu, and Joel G. Weight | ||||||
2021 | Jonathan E. Johnson III | Adrianne B. Lee, David J. Nielsen, Carter P. Lee, Meghan E. Tuohig, Elizabeth W. Solomon, and Ronald Hilton | ||||||
Total Compensation Adjustments Table (part of footnote 2 to Pay Versus Performance Table)
The following table provides the adjustments to the amount reported in the “Total” column of our Summary Compensation Table, as disclosed in the corresponding Proxy Statement for the relevant year, to arrive at the compensation actually paid to the PEO and the average for Non-PEO NEOs for each relevant year.
2021 | 2022 | 2023 | 2024 | 2025 | |||||||||||||||||||||||||||||||||||||
Adjustments | PEO | Average Non-PEO NEOs | PEO | Average Non-PEO NEOs | First PEO | Second PEO | Average Non-PEO NEOs | First PEO | Second PEO | Average Non-PEO NEOs | First PEO | Second PEO | Average Non-PEO NEOs | ||||||||||||||||||||||||||||
Deduction for Amounts Reported under the “Stock Awards” and “Option Awards” Columns in the Summary Compensation Table for Applicable FY | ($1,818,300) | ($618,067) | ($2,043,000) | ($638,685) | ($1,399,998) | ($3,599,999) | ($716,668) | ($3,436,000) | ($4,496,500) | ($3,306,913) | ($1,249,998) | ($5,928,963) | ($750,900) | ||||||||||||||||||||||||||||
Increase based on ASC 718 Fair Value of Awards Granted during Applicable FY that Remain Unvested as of Applicable FY End, determined as of Applicable FY End | $1,180,200 | $295,050 | $968,000 | $290,400 | $1,741,507 | $0 | $718,717 | $210,168 | $0 | $206,038 | $99,719 | $5,046,678 | $517,498 | ||||||||||||||||||||||||||||
Increase based on ASC 718 Fair Value of Awards Granted during Applicable FY that Vested during Applicable FY, determined as of Vesting Date | $47,500 | $20,350 | $0 | $0 | $0 | $1,712,118 | 22,473 | $0 | $0 | $0 | $116,219 | $0 | $0 | ||||||||||||||||||||||||||||
Increase/(deduction) for Awards Granted during Prior FY that were Outstanding and Unvested as of Applicable FY End, determined based on change in ASC 718 Fair Value from Prior FY End to Applicable FY End | $441,611 | $168,673 | ($1,189,540) | ($455,995) | $138,844 | $0 | 56,462 | ($1,106,045) | $0 | ($425,185) | $0 | ($337,500) | ($37,506) | ||||||||||||||||||||||||||||
Increase/(deduction) for Awards Granted during Prior FY that Vested During Applicable FY, determined based on change in ASC 718 Fair Value from Prior FY End to Vesting Date | $1,198,502 | $635,446 | ($419,203) | ($162,009) | $61,765 | ($33,636) | 20,493 | ($123,406) | $0 | ($85,463) | $60,383 | $0 | $13,453 | ||||||||||||||||||||||||||||
Deduction of ASC 718 Fair Value of Awards Granted during Prior FY that were Forfeited during Applicable FY, determined as of Prior FY End | $0 | ($53,303) | $0 | $0 | $0 | $0 | ($19,360) | $0 | $0 | ($51,856) | ($210,168) | $0 | $0 | ||||||||||||||||||||||||||||
Increase based on Dividends or Other Earnings Paid during Applicable FY prior to Vesting Date | $0 | $0 | $0 | $0 | $0 | $0 | $0 | $0 | $0 | $0 | $0 | $0 | $0 | ||||||||||||||||||||||||||||
Deduction for Change in the Actuarial Present Values reported under the “Change in Pension Value and Nonqualified Deferred Compensation Earnings” Column of the Summary Compensation Table for Applicable FY | $0 | $0 | $0 | $0 | $0 | $0 | $0 | $0 | $0 | $0 | $0 | $0 | $0 | ||||||||||||||||||||||||||||
Increase for Service Cost and, if applicable, Prior Service Cost for Pension Plans | $0 | $0 | $0 | $0 | $0 | $0 | $0 | $0 | $0 | $0 | $0 | $0 | $0 | ||||||||||||||||||||||||||||
Total Adjustments | $1,049,513 | $448,149 | ($2,683,743) | ($966,289) | $542,119 | ($1,921,517) | $82,117 | ($4,455,283) | ($4,496,500) | ($3,663,380) | ($1,183,845 | ($1,219,785) | ($257,454) | ||||||||||||||||||||||||||||
Historical NEO Table (part of footnotes 1 and 2 to Pay Versus Performance Table)
The following table indicates our PEO and remaining NEOs for each relevant fiscal year, as determined under SEC rules.
Year | PEO(s) | Non-PEO NEOs | ||||||
2025 | David J. Nielsen and Marcus A. Lemonis | Adrianne B. Lee, Leah R. Putnam, Rick S. Lockton, Alexander W. Thomas | ||||||
2024 | David J. Nielsen and Chandra R. Holt | Adrianne B. Lee, Marcus A. Lemonis, E. Glen Nickle, and Carlisha B. Robinson | ||||||
2023 | David J. Nielsen and Jonathan E. Johnson III | Adrianne B. Lee, E. Glen Nickle, Carlisha B. Robinson, Joel G. Weight, Carter P. Lee, and Angela Hsu | ||||||
2022 | Jonathan E. Johnson III | Adrianne B. Lee, David J. Nielsen, Angela Hsu, and Joel G. Weight | ||||||
2021 | Jonathan E. Johnson III | Adrianne B. Lee, David J. Nielsen, Carter P. Lee, Meghan E. Tuohig, Elizabeth W. Solomon, and Ronald Hilton | ||||||
(4) | Peer Group TSR is cumulative for the measurement periods beginning on December 31, 2020 and ending on December 31 of each of 2025, 2024, 2023, 2022, and 2021, respectively, calculated in accordance with Item 201(e) of Regulation S-K. The S&P Retail Select Index is the same index we use in our performance graph in the 2025 Form 10-K (“Peer Group”). |
Total Compensation Adjustments Table (part of footnote 2 to Pay Versus Performance Table)
The following table provides the adjustments to the amount reported in the “Total” column of our Summary Compensation Table, as disclosed in the corresponding Proxy Statement for the relevant year, to arrive at the compensation actually paid to the PEO and the average for Non-PEO NEOs for each relevant year.
2021 | 2022 | 2023 | 2024 | 2025 | |||||||||||||||||||||||||||||||||||||
Adjustments | PEO | Average Non-PEO NEOs | PEO | Average Non-PEO NEOs | First PEO | Second PEO | Average Non-PEO NEOs | First PEO | Second PEO | Average Non-PEO NEOs | First PEO | Second PEO | Average Non-PEO NEOs | ||||||||||||||||||||||||||||
Deduction for Amounts Reported under the “Stock Awards” and “Option Awards” Columns in the Summary Compensation Table for Applicable FY | ($1,818,300) | ($618,067) | ($2,043,000) | ($638,685) | ($1,399,998) | ($3,599,999) | ($716,668) | ($3,436,000) | ($4,496,500) | ($3,306,913) | ($1,249,998) | ($5,928,963) | ($750,900) | ||||||||||||||||||||||||||||
Increase based on ASC 718 Fair Value of Awards Granted during Applicable FY that Remain Unvested as of Applicable FY End, determined as of Applicable FY End | $1,180,200 | $295,050 | $968,000 | $290,400 | $1,741,507 | $0 | $718,717 | $210,168 | $0 | $206,038 | $99,719 | $5,046,678 | $517,498 | ||||||||||||||||||||||||||||
Increase based on ASC 718 Fair Value of Awards Granted during Applicable FY that Vested during Applicable FY, determined as of Vesting Date | $47,500 | $20,350 | $0 | $0 | $0 | $1,712,118 | 22,473 | $0 | $0 | $0 | $116,219 | $0 | $0 | ||||||||||||||||||||||||||||
Increase/(deduction) for Awards Granted during Prior FY that were Outstanding and Unvested as of Applicable FY End, determined based on change in ASC 718 Fair Value from Prior FY End to Applicable FY End | $441,611 | $168,673 | ($1,189,540) | ($455,995) | $138,844 | $0 | 56,462 | ($1,106,045) | $0 | ($425,185) | $0 | ($337,500) | ($37,506) | ||||||||||||||||||||||||||||
Increase/(deduction) for Awards Granted during Prior FY that Vested During Applicable FY, determined based on change in ASC 718 Fair Value from Prior FY End to Vesting Date | $1,198,502 | $635,446 | ($419,203) | ($162,009) | $61,765 | ($33,636) | 20,493 | ($123,406) | $0 | ($85,463) | $60,383 | $0 | $13,453 | ||||||||||||||||||||||||||||
Deduction of ASC 718 Fair Value of Awards Granted during Prior FY that were Forfeited during Applicable FY, determined as of Prior FY End | $0 | ($53,303) | $0 | $0 | $0 | $0 | ($19,360) | $0 | $0 | ($51,856) | ($210,168) | $0 | $0 | ||||||||||||||||||||||||||||
Increase based on Dividends or Other Earnings Paid during Applicable FY prior to Vesting Date | $0 | $0 | $0 | $0 | $0 | $0 | $0 | $0 | $0 | $0 | $0 | $0 | $0 | ||||||||||||||||||||||||||||
Deduction for Change in the Actuarial Present Values reported under the “Change in Pension Value and Nonqualified Deferred Compensation Earnings” Column of the Summary Compensation Table for Applicable FY | $0 | $0 | $0 | $0 | $0 | $0 | $0 | $0 | $0 | $0 | $0 | $0 | $0 | ||||||||||||||||||||||||||||
Increase for Service Cost and, if applicable, Prior Service Cost for Pension Plans | $0 | $0 | $0 | $0 | $0 | $0 | $0 | $0 | $0 | $0 | $0 | $0 | $0 | ||||||||||||||||||||||||||||
Total Adjustments | $1,049,513 | $448,149 | ($2,683,743) | ($966,289) | $542,119 | ($1,921,517) | $82,117 | ($4,455,283) | ($4,496,500) | ($3,663,380) | ($1,183,845 | ($1,219,785) | ($257,454) | ||||||||||||||||||||||||||||
Compensation Actually Paid vs Cumulative TSR
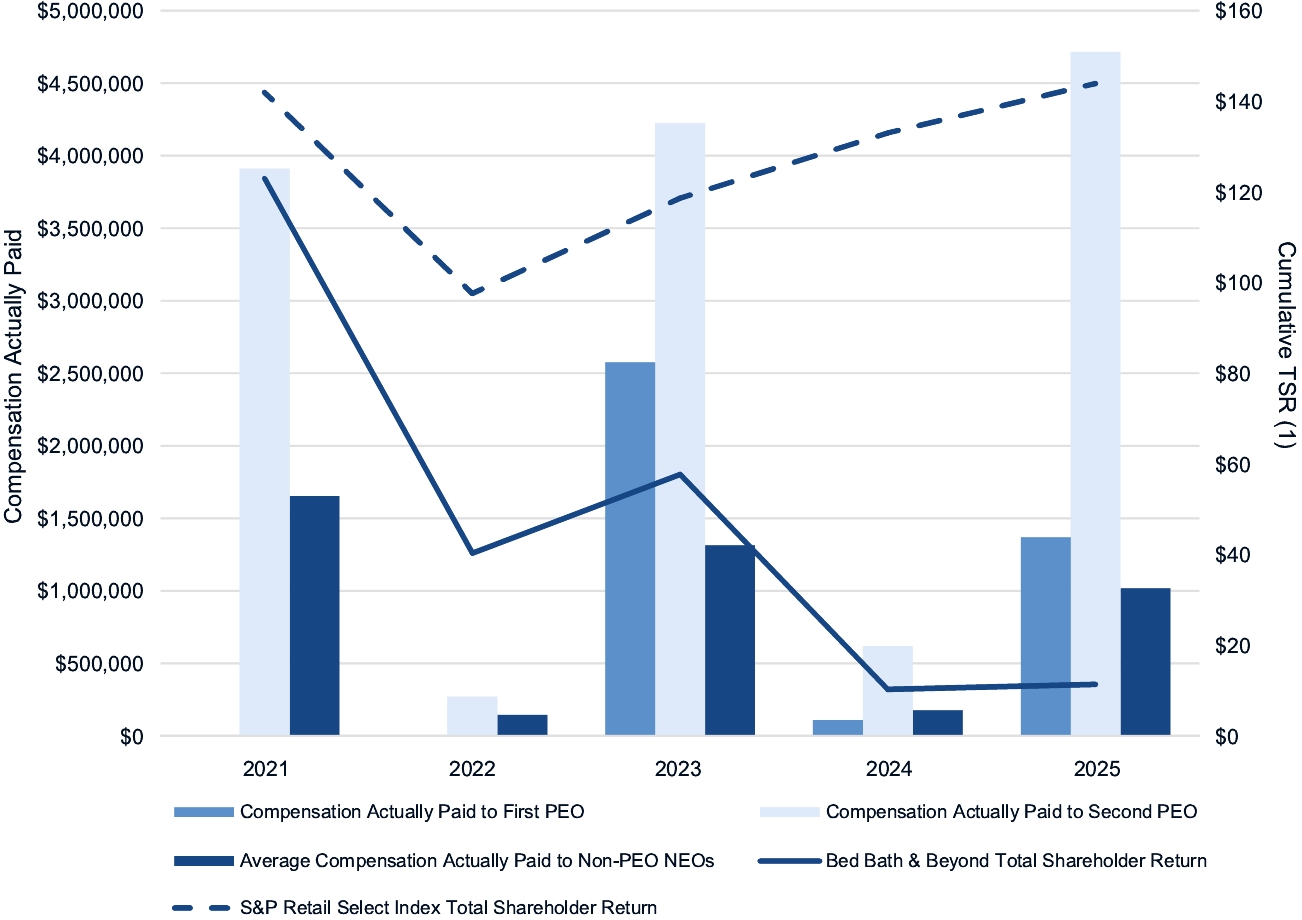
(1) | Our Total Shareholder Return amounts reported in the table include an initial fixed investment of $100 on December 31, 2020 and are calculated using the stock price at market close on the following days: (i) December 31, 2020 ($47.97 per share); (ii) December 31, 2021 ($59.01 per share); (iii) December 30, 2022, the last business day before December 31, 2022 ($19.36 per share); (iv) December 29, 2023, the last business day before December 31, 2023 ($27.69 per share); (v) December 31, 2024 ($4.93 per share); and (vi) December 31, 2025 ($5.46 per share). TSR amounts exclude a digital dividend of preferred stock (OSTKO) issued by the Company on May 19, 2020 as the preferred stock (OSTKO) was subsequently converted into shares of common stock (OSTK) on or about June 14, 2022. |
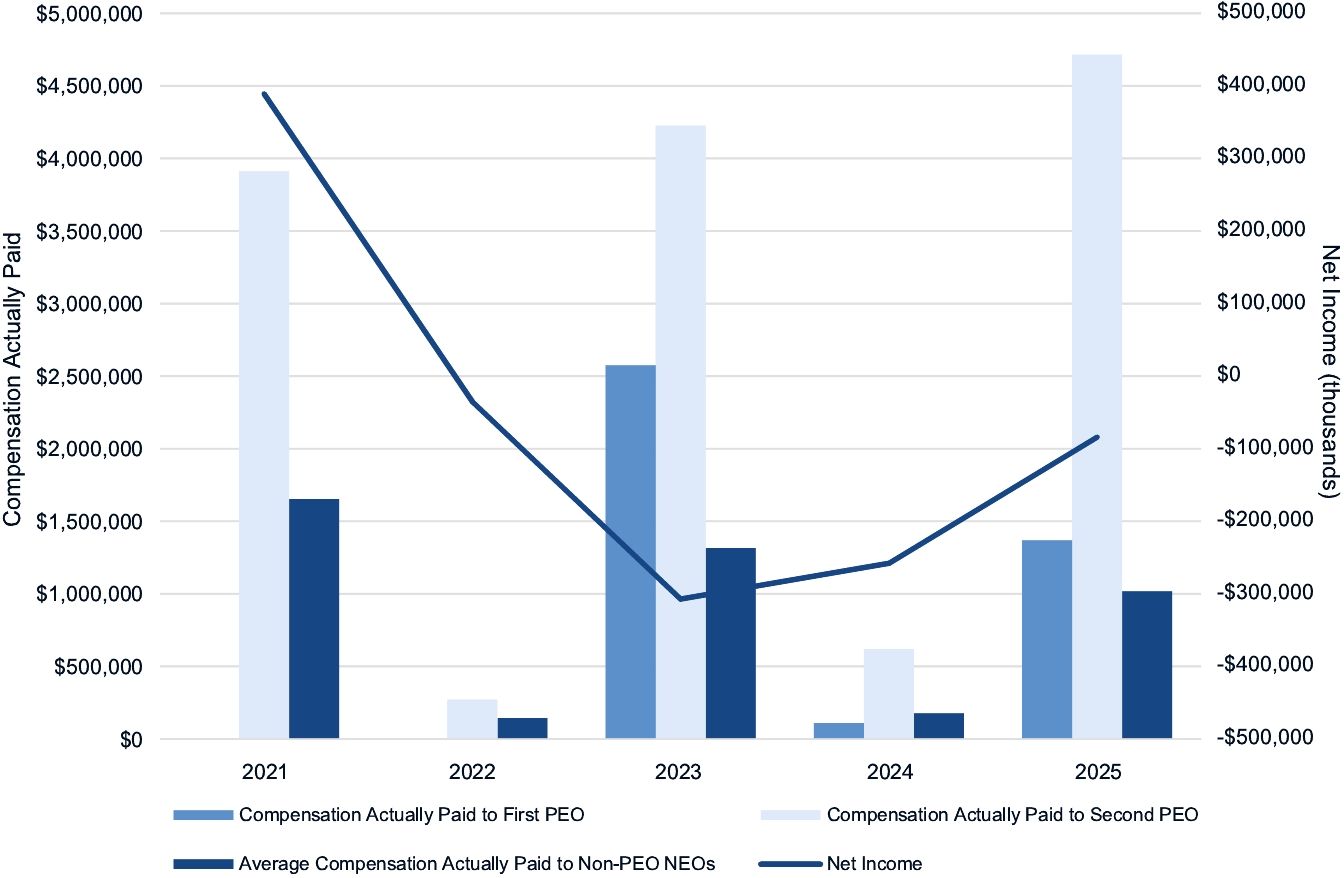
Compensation Actually Paid vs Net Income
Compensation Actually Paid vs Adjusted EBITDA
Compensation Actually Paid vs Cumulative TSR
(1) | Our Total Shareholder Return amounts reported in the table include an initial fixed investment of $100 on December 31, 2020 and are calculated using the stock price at market close on the following days: (i) December 31, 2020 ($47.97 per share); (ii) December 31, 2021 ($59.01 per share); (iii) December 30, 2022, the last business day before December 31, 2022 ($19.36 per share); (iv) December 29, 2023, the last business day before December 31, 2023 ($27.69 per share); (v) December 31, 2024 ($4.93 per share); and (vi) December 31, 2025 ($5.46 per share). TSR amounts exclude a digital dividend of preferred stock (OSTKO) issued by the Company on May 19, 2020 as the preferred stock (OSTKO) was subsequently converted into shares of common stock (OSTK) on or about June 14, 2022. |
Pay Versus Performance Tabular List
The following performance measures represent the most important financial performance measures used by us to link compensation actually paid to our NEOs to performance for the fiscal year ended December 31, 2025:
• | Adjusted EBITDA; |
• | Gross Margin; |
• | Gross Margin %; and |
• | Contribution Margin. |