Pay vs Performance Disclosure - USD ($)
Dec. 31, 2025
Dec. 31, 2024
Dec. 31, 2023
Dec. 31, 2022
Dec. 31, 2021
PAY VERSUS PERFORMANCE DISCLOSURE
As required by Section 953(a) of the Dodd-Frank Wall Street Reform and Consumer Protection Act, and Item 402(v) of Regulation S-K, we are providing the following information about the relationship between “compensation actually paid”, or “CAP”, to our NEOs and certain financial performance metrics. For information concerning the Company’s philosophy and how the Company aligns executive compensation with the Company’s performance, refer to “Compensation Discussion and Analysis – 2025 Executive Compensation and Decisions.”
Year (a) | Summary Compensation Table Total for PEO(1) (b) | Compensation Actually Paid for PEO(1)(3) (c) | Average Summary Compensation Table Total for Non- PEO Named Executive Officers(2) (d) | Average Compensation Actually Paid for Non- PEO Named Executive Officers(2)(3) (e) | Value of Initial Fixed $100 Investment Based on: | Net Income (h) | Economic Adjusted EBITDA(5) (j) | |||||||||||||||||||
Company TSR (f) | Peer Group(4) TSR (g) | |||||||||||||||||||||||||
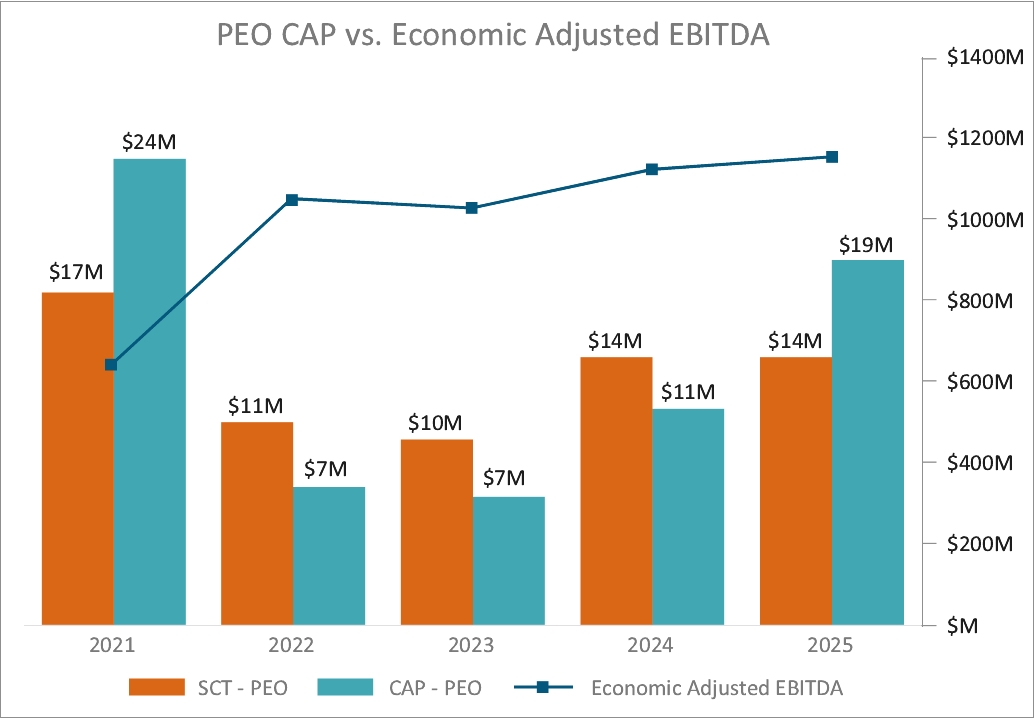
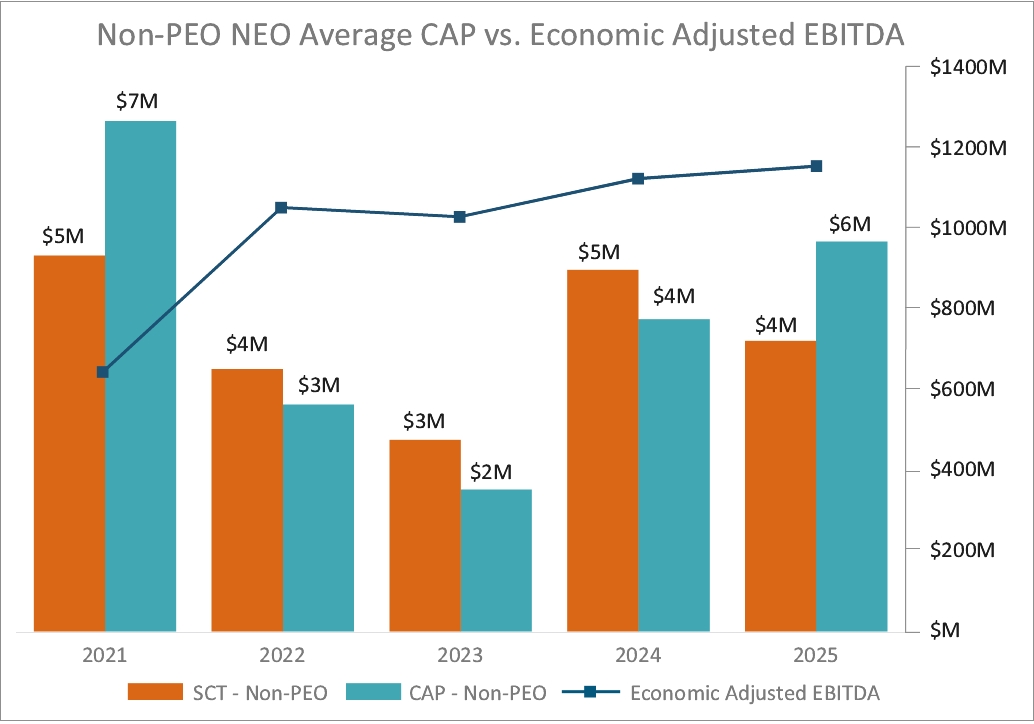
2025 | $14,067,191 | $19,127,867 | $4,153,625 | $5,527,592 | $114.89 | $107.62 | $99M | $1,152M | ||||||||||||||||||
2024 | $14,027,251 | $11,395,663 | $5,165,225 | $4,488,214 | $96.94 | $116.79 | $60M | $1,121M | ||||||||||||||||||
2023 | $9,794,601 | $6,730,057 | $2,788,345 | $2,021,738 | $104.26 | $136.09 | $313M | $1,026M | ||||||||||||||||||
2022 | $10,608,845 | $7,231,251 | $3,713,962 | $3,209,375 | $73.96 | $79.94 | $352M | $1,049M | ||||||||||||||||||
2021 | $17,455,265 | $24,438,040 | $5,320,316 | $7,288,365 | $166.22 | $111.49 | $176M | $640M | ||||||||||||||||||
(1) | The principal executive officer (the “PEO”) for each of 2025, 2024, 2023, 2022 and 2021 is Mr. Wang. |
(2) | The non-PEO NEOs for each applicable year include the following individuals: |
2025: | Messrs. Mathewes, Gurnik, Corbin and Tonkin and Ms. Day. | ||
2022, 2023 and 2024: | Messrs. Mathewes, Gurnik, Corbin, and Brizi. | ||
2021: | Messrs. Mathewes, Gurnik and Corbin, as well as Mr. Pablo Brizi, Mr. Dennis DeLorenzo and Mr. Stan R. Soroka, each of whom separated from the Company effective April 1, 2025, March 1, 2024 and December 31, 2022, respectively. |
(3) | The dollar amounts reported in columns (c) and (e) represent the “compensation actually paid”, or “CAP”, to the PEO and the Non-PEO NEOs, respectively, as computed in accordance with Item 402(v) of Regulation S-K. The dollar amounts do not reflect the actual amount of compensation earned by or paid to the PEO or the Non-PEO NEOs, respectively, during the applicable year. To calculate CAP for the PEO and average CAP for the Non-PEO NEOs, the following amounts were deducted from and added to Summary Compensation Table (or “SCT”) total compensation: |
PEO Equity Component of CAP (a)
Subtracted | Added | Subtracted | Added | |||||||||||||||||||||||
Grant Date Fair Value of Awards Granted in the Year ($)(b) | Year End Fair Value of Unvested Equity Awards Granted in the Years ($)(c)(d) | Year over Year Change in Fair Value of Outstanding and Unvested Equity Awards ($)(c)(d) | Fair Value as of Vesting Date of Equity Awards Granted and Vested in the Year ($)(c)(d) | Year over year Change in Fair Value of Equity Awards Granted In Prior Years that Vested in the Year | Fair Value at the End of the Prior Year of Equity Awards that Failed to Meet Vesting Conditions in the Year ($)(c)(d) | Value of Dividends or other Earnings Paid on Stock or Option Awards not Otherwise Reflected in Fair Value or Total Compensation ($) | Total Equity Award Adjustments ($) | |||||||||||||||||||
2025 | $7,762,448 | $10,825,034 | $1,876,896 | $0 | $121,194 | $0 | $0 | $5,060,676 | ||||||||||||||||||
2024 | $9,696,728 | $7,637,907 | $(1,193,560) | $0 | $620,791 | $0 | $0 | $(2,631,589) | ||||||||||||||||||
2023 | $6,851,639 | $4,321,739 | $(1,508,215) | $0 | $973,571 | $0 | $0 | $(3,064,544) | ||||||||||||||||||
2022 | $6,519,985 | $5,897,247 | $(2,712,140) | $0 | $(42,716) | $0 | $0 | $(3,377,594) | ||||||||||||||||||
2021 | $14,159,967 | $18,293,765 | $2,108,590 | $0 | $740,387 | $0 | $0 | $6,982,775 | ||||||||||||||||||
Non-PEO NEO Equity Component of CAP (a)
Subtracted | Added | Subtracted | Added | |||||||||||||||||||||||
Average Grant Date Fair Value of Awards Granted in the Years ($)(b) | Average Year End Fair Value of Unvested Equity Awards Granted in the Year ($)(c)(d) | Year over Year Change in Fair Value of Outstanding and Unvested Equity Awards ($)(c)(d) | Average Fair Value as of Vesting Date of Equity Awards Granted and Vested in the Year ($)(c)(d) | Year over year Average Change in Fair Value of Equity Awards Granted in Prior Years that Vested in the Year ($)(c)(d) | Average Fair Value at the End of the Prior Year of Equity Awards that Failed to Meet Vesting Conditions in the Year ($)(c)(d) | Average Value of Dividends or other Earnings Paid on Stock or Option Awards not Otherwise Reflected in Fair Value or Total Compensation ($) | Total Average Equity Award Adjustments ($) | |||||||||||||||||||
2025 | $1,971,961 | $3,147,330 | $179,591 | $0 | $19,007 | $0 | $0 | $1,373,968 | ||||||||||||||||||
2024 | $3,197,810 | $2,293,203 | $(284,360) | $0 | $511,955 | $0 | $0 | $(677,011) | ||||||||||||||||||
2023 | $1,635,011 | $1,031,297 | $(578,316) | $0 | $415,423 | $0 | $0 | $(766,607) | ||||||||||||||||||
2022 | $1,932,553 | $1,612,586 | $(146,092) | $0 | $(38,529) | $0 | $0 | $(504,588) | ||||||||||||||||||
2021 | $3,674,324 | $4,781,582 | $608,065 | $0 | $252,726 | $0 | $0 | $1,968,049 | ||||||||||||||||||
(a) | There are no pension benefits for the PEO or the Non-PEO NEOs. |
(b) | Represents the grant date fair value of equity-based awards granted each year. |
(c) | The fair value of the stock options was determined using the Black Scholes model, which is consistent with the fair value methodology used to account for share-based payments in our financial statements. The assumptions used in calculating the fair value of the stock options did not differ in any material respect from the assumptions used to calculate the grant date fair value of the awards as reported in the Summary Compensation Table for the applicable years. |
(d) | The fair value of the Service RSUs was determined based on the stock price on the applicable valuation dates. The fair value of the Performance RSUs, the Diamond Acquisition Incentive Awards and the Bluegreen PSU Awards was determined based on the probable outcome of the performance condition and the stock price on the applicable valuation dates. The assumptions used in calculating the fair value of the Service RSUs, the Performance RSUs, the Diamond Acquisition Incentive Awards and the Bluegreen PSU Awards did not differ in any material respect from the assumptions used to calculate the grant date fair value of the awards as reported in the Summary Compensation Table for the applicable year, except that the fair value calculations of (i) the 2021 Performance RSUs and the Diamond Acquisition Incentive Awards as of December 31, 2022 and 2021, assumed a payout between target and maximum performance, which was the probable outcome of the applicable performance conditions as of December 31, 2022 and 2021, respectively, and (ii) the 2022 Performance RSUs as of December 31, 2022 assumed a payout at maximum performance, which was the probable outcome of the applicable performance conditions as of December 31, 2022, in each case compared to the grant date fair value calculations of such Performance RSUs, which assumed a payout at target. The fair value calculation used herein is consistent with the fair value methodology used to account for share- based payments in our financial statements. |
(4) | The peer group that we used for purposes of this disclosure is the Dow Jones US Travel & Leisure Total Return Index GICS Level 2(DJUSGCT), the same index used for our performance graph disclosed in our Annual Report on Form 10-K for the year ended December 31, 2025. |
(5) | Our company selected measure is Economic Adjusted EBITDA, which is calculated as described in Appendix A in this proxy statement. |
(1) | The principal executive officer (the “PEO”) for each of 2025, 2024, 2023, 2022 and 2021 is Mr. Wang. |
(2) | The non-PEO NEOs for each applicable year include the following individuals: |
2025: | Messrs. Mathewes, Gurnik, Corbin and Tonkin and Ms. Day. | ||
2022, 2023 and 2024: | Messrs. Mathewes, Gurnik, Corbin, and Brizi. | ||
2021: | Messrs. Mathewes, Gurnik and Corbin, as well as Mr. Pablo Brizi, Mr. Dennis DeLorenzo and Mr. Stan R. Soroka, each of whom separated from the Company effective April 1, 2025, March 1, 2024 and December 31, 2022, respectively. |
(4) | The peer group that we used for purposes of this disclosure is the Dow Jones US Travel & Leisure Total Return Index GICS Level 2(DJUSGCT), the same index used for our performance graph disclosed in our Annual Report on Form 10-K for the year ended December 31, 2025. |
(3) | The dollar amounts reported in columns (c) and (e) represent the “compensation actually paid”, or “CAP”, to the PEO and the Non-PEO NEOs, respectively, as computed in accordance with Item 402(v) of Regulation S-K. The dollar amounts do not reflect the actual amount of compensation earned by or paid to the PEO or the Non-PEO NEOs, respectively, during the applicable year. To calculate CAP for the PEO and average CAP for the Non-PEO NEOs, the following amounts were deducted from and added to Summary Compensation Table (or “SCT”) total compensation: |
PEO Equity Component of CAP (a)
Subtracted | Added | Subtracted | Added | |||||||||||||||||||||||
Grant Date Fair Value of Awards Granted in the Year ($)(b) | Year End Fair Value of Unvested Equity Awards Granted in the Years ($)(c)(d) | Year over Year Change in Fair Value of Outstanding and Unvested Equity Awards ($)(c)(d) | Fair Value as of Vesting Date of Equity Awards Granted and Vested in the Year ($)(c)(d) | Year over year Change in Fair Value of Equity Awards Granted In Prior Years that Vested in the Year | Fair Value at the End of the Prior Year of Equity Awards that Failed to Meet Vesting Conditions in the Year ($)(c)(d) | Value of Dividends or other Earnings Paid on Stock or Option Awards not Otherwise Reflected in Fair Value or Total Compensation ($) | Total Equity Award Adjustments ($) | |||||||||||||||||||
2025 | $7,762,448 | $10,825,034 | $1,876,896 | $0 | $121,194 | $0 | $0 | $5,060,676 | ||||||||||||||||||
2024 | $9,696,728 | $7,637,907 | $(1,193,560) | $0 | $620,791 | $0 | $0 | $(2,631,589) | ||||||||||||||||||
2023 | $6,851,639 | $4,321,739 | $(1,508,215) | $0 | $973,571 | $0 | $0 | $(3,064,544) | ||||||||||||||||||
2022 | $6,519,985 | $5,897,247 | $(2,712,140) | $0 | $(42,716) | $0 | $0 | $(3,377,594) | ||||||||||||||||||
2021 | $14,159,967 | $18,293,765 | $2,108,590 | $0 | $740,387 | $0 | $0 | $6,982,775 | ||||||||||||||||||
(a) | There are no pension benefits for the PEO or the Non-PEO NEOs. |
(b) | Represents the grant date fair value of equity-based awards granted each year. |
(c) | The fair value of the stock options was determined using the Black Scholes model, which is consistent with the fair value methodology used to account for share-based payments in our financial statements. The assumptions used in calculating the fair value of the stock options did not differ in any material respect from the assumptions used to calculate the grant date fair value of the awards as reported in the Summary Compensation Table for the applicable years. |
(d) | The fair value of the Service RSUs was determined based on the stock price on the applicable valuation dates. The fair value of the Performance RSUs, the Diamond Acquisition Incentive Awards and the Bluegreen PSU Awards was determined based on the probable outcome of the performance condition and the stock price on the applicable valuation dates. The assumptions used in calculating the fair value of the Service RSUs, the Performance RSUs, the Diamond Acquisition Incentive Awards and the Bluegreen PSU Awards did not differ in any material respect from the assumptions used to calculate the grant date fair value of the awards as reported in the Summary Compensation Table for the applicable year, except that the fair value calculations of (i) the 2021 Performance RSUs and the Diamond Acquisition Incentive Awards as of December 31, 2022 and 2021, assumed a payout between target and maximum performance, which was the probable outcome of the applicable performance conditions as of December 31, 2022 and 2021, respectively, and (ii) the 2022 Performance RSUs as of December 31, 2022 assumed a payout at maximum performance, which was the probable outcome of the applicable performance conditions as of December 31, 2022, in each case compared to the grant date fair value calculations of such Performance RSUs, which assumed a payout at target. The fair value calculation used herein is consistent with the fair value methodology used to account for share- based payments in our financial statements. |
(3) | The dollar amounts reported in columns (c) and (e) represent the “compensation actually paid”, or “CAP”, to the PEO and the Non-PEO NEOs, respectively, as computed in accordance with Item 402(v) of Regulation S-K. The dollar amounts do not reflect the actual amount of compensation earned by or paid to the PEO or the Non-PEO NEOs, respectively, during the applicable year. To calculate CAP for the PEO and average CAP for the Non-PEO NEOs, the following amounts were deducted from and added to Summary Compensation Table (or “SCT”) total compensation: |
Non-PEO NEO Equity Component of CAP (a)
Subtracted | Added | Subtracted | Added | |||||||||||||||||||||||
Average Grant Date Fair Value of Awards Granted in the Years ($)(b) | Average Year End Fair Value of Unvested Equity Awards Granted in the Year ($)(c)(d) | Year over Year Change in Fair Value of Outstanding and Unvested Equity Awards ($)(c)(d) | Average Fair Value as of Vesting Date of Equity Awards Granted and Vested in the Year ($)(c)(d) | Year over year Average Change in Fair Value of Equity Awards Granted in Prior Years that Vested in the Year ($)(c)(d) | Average Fair Value at the End of the Prior Year of Equity Awards that Failed to Meet Vesting Conditions in the Year ($)(c)(d) | Average Value of Dividends or other Earnings Paid on Stock or Option Awards not Otherwise Reflected in Fair Value or Total Compensation ($) | Total Average Equity Award Adjustments ($) | |||||||||||||||||||
2025 | $1,971,961 | $3,147,330 | $179,591 | $0 | $19,007 | $0 | $0 | $1,373,968 | ||||||||||||||||||
2024 | $3,197,810 | $2,293,203 | $(284,360) | $0 | $511,955 | $0 | $0 | $(677,011) | ||||||||||||||||||
2023 | $1,635,011 | $1,031,297 | $(578,316) | $0 | $415,423 | $0 | $0 | $(766,607) | ||||||||||||||||||
2022 | $1,932,553 | $1,612,586 | $(146,092) | $0 | $(38,529) | $0 | $0 | $(504,588) | ||||||||||||||||||
2021 | $3,674,324 | $4,781,582 | $608,065 | $0 | $252,726 | $0 | $0 | $1,968,049 | ||||||||||||||||||
(a) | There are no pension benefits for the PEO or the Non-PEO NEOs. |
(b) | Represents the grant date fair value of equity-based awards granted each year. |
(c) | The fair value of the stock options was determined using the Black Scholes model, which is consistent with the fair value methodology used to account for share-based payments in our financial statements. The assumptions used in calculating the fair value of the stock options did not differ in any material respect from the assumptions used to calculate the grant date fair value of the awards as reported in the Summary Compensation Table for the applicable years. |
(d) | The fair value of the Service RSUs was determined based on the stock price on the applicable valuation dates. The fair value of the Performance RSUs, the Diamond Acquisition Incentive Awards and the Bluegreen PSU Awards was determined based on the probable outcome of the performance condition and the stock price on the applicable valuation dates. The assumptions used in calculating the fair value of the Service RSUs, the Performance RSUs, the Diamond Acquisition Incentive Awards and the Bluegreen PSU Awards did not differ in any material respect from the assumptions used to calculate the grant date fair value of the awards as reported in the Summary Compensation Table for the applicable year, except that the fair value calculations of (i) the 2021 Performance RSUs and the Diamond Acquisition Incentive Awards as of December 31, 2022 and 2021, assumed a payout between target and maximum performance, which was the probable outcome of the applicable performance conditions as of December 31, 2022 and 2021, respectively, and (ii) the 2022 Performance RSUs as of December 31, 2022 assumed a payout at maximum performance, which was the probable outcome of the applicable performance conditions as of December 31, 2022, in each case compared to the grant date fair value calculations of such Performance RSUs, which assumed a payout at target. The fair value calculation used herein is consistent with the fair value methodology used to account for share- based payments in our financial statements. |
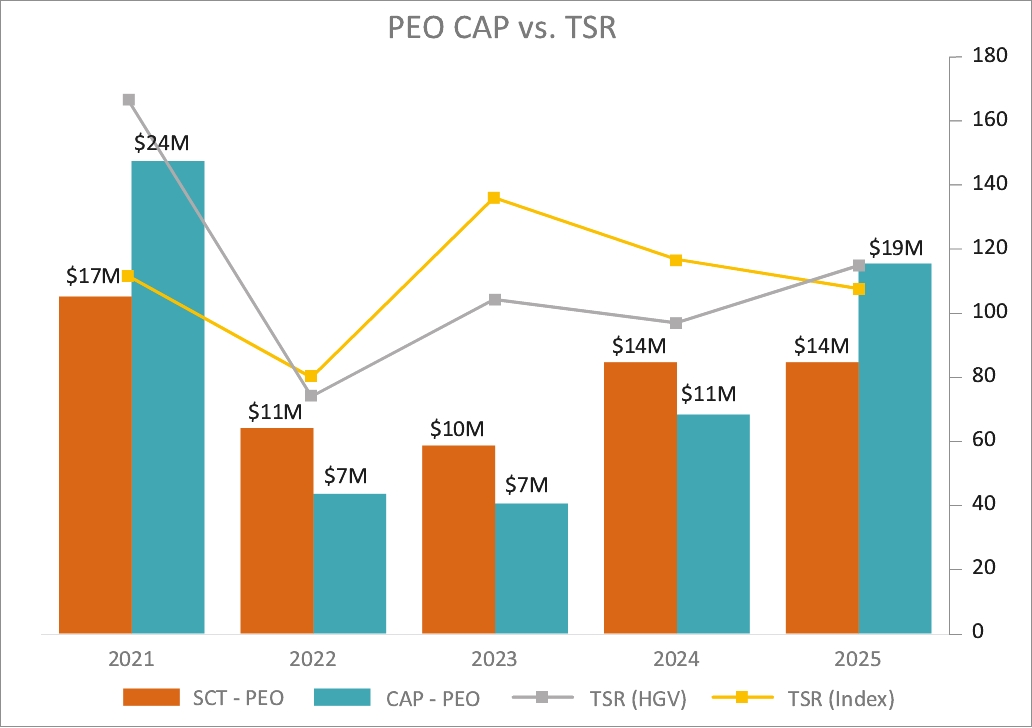
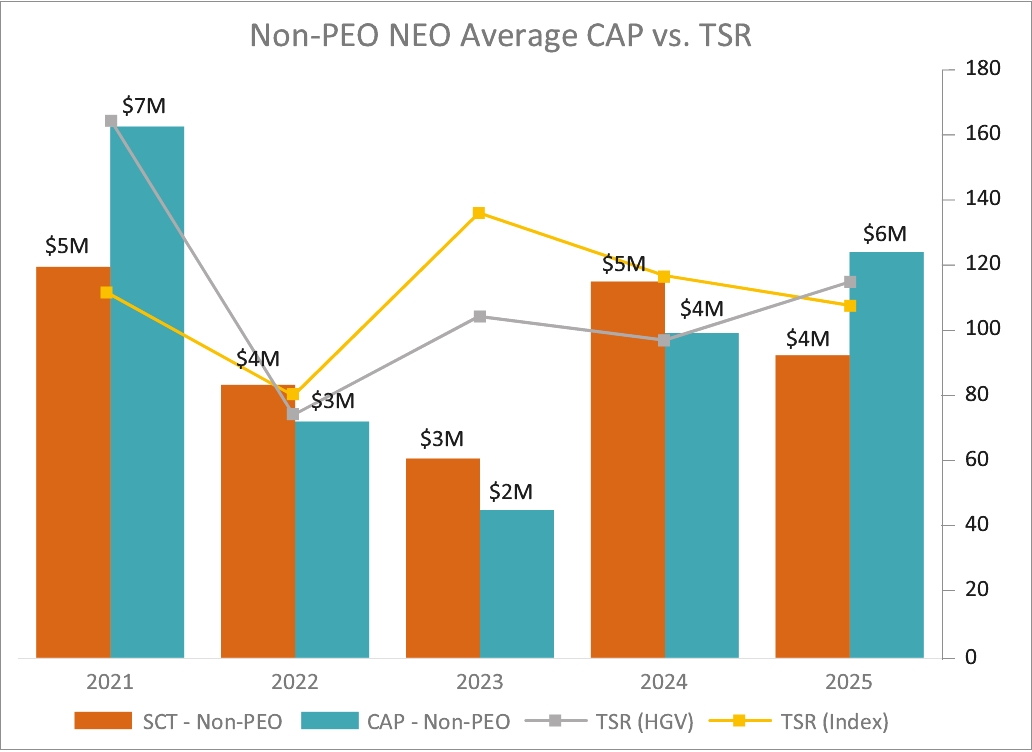
CAP versus TSR and Peer Group TSR
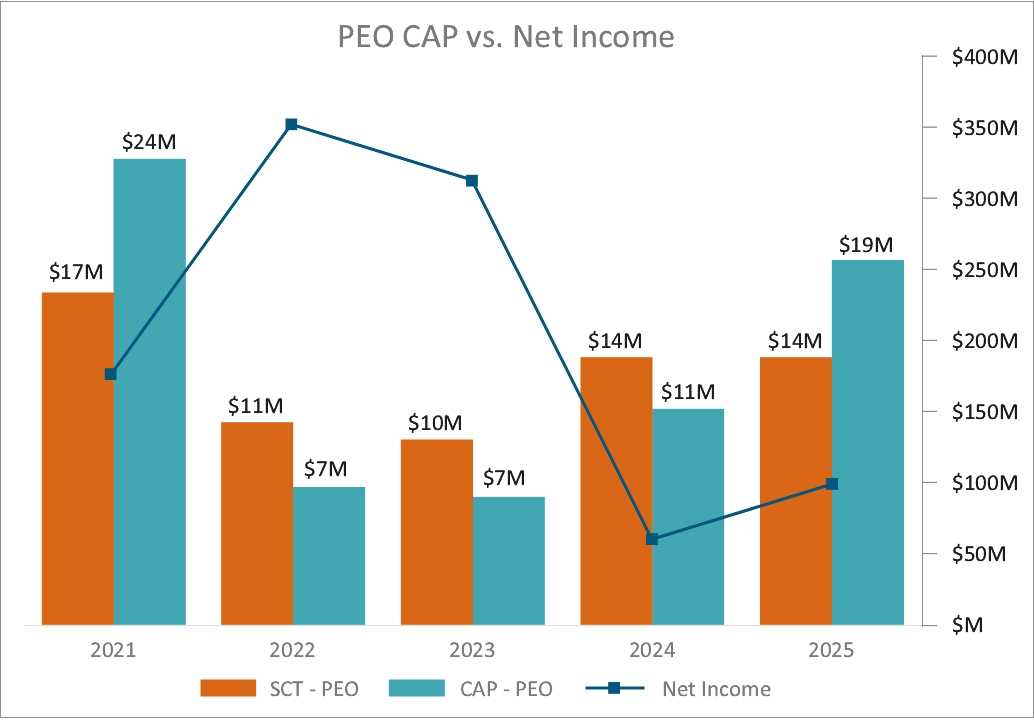
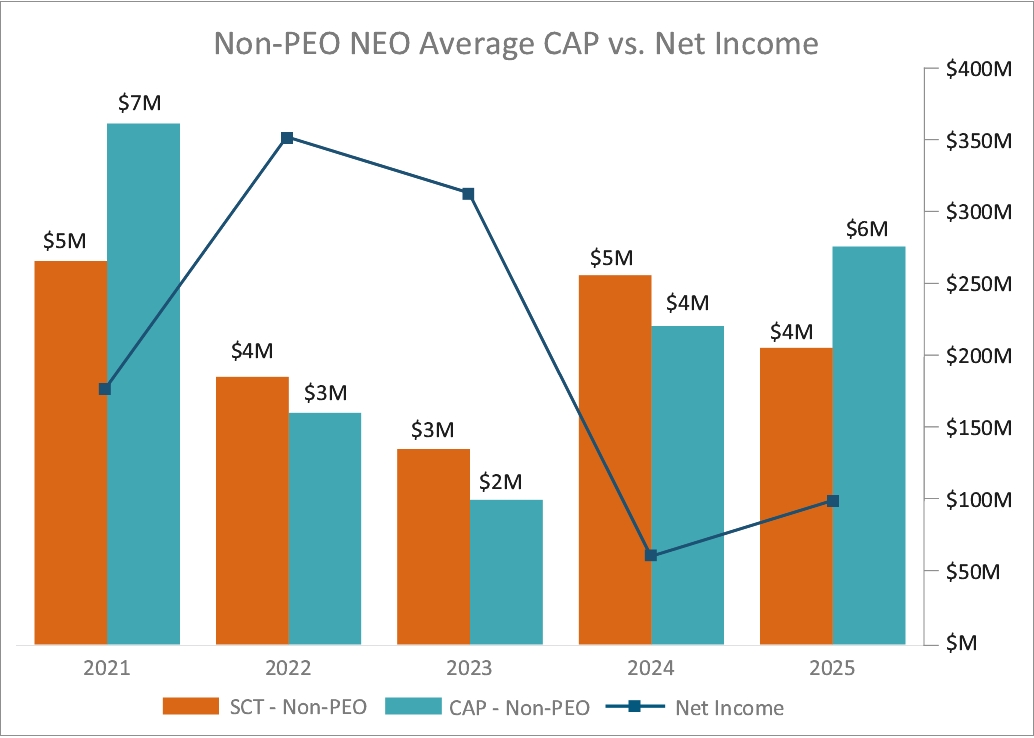
CAP versus Net Income
CAP versus Economic Adjusted EBITDA
CAP versus TSR and Peer Group TSR
Tabular Disclosure of Most Important Measures Used by the Company to Link CAP to the Company’s NEOs for 2025 |
Economic Adjusted EBITDA |
Contract Sales |
Total Economic Revenue |
Real Estate Adjusted EBITDA |
(3) | The dollar amounts reported in columns (c) and (e) represent the “compensation actually paid”, or “CAP”, to the PEO and the Non-PEO NEOs, respectively, as computed in accordance with Item 402(v) of Regulation S-K. The dollar amounts do not reflect the actual amount of compensation earned by or paid to the PEO or the Non-PEO NEOs, respectively, during the applicable year. To calculate CAP for the PEO and average CAP for the Non-PEO NEOs, the following amounts were deducted from and added to Summary Compensation Table (or “SCT”) total compensation: |
PEO Equity Component of CAP (a)
Subtracted | Added | Subtracted | Added | |||||||||||||||||||||||
Grant Date Fair Value of Awards Granted in the Year ($)(b) | Year End Fair Value of Unvested Equity Awards Granted in the Years ($)(c)(d) | Year over Year Change in Fair Value of Outstanding and Unvested Equity Awards ($)(c)(d) | Fair Value as of Vesting Date of Equity Awards Granted and Vested in the Year ($)(c)(d) | Year over year Change in Fair Value of Equity Awards Granted In Prior Years that Vested in the Year | Fair Value at the End of the Prior Year of Equity Awards that Failed to Meet Vesting Conditions in the Year ($)(c)(d) | Value of Dividends or other Earnings Paid on Stock or Option Awards not Otherwise Reflected in Fair Value or Total Compensation ($) | Total Equity Award Adjustments ($) | |||||||||||||||||||
2025 | $7,762,448 | $10,825,034 | $1,876,896 | $0 | $121,194 | $0 | $0 | $5,060,676 | ||||||||||||||||||
2024 | $9,696,728 | $7,637,907 | $(1,193,560) | $0 | $620,791 | $0 | $0 | $(2,631,589) | ||||||||||||||||||
2023 | $6,851,639 | $4,321,739 | $(1,508,215) | $0 | $973,571 | $0 | $0 | $(3,064,544) | ||||||||||||||||||
2022 | $6,519,985 | $5,897,247 | $(2,712,140) | $0 | $(42,716) | $0 | $0 | $(3,377,594) | ||||||||||||||||||
2021 | $14,159,967 | $18,293,765 | $2,108,590 | $0 | $740,387 | $0 | $0 | $6,982,775 | ||||||||||||||||||
Non-PEO NEO Equity Component of CAP (a)
Subtracted | Added | Subtracted | Added | |||||||||||||||||||||||
Average Grant Date Fair Value of Awards Granted in the Years ($)(b) | Average Year End Fair Value of Unvested Equity Awards Granted in the Year ($)(c)(d) | Year over Year Change in Fair Value of Outstanding and Unvested Equity Awards ($)(c)(d) | Average Fair Value as of Vesting Date of Equity Awards Granted and Vested in the Year ($)(c)(d) | Year over year Average Change in Fair Value of Equity Awards Granted in Prior Years that Vested in the Year ($)(c)(d) | Average Fair Value at the End of the Prior Year of Equity Awards that Failed to Meet Vesting Conditions in the Year ($)(c)(d) | Average Value of Dividends or other Earnings Paid on Stock or Option Awards not Otherwise Reflected in Fair Value or Total Compensation ($) | Total Average Equity Award Adjustments ($) | |||||||||||||||||||
2025 | $1,971,961 | $3,147,330 | $179,591 | $0 | $19,007 | $0 | $0 | $1,373,968 | ||||||||||||||||||
2024 | $3,197,810 | $2,293,203 | $(284,360) | $0 | $511,955 | $0 | $0 | $(677,011) | ||||||||||||||||||
2023 | $1,635,011 | $1,031,297 | $(578,316) | $0 | $415,423 | $0 | $0 | $(766,607) | ||||||||||||||||||
2022 | $1,932,553 | $1,612,586 | $(146,092) | $0 | $(38,529) | $0 | $0 | $(504,588) | ||||||||||||||||||
2021 | $3,674,324 | $4,781,582 | $608,065 | $0 | $252,726 | $0 | $0 | $1,968,049 | ||||||||||||||||||
(a) | There are no pension benefits for the PEO or the Non-PEO NEOs. |
(b) | Represents the grant date fair value of equity-based awards granted each year. |
(c) | The fair value of the stock options was determined using the Black Scholes model, which is consistent with the fair value methodology used to account for share-based payments in our financial statements. The assumptions used in calculating the fair value of the stock options did not differ in any material respect from the assumptions used to calculate the grant date fair value of the awards as reported in the Summary Compensation Table for the applicable years. |
(d) | The fair value of the Service RSUs was determined based on the stock price on the applicable valuation dates. The fair value of the Performance RSUs, the Diamond Acquisition Incentive Awards and the Bluegreen PSU Awards was determined based on the probable outcome of the performance condition and the stock price on the applicable valuation dates. The assumptions used in calculating the fair value of the Service RSUs, the Performance RSUs, the Diamond Acquisition Incentive Awards and the Bluegreen PSU Awards did not differ in any material respect from the assumptions used to calculate the grant date fair value of the awards as reported in the Summary Compensation Table for the applicable year, except that the fair value calculations of (i) the 2021 Performance RSUs and the Diamond Acquisition Incentive Awards as of December 31, 2022 and 2021, assumed a payout between target and maximum performance, which was the probable outcome of the applicable performance conditions as of December 31, 2022 and 2021, respectively, and (ii) the 2022 Performance RSUs as of December 31, 2022 assumed a payout at maximum performance, which was the probable outcome of the applicable performance conditions as of December 31, 2022, in each case compared to the grant date fair value calculations of such Performance RSUs, which assumed a payout at target. The fair value calculation used herein is consistent with the fair value methodology used to account for share- based payments in our financial statements. |
(5) | Our company selected measure is Economic Adjusted EBITDA, which is calculated as described in Appendix A in this proxy statement. |