Pay Versus Performance Disclosure
As required by Section 953(a) of the Dodd-Frank Act and Item 402(v) of Regulation S-K, we are providing the following information about the relationship between executive “compensation actually paid” and certain financial performance of our Company, illustrating pay versus performance, or PVP.
| Year | Summary Compensation Table Total for PEO Speetzen ($)(1) |
Compensation Actually Paid to PEO Speetzen ($)(1)(3) |
Avg.
Summary Compensation Table Total for Non-PEO NEOs ($)(2) |
Average Compensation Actually Paid to Non-PEO NEOs ($)(2) |
Value of Initial Fixed $100 Investment Based On: |
Net Income ($ in Millions(5) |
Adjusted EBITDA ($ in Millions)(6) | |||||||||
| TSR(4) | S&P 1500 Leisure TSR(4) |
|||||||||||||||
| 2025 | 11,144,637 | 14,526,291 | 3,977,148 | 5,026,144 | 77.64 | 95.74 | (465.5) | 538.2 | ||||||||
| 2024 | 9,026,124 | 1,115,331 | 2,980,095 | 1,221,006 | 66.94 | 75.75 | 110.8 | 635.4 | ||||||||
| 2023 | 8,873,477 | 6,091,505 | 3,084,958 | 2,296,051 | 106.55 | 88.50 | 502.8 | 1,069.2 | ||||||||
| 2022 | 8,764,103 | 7,956,973 | 3,391,580 | 3,114,271 | 110.71 | 84.71 | 447.1 | 1,096.9 | ||||||||
| 2021 | 9,758,906 | 10,909,327 | 4,432,529 | 5,484,661 | 117.80 | 121.26 | 493.9 | 956.3 | ||||||||
| (1) | 2021-2025 principal executive officer (“PEO”): M. Speetzen |
| (2) | The non-PEO named executive officers (“NEOs”) reflects the following individuals
in each year: 2025: R. Mack, M. Dougherty, B. Duke, and J. Williams 2024: R. Mack, K. Pucel, S. Menneto, S. Eastman, M. Dougherty, and J. Williams 2023: R. Mack, K. Pucel, S. Menneto, and S. Eastman 2022: R. Mack, K. Pucel, S. Menneto, and S. Eastman 2021: R. Mack, K. Pucel, S. Menneto, and L. Clark Dougherty |
| (4) | For each year, our cumulative Total Shareholder Return (“TSR”) was calculated for a period beginning with our closing price on NYSE on December 31, 2020 through and including the last day of such year (each one-year, two-year, three-year, four-year, and five-year period, a “Measurement Period”), assuming dividend reinvestment. Each of these yearly percentage changes was then applied to a deemed fixed investment of $100 at the beginning of the Measurement Period to produce the year-end value of such investment as of the end of 2025, 2024, 2023, 2022, and 2021, as applicable. Because years are presented in the table in reverse chronological order (from top to bottom), the table should be read from bottom to top for purposes of understanding cumulative returns over time. The peer group TSR set forth in this table utilizes the S&P Composite 1500 Leisure Products Index, which we also utilize in the stock performance graph required by Item 201(e) of Regulation S-K included in our Annual Report for the year ended December 31, 2025. Historical stock performance is not necessarily indicative of future stock performance. |
| (3) | Compensation Actually Paid (“CAP”) illustrated in the table above for 2025 is calculated by making the following adjustments from the Summary Compensation Table (“SCT”) totals as follows: |
| Item and Value Added (Deducted) | 2025 | |||
| For PEO: | Speetzen | |||
| - SCT “Stock Awards” column value | $ | 3,292,784 | ||
| - SCT “Option Awards” column value | $ | 3,661,011 | ||
| + Covered Year-end fair value of outstanding equity awards granted in Covered Year | $ | 10,420,907 | ||
| +/- change in fair value (from prior year-end to Covered Year-end) of Covered Year-end outstanding equity awards granted prior to Covered Year | $ | 336,146 | ||
| +/- change in fair value (from prior year-end to vesting date in Covered Year) of equity awards granted in years prior to Covered Year that vested in Covered Year | $ | (421,604) | ||
| For Non-PEO Named Executive Officers (Average): | ||||
| - SCT “Stock Awards” column value | $ | 1,295,187 | ||
| - SCT “Option Awards” column value | $ | 960,007 | ||
| + Covered Year-end fair value of outstanding equity awards granted in Covered Year | $ | 3,329,446 | ||
| +/- change in fair value (from prior year-end to Covered Year-end) of Covered Year-end outstanding equity awards granted prior to Covered Year | $ | 72,470 | ||
| +/- change in fair value (from prior year-end to vesting date in Covered Year) of equity awards granted in years prior to Covered Year that vested in Covered Year | $ | (97,726) | ||
Relationship Between PEO and Non-PEO NEO CAP and TSR
The following chart sets forth the relationship between CAP for our PEO, the average of CAP for our Non-PEO NEOs, and the cumulative TSR over the five most recently completed fiscal years for the Company and the S&P 1500 Leisure TSR.
![]()
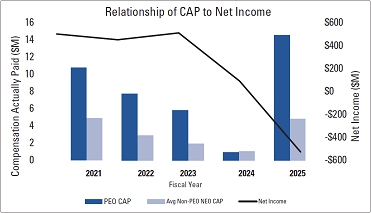
Relationship Between PEO and Non-PEO NEO CAP and Net Income
The following chart sets forth the relationship between CAP for our PEO, the average of CAP for our Non-PEO NEOs, and our net income during the five most recently completed fiscal years.
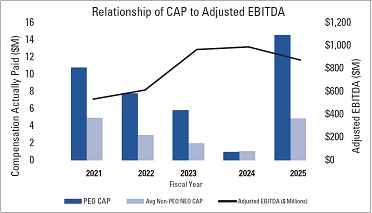
Relationship Between PEO and Non-PEO NEO CAP and Adjusted EBITDA ($ Millions)
The following chart sets forth the relationship between CAP for our PEO, the average of CAP for our Non-PEO NEOs, and our Adjusted EBITDA ($ Millions) during the five most recently completed fiscal years.
Tabular List of Most Important Financial Performance Measures
The following table presents the financial performance measures that the Company considers to have been the most important in linking CAP for our PEO and Non-PEO NEOs for 2025 to Company performance. The measures in this table are not ranked.
| Most Important Performance Measures |
| Relative Total Shareholder Return (TSR) |
| Adjusted EBITDA* |
| Revenue |
| * | Non-GAAP measures defined in the “2025 Performance Metrics and Target Bonus Amounts” section of the CD&A on page 42 |
| (6) | We determined Adjusted EBITDA to be the most important financial performance measure used to link Company performance to CAP to our PEO and Non-PEO NEOs in 2025. Adjusted EBITDA is a non-GAAP measure and is defined in the “2025 Performance Metrics and Target Bonus Amounts” section of the CD&A on page 42. Adjusted EBITDA may not have been the most important financial performance measure for years prior to 2025, and we may determine a different financial performance measure to be the most important financial performance measure in future years. |