Average | Value of Initial Fixed $100 | |||||||
Summary | Average | Investment Based On: | Adjusted | |||||
Summary | Compensation | Compensation | Peer Group | Operating | ||||
Compensation | Compensation | Table Total for | Actually Paid | Total | Total | Income | ||
Table Total for | Actually Paid | Non-PEO | to Non-PEO | Shareholder | Shareholder | Net Income | (AOI) | |
PEO(1) | to PEO(2) | NEOs(3) | NEOs(2) | Return(4) | Return(4) | (millions) | (millions)(5) | |
Year | ($) | ($) | ($) | ($) | ($) | ($) | ($) | ($) |
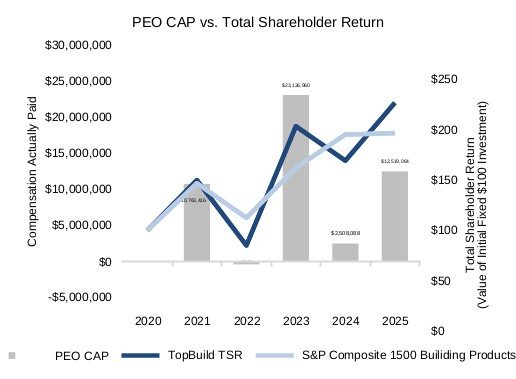
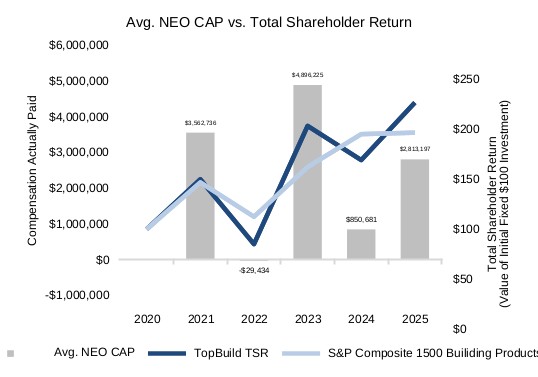
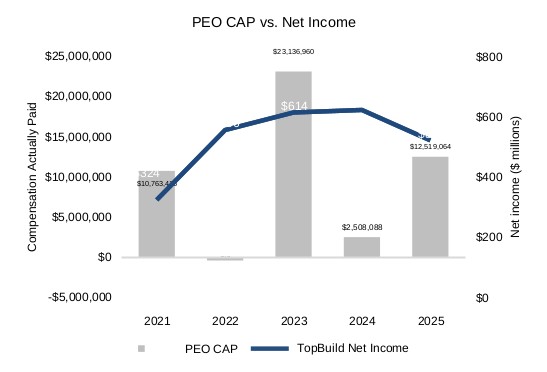
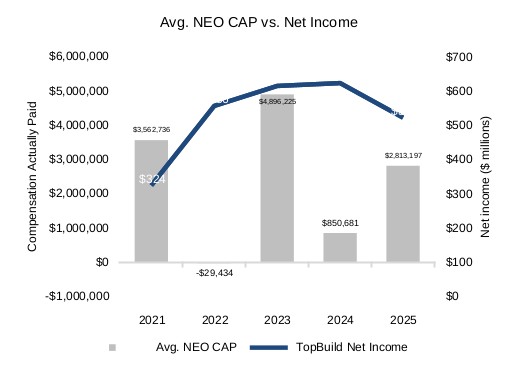
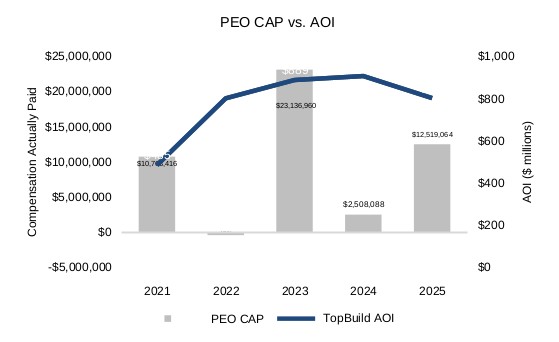
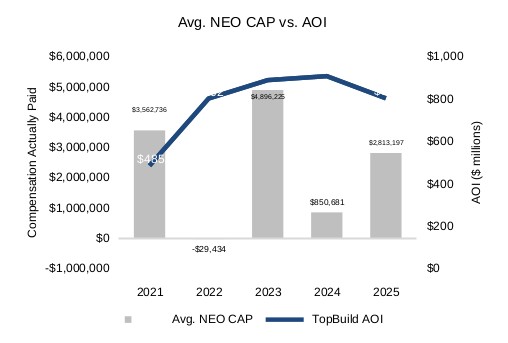
2025 | $7,873,810 | $12,519,064 | $1,903,744 | $2,813,197 | $227 | $197 | $522 | $803 |
2024 | $7,494,364 | $2,508,088 | $1,879,793 | $850,681 | $169 | $195 | $623 | $908 |
2023 | $7,777,624 | $23,136,960 | $1,992,115 | $4,896,225 | $203 | $162 | $614 | $889 |
2022 | $6,267,186 | ($394,693) | $1,808,545 | ($29,434) | $85 | $112 | $556 | $802 |
2021 | $4,729,324 | $10,763,416 | $1,480,184 | $3,562,736 | $150 | $147 | $324 | $485 |
(1) Our PEO in 2025, 2024, 2023, 2022 and 2021 is Mr. Buck.
(2) The amounts in this column reflect compensation as reported in the Summary Compensation Table, with the exception of equity awards. Equity award value adjustments are calculated in accordance with the SEC methodology for CAP for each year. Stock awards based on earnings per share and service are valued using the closing price of common stock on the valuation date and probable outcome of the performance condition. The value of stock options is calculated using a Black-Scholes model; the value of awards that vest based on our TSR performance relative to a peer group of companies is calculated using a Monte Carlo valuation model to represent the probable outcome and the closing price. Equity fair values are calculated with assumptions derived on a basis consistent with those used for grant date fair value purposes.
A reconciliation of the amounts reported in the Summary Compensation Table and CAP to the individuals who served as PEO and NEOs in 2025 is shown in the table below.
Reconciliation of SCT Compensation to CAP | 2025 | |
| PEO | NEO average |
Summary Compensation Table Total | $7,873,810 | $1,903,744 |
Deduct Equity Awards: | ||
Amounts reported in the “Stock Awards” column in the SCT for applicable FY | $5,657,285 | $1,034,506 |
Amounts reported in the “Option Awards” column in the SCT for applicable FY | $0 | $0 |
Add back: Change in Fair Value | ||
Year End Fair Value of Current Year Equity Awards | $6,194,748 | $1,132,785 |
Year over Year Change in Fair Value of Outstanding and Unvested Equity Awards | $5,540,713 | $1,048,047 |
Year over Year Change in Fair Value of Equity Awards Granted in Prior Year that Vested in the Year | $(1,432,922) | $(236,873) |
Fair Value as of Vesting Date of Equity Awards Granted and Vested in the Year | $0 | $0 |
Fair Value at the End of the Prior Year of Equity Awards that Failed to Meet Vesting Conditions in the Year | $0 | $0 |
Average Value of Dividends or other Earnings Paid on Stock or Option Awards not Otherwise Reflected in Fair Value or Total Compensation | $0 | $0 |
Compensation Actually Paid (CAP) | $12,519,064 | $2,813,197 |
(3) Our non-PEO NEOs in 2025, 2024 and 2023 are Messrs. Kuhns, Raia, Viselli and Machado; in 2022 are Messrs. Kuhns, Machado, Raia, Mr. Franklin, who retired on October 1, 2024, and Mr. Peterson, who retired on September 30, 2022; and in 2021 are Messrs. Peterson, Machado, Raia, and Franklin.
(4) The S&P Composite 1500 Building Products Index is used as our Total Shareholder Return peer group.
(5) dollars, which represents 30% of our AIP bonus, is our Company selected performance measure. A reconciliation of Operating Income as reported in our 10-K to AOI is shown in the table below.
Reconciliation of Reported Operating Income to AOI | |||||
Numbers in 000's | 2021 | 2022 | 2023 | 2024 | 2025 |
Operating Income, as reported (see Annual 10K Report) | $476,419 | $797,164 | $878,825 | $886,343 | $791,934 |
Adjustments: |
|
|
| ||
Non GAAP Charges related to M&A | $38,164 | $7,974 | $19,698 | $31,109 | $44,331 |
M&A not included in Business Plan | -$23,848 | -$2,968 | -$9,718 | -$9,821 | -$33,202 |
Cost of Legal Settlement | -$6,000 | $0 | $0 | $0 | $0 |
Adjusted Operating Income (AOI) | $484,735 | $802,170 | $888,805 | $907,631 | $803,063 |
(1) Our PEO in 2025, 2024, 2023, 2022 and 2021 is Mr. Buck.
(3) Our non-PEO NEOs in 2025, 2024 and 2023 are Messrs. Kuhns, Raia, Viselli and Machado; in 2022 are Messrs. Kuhns, Machado, Raia, Mr. Franklin, who retired on October 1, 2024, and Mr. Peterson, who retired on September 30, 2022; and in 2021 are Messrs. Peterson, Machado, Raia, and Franklin.
(4) The S&P Composite 1500 Building Products Index is used as our Total Shareholder Return peer group.
A reconciliation of the amounts reported in the Summary Compensation Table and CAP to the individuals who served as PEO and NEOs in 2025 is shown in the table below.
Reconciliation of SCT Compensation to CAP | 2025 | |
| PEO | NEO average |
Summary Compensation Table Total | $7,873,810 | $1,903,744 |
Deduct Equity Awards: | ||
Amounts reported in the “Stock Awards” column in the SCT for applicable FY | $5,657,285 | $1,034,506 |
Amounts reported in the “Option Awards” column in the SCT for applicable FY | $0 | $0 |
Add back: Change in Fair Value | ||
Year End Fair Value of Current Year Equity Awards | $6,194,748 | $1,132,785 |
Year over Year Change in Fair Value of Outstanding and Unvested Equity Awards | $5,540,713 | $1,048,047 |
Year over Year Change in Fair Value of Equity Awards Granted in Prior Year that Vested in the Year | $(1,432,922) | $(236,873) |
Fair Value as of Vesting Date of Equity Awards Granted and Vested in the Year | $0 | $0 |
Fair Value at the End of the Prior Year of Equity Awards that Failed to Meet Vesting Conditions in the Year | $0 | $0 |
Average Value of Dividends or other Earnings Paid on Stock or Option Awards not Otherwise Reflected in Fair Value or Total Compensation | $0 | $0 |
Compensation Actually Paid (CAP) | $12,519,064 | $2,813,197 |
From 2021 to 2022, CAP and TopBuild TSR both decreased. For 2023, CAP and TopBuild TSR both increased. For 2024, CAP and TopBuild TSR both decreased. For 2025, CAP and TopBuild TSR both increased.
Over the 2021 to 2022 time period, CAP for TopBuild decreased. Over the same period, Company net income increased annually. For 2023, CAP and Company net income both increased. For 2024, CAP decreased while Company net income increased. For 2025, CAP increased while Company net income decreased.
Over the 2021 to 2022 time period, CAP for TopBuild decreased. Over the same period, AOI increased annually. For 2023, CAP and AOI both increased. For 2024, CAP decreased while AOI increased. For 2025, CAP increased while AOI decreased.
From 2021 to 2022, CAP and TopBuild TSR both decreased. For 2023, CAP and TopBuild TSR both increased. For 2024, CAP and TopBuild TSR both decreased. For 2025, CAP and TopBuild TSR both increased.
(5) dollars, which represents 30% of our AIP bonus, is our Company selected performance measure. A reconciliation of Operating Income as reported in our 10-K to AOI is shown in the table below.