Value of Initial Fixed | |||||||||||||||||||||
Average | Average | $100 Investment | |||||||||||||||||||
Summary | Summary | Summary | Compensation | Based on: | |||||||||||||||||
Compensation | Compensation | Compensation | Compensation | Compensation | Actually Paid | Total | Peer Group | ||||||||||||||
Table Total for | Table Total for | Actually Paid | Actually Paid | Table Total for | to Non-PEO | Shareholder | Shareholder | Net | Diluted | ||||||||||||
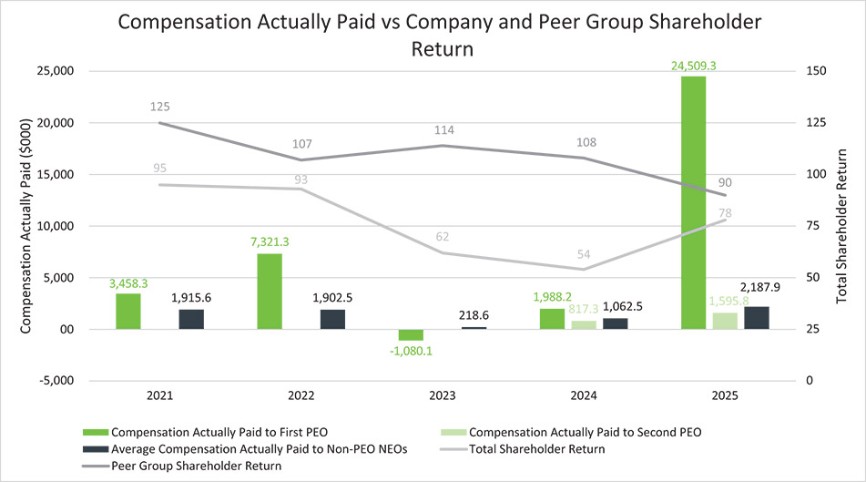
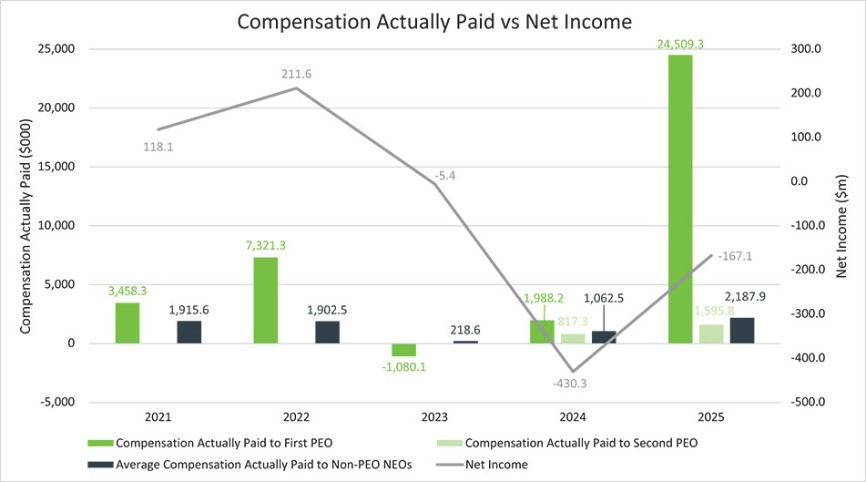
| Year | | First PEO(1) | | Second PEO(1) | | to First PEO | | to Second PEO | | Non-PEO NEOs | | NEOs | | Return | | Return(2) | | Income(3) | | EPS |
2025 | 12,839,719 | 1,065,486 | 24,509,304 | 1,595,756 | 1,513,190 | 2,187,869 | 78 | 90 | (167.1) | (4.61) | |||||||||||
2024 |
| 2,035,442 | 6,294,390 | 1,988,228 | 817,276 | 1,492,742 | 1,062,511 | 54 | 108 | (430.3) | (11.85) | ||||||||||
2023 |
| 5,291,042 |
| n/a |
| (1,080,067) |
| n/a |
| 1,718,066 |
| 218,609 |
| 62 |
| 114 |
| (5.4) |
| (0.15) | |
2022 |
| 5,394,470 |
| n/a |
| 7,321,335 |
| n/a |
| 1,632,294 |
| 1,902,483 |
| 93 |
| 107 |
| 211.6 |
| 5.50 | |
2021 |
| 4,822,288 |
| n/a |
| 3,458,254 |
| n/a |
| 2,158,730 |
| 1,915,624 |
| 95 |
| 125 |
| 118.1 |
| 2.95 | |
| (1) | Represents the amount reported for each of the corresponding years in the “Total” column of the Summary Compensation Table for David H. Li (CEO) and Luis Fernandez-Moreno (former interim CEO) the Company’s PEOs in fiscal year 2025, Luis Fernandez-Moreno (former interim CEO) and John C. Fortson (former CEO), the Company’s PEOs in fiscal year 2024, and for John C. Fortson, the Company’s PEO during fiscal years 2023, 2022, and 2021. |
| (2) | The peer group used for this purpose is the following published industry index: S&P 600 Chemicals Index. |
| (3) | Represents the amount of Net Income reflected in the Company’s audited financial statements for the applicable year. |
The table below shows the additions and deductions to calculate Compensation Actually Paid as well as the executives covered in each fiscal year.(4)
2021 | 2022 | 2023 | 2024 | 2025 | |||||||||||||||||||||
Average | Average | Average | Average | Average | |||||||||||||||||||||
Non-PEO | Non-PEO | Non-PEO | Non-PEO | Non-PEO | |||||||||||||||||||||
1st PEO | NEO | 1st PEO | NEO | 1st PEO | NEO | 1st PEO | 2nd PEO | NEO | 1st PEO | 2nd PEO | NEO | ||||||||||||||
Mary | Mary | ||||||||||||||||||||||||
Dean Hall; | Mary | Mary | Dean Hall; | Mary | |||||||||||||||||||||
Stacy L. | Dean Hall; | Dean Hall; | Stacy L. | Dean Hall; | |||||||||||||||||||||
Cozad; | Stacy L. | Stacy L. | Cozad; | S. Edward | |||||||||||||||||||||
Michael P. | Cozad; | Cozad; | S. Edward | Woodcock; | |||||||||||||||||||||
Smith; | S. Edward | Rich White; | Luis | Woodcock; | Luis | Rich White; | |||||||||||||||||||
John C. | S. Edward | John C. | Woodcock; | John C. | S. Edward | Fernandez- | John C. | Rich White; | Fernandez- | Ryan Fisher; | |||||||||||||||
| Fortson | Woodcock | Fortson |
| Rich White | Fortson | Woodcock | Moreno | Fortson | Ryan Fisher | David Li | Moreno |
| Terry Dyer | |||||||||||
SCT Total | | 4,822,288 | | 2,158,730 | | 5,394,470 | | 1,632,294 | | 5,291,042 | | 1,718,066 | | 2,035,442 | | 6,294,390 | | 1,492,742 | | 12,839,719 | | 1,065,486 | | 1,513,190 | |
Deduction for Amounts Reported under the “Stock Awards” and “Option Awards” Columns in the Summary Compensation Table for Applicable FY |
| (2,475,054) |
| (1,077,066) |
| (2,820,065) |
| (630,718) |
| (4,000,032) |
| (1,049,604) |
| (1,135,076) | (4,683,951) |
| (829,969) |
| (10,500,093) |
| (135,017) |
| (679,927) | ||
Increase of Fair Value of Awards Granted during Applicable FY that Remain Unvested as of Applicable FY End, determined as of Applicable FY End |
| 2,360,413 |
| 1,051,388 |
| 3,312,410 |
| 735,497 |
| 1,227,626 |
| 282,949 |
| 1,087,862 | 0 |
| 558,077 |
| 22,169,678 |
| 240,093 |
| 1,022,634 | ||
Increase of Fair Value of Awards Granted during Applicable FY that Vested as of Applicable FY End, determined as of Applicable FY End |
| 0 |
| 0 |
| 0 |
| 0 |
| 0 |
| 0 |
| 0 | 0 |
| 0 |
| 0 |
| 0 |
| 0 | ||
Increase/deduction for Awards Granted during Prior FYs that were Outstanding and Unvested as of Applicable FY End, determined based on change in Fair Value from Prior FY End to Applicable FY End | (1,109,324) | (178,326) | 1,512,795 | 196,153 | (3,874,416) | (820,193) | 0 | (154,637) | (41,541) | 0 | 204,997 | 302,841 | |||||||||||||
Increase/deduction for Awards Granted during Prior FYs that Vested During Applicable FY, determined based on change in Fair Value from Prior FY End to Vesting Date | (140,069) | (39,102) | (78,275) | (30,741) | 481,618 | 104,701 | 0 | 267,327 | (3,635) | 0 | 220,196 | 51,404 | |||||||||||||
Deduction of Fair Value of Awards Granted during Prior FY that were Forfeited during Applicable FY, determined as of Prior FY End | 0 | 0 | 0 | 0 | (205,906) | (17,310) | 0 | (905,853) | (113,163) | 0 | 0 | (22,273) | |||||||||||||
Increase based on Dividends or Other Earnings Paid during Applicable FY prior to Vesting Date | 0 | 0 | 0 | 0 | 0 | 0 | 0 | 0 | 0 | 0 | 0 | 0 | |||||||||||||
Increase based on Incremental Fair Value of Options/SARs Modified during Applicable FY | 0 | 0 | 0 | 0 | 0 | 0 | 0 | 0 | 0 | 0 | 0 | 0 | |||||||||||||
Deduction for Change in the Actuarial Present Values reported under the "Change in Pension Value and Nonqualified Deferred Compensation Earnings" Column of the Summary Compensation Table for Applicable FY | 0 | 0 | 0 | 0 | 0 | 0 | 0 | 0 | 0 | 0 | 0 | 0 | |||||||||||||
Increase for Service Cost and, if applicable, Prior Service Cost for Pension Plans | 0 | 0 | 0 | 0 | 0 | 0 | 0 | 0 | 0 | 0 | 0 | 0 | |||||||||||||
Total Adjustments | (1,364,034) | (243,106) | 1,926,865 | 270,190 | (6,371,109) | (1,499,457) | (47,214) | (5,477,114) | (430,231) | 11,669,585 | 530,269 | 674,679 | |||||||||||||
Compensation Actually Paid | 3,458,254 | 1,915,624 | 7,321,335 | 1,902,483 | (1,080,067) | 218,609 | 1,988,228 | 817,276 | 1,062,511 | 24,509,304 | 1,595,756 | 2,187,869 | |||||||||||||
| (4) | Equity values are calculated in accordance with FASB ASC Topic 718, and the valuation assumptions used to calculate fair values did not materially differ from those disclosed at the time of the grant. |
Pay Versus Performance are estimated at close-day stock price as of 12/31/2025, calculations are subject to change)
2021 | 2022 | 2023 | 2024 | 2025 | ||||||||||||||||||||||
Average | Average | Average | Average | Average | ||||||||||||||||||||||
Non-PEO | Non-PEO | Non-PEO | Non-PEO | Non-PEO | ||||||||||||||||||||||
1st PEO | NEO | 1st PEO | NEO | 1st PEO | NEO | 1st PEO | 2nd PEO | NEO | 1st PEO | 2nd PEO | NEO | |||||||||||||||
Mary | Mary | Mary | ||||||||||||||||||||||||
Dean Hall; | Dean Hall; | Mary | Dean Hall; | Mary | ||||||||||||||||||||||
Stacy L. | Stacy L. | Dean Hall; | Stacy | Dean Hall; | ||||||||||||||||||||||
Cozad; | Cozad; | Stacy L. | L. Cozad; | S. Edward | ||||||||||||||||||||||
Michael P. | Michael P. | Cozad; | S. Edward | Woodcock; | ||||||||||||||||||||||
Smith; | Smith; | S. Edward | Luis | Woodcock; | Luis | Rich White; | ||||||||||||||||||||
John C. | S. Edward | John C. | S. Edward | John C. | Woodcock; | Fernandez- | John C. | Rich White; | David H. | Fernandez- | Ryan Fisher; | |||||||||||||||
| Fortson | Woodcock | Fortson | Woodcock | Fortson | Rich White | Moreno | Fortson | Ryan Fisher | Li | Moreno | Terry Dyer | ||||||||||||||
Increase/deduction for Awards Granted during Prior FYs that were Outstanding and Unvested as of Applicable FY End, determined based on change in Fair Value from Prior FY End to Applicable FY End | | (1,109,324) | | | (178,326) | | 1,512,795 | | 196,153 | | (3,874,416) | | (820,193) | | 0 | (154,637) | | (820,193) | | 0 | | 204,997 | | 302,841 | ||
Increase/deduction for Awards Granted during Prior FYs that Vested During Applicable FY, determined based on change in Fair Value from Prior FY End to Vesting Date |
| (140,069) |
|
| (39,102) |
| (78,275) |
| (30,741) |
| 481,618 |
| 104,701 |
| 0 | 267,327 |
| 104,701 |
| 0 |
| 220,196 |
| 51,404 | ||
Deduction of Fair Value of Awards Granted during Prior FY that were Forfeited during Applicable FY, determined as of Prior FY End |
| 0 |
|
| 0 |
| 0 |
| 0 |
| (205,906) |
| (17,310) |
| 0 | (905,853) |
| (17,310) |
| 0 |
| 0 |
| (22,273) | ||
Increase based on Dividends or Other Earnings Paid during Applicable FY prior to Vesting Date |
| 0 |
|
| 0 |
| 0 |
| 0 |
| 0 |
| 0 |
| 0 | 0 |
| 0 |
| 0 |
| 0 |
| 0 | ||
Increase based on Incremental Fair Value of Options/ SARs Modified during Applicable FY |
| 0 |
|
| 0 |
| 0 |
| 0 |
| 0 |
| 0 |
| 0 | 0 |
| 0 |
| 0 |
| 0 |
| 0 | ||
2021 | 2022 | 2023 | 2024 | 2025 | |||||||||||||||||||||
Average | Average | Average | Average | Average | |||||||||||||||||||||
Non-PEO | Non-PEO | Non-PEO | Non-PEO | Non-PEO | |||||||||||||||||||||
1st PEO | NEO | 1st PEO | NEO | 1st PEO | NEO | 1st PEO | 2nd PEO | NEO | 1st PEO | 2nd PEO | NEO | ||||||||||||||
Mary | Mary | ||||||||||||||||||||||||
Dean Hall; | Mary | Dean Hall; | Mary | ||||||||||||||||||||||
Stacy L. | Dean Hall; | Mary | Stacy | Dean Hall; | |||||||||||||||||||||
Cozad; | Stacy L. | Dean Hall; | L. Cozad; | S. Edward | |||||||||||||||||||||
Michael P. | Cozad; | Stacy L. | S. Edward | Woodcock; | |||||||||||||||||||||
Smith; | S. Edward | Cozad; | Luis | Woodcock; | Luis | Rich White; | |||||||||||||||||||
John C. | S. Edward | John C. | Woodcock; | John C. | Rich White; S. Edward | Fernandez- | John C. | Rich White; | David H. | Fernandez- | Ryan Fisher; | ||||||||||||||
| Fortson | Woodcock | Fortson | Rich White | Fortson | Woodcock | Moreno | Fortson | Ryan Fisher | Li | Moreno | Terry Dyer | |||||||||||||
Deduction for Change in the Actuarial Present Values reported under the “Change in Pension Value and Nonqualified Deferred Compensation Earnings” Column of the Summary Compensation Table for Applicable FY | | 0 | | 0 | | 0 | | 0 | | 0 | | 0 | | 0 | 0 | | 0 | | 0 | | 0 | | 0 | ||
Increase for Service Cost and, if applicable, Prior Service Cost for Pension Plans |
| 0 |
| 0 |
| 0 |
| 0 |
| 0 |
| 0 |
| 0 | 0 |
| 0 |
| 0 |
| 0 |
| 0 | ||
Total Adjustments |
| (1,364,034) |
| (243,106) |
| 1,926,865 |
| 270,190 |
| (6,371,109) |
| (1,499,457) |
| (47,214) | (5,477,114) |
| (430,231) |
| 11,669,585 |
| 530,269 |
| 674,679 | ||
Compensation Actually Paid |
| 3,458,254 |
| 1,915,624 |
| 7,321,335 |
| 1,902,483 |
| (1,080,067) |
| 218,609 |
| 1,988,228 | 817,276 |
| 1,062,511 |
| 24,509,304 |
| 1,595,756 |
| 2,187,869 | ||
| (3) | Equity values are calculated in accordance with FASB ASC Topic 718, and the valuation assumptions used to calculate fair values did not materially differ from those disclosed at the time of the grant. |
| (1) | Represents the amount reported for each of the corresponding years in the “Total” column of the Summary Compensation Table for David H. Li (CEO) and Luis Fernandez-Moreno (former interim CEO) the Company’s PEOs in fiscal year 2025, Luis Fernandez-Moreno (former interim CEO) and John C. Fortson (former CEO), the Company’s PEOs in fiscal year 2024, and for John C. Fortson, the Company’s PEO during fiscal years 2023, 2022, and 2021. |
| (2) | The peer group used for this purpose is the following published industry index: S&P 600 Chemicals Index. |
2021 | 2022 | 2023 | 2024 | 2025 | |||||||||||||||||||||
Average | Average | Average | Average | Average | |||||||||||||||||||||
Non-PEO | Non-PEO | Non-PEO | Non-PEO | Non-PEO | |||||||||||||||||||||
1st PEO | NEO | 1st PEO | NEO | 1st PEO | NEO | 1st PEO | 2nd PEO | NEO | 1st PEO | 2nd PEO | NEO | ||||||||||||||
Mary | Mary | ||||||||||||||||||||||||
Dean Hall; | Mary | Mary | Dean Hall; | Mary | |||||||||||||||||||||
Stacy L. | Dean Hall; | Dean Hall; | Stacy L. | Dean Hall; | |||||||||||||||||||||
Cozad; | Stacy L. | Stacy L. | Cozad; | S. Edward | |||||||||||||||||||||
Michael P. | Cozad; | Cozad; | S. Edward | Woodcock; | |||||||||||||||||||||
Smith; | S. Edward | Rich White; | Luis | Woodcock; | Luis | Rich White; | |||||||||||||||||||
John C. | S. Edward | John C. | Woodcock; | John C. | S. Edward | Fernandez- | John C. | Rich White; | Fernandez- | Ryan Fisher; | |||||||||||||||
| Fortson | Woodcock | Fortson |
| Rich White | Fortson | Woodcock | Moreno | Fortson | Ryan Fisher | David Li | Moreno |
| Terry Dyer | |||||||||||
SCT Total | | 4,822,288 | | 2,158,730 | | 5,394,470 | | 1,632,294 | | 5,291,042 | | 1,718,066 | | 2,035,442 | | 6,294,390 | | 1,492,742 | | 12,839,719 | | 1,065,486 | | 1,513,190 | |
Deduction for Amounts Reported under the “Stock Awards” and “Option Awards” Columns in the Summary Compensation Table for Applicable FY |
| (2,475,054) |
| (1,077,066) |
| (2,820,065) |
| (630,718) |
| (4,000,032) |
| (1,049,604) |
| (1,135,076) | (4,683,951) |
| (829,969) |
| (10,500,093) |
| (135,017) |
| (679,927) | ||
Increase of Fair Value of Awards Granted during Applicable FY that Remain Unvested as of Applicable FY End, determined as of Applicable FY End |
| 2,360,413 |
| 1,051,388 |
| 3,312,410 |
| 735,497 |
| 1,227,626 |
| 282,949 |
| 1,087,862 | 0 |
| 558,077 |
| 22,169,678 |
| 240,093 |
| 1,022,634 | ||
Increase of Fair Value of Awards Granted during Applicable FY that Vested as of Applicable FY End, determined as of Applicable FY End |
| 0 |
| 0 |
| 0 |
| 0 |
| 0 |
| 0 |
| 0 | 0 |
| 0 |
| 0 |
| 0 |
| 0 | ||
Increase/deduction for Awards Granted during Prior FYs that were Outstanding and Unvested as of Applicable FY End, determined based on change in Fair Value from Prior FY End to Applicable FY End | (1,109,324) | (178,326) | 1,512,795 | 196,153 | (3,874,416) | (820,193) | 0 | (154,637) | (41,541) | 0 | 204,997 | 302,841 | |||||||||||||
Increase/deduction for Awards Granted during Prior FYs that Vested During Applicable FY, determined based on change in Fair Value from Prior FY End to Vesting Date | (140,069) | (39,102) | (78,275) | (30,741) | 481,618 | 104,701 | 0 | 267,327 | (3,635) | 0 | 220,196 | 51,404 | |||||||||||||
Deduction of Fair Value of Awards Granted during Prior FY that were Forfeited during Applicable FY, determined as of Prior FY End | 0 | 0 | 0 | 0 | (205,906) | (17,310) | 0 | (905,853) | (113,163) | 0 | 0 | (22,273) | |||||||||||||
Increase based on Dividends or Other Earnings Paid during Applicable FY prior to Vesting Date | 0 | 0 | 0 | 0 | 0 | 0 | 0 | 0 | 0 | 0 | 0 | 0 | |||||||||||||
Increase based on Incremental Fair Value of Options/SARs Modified during Applicable FY | 0 | 0 | 0 | 0 | 0 | 0 | 0 | 0 | 0 | 0 | 0 | 0 | |||||||||||||
Deduction for Change in the Actuarial Present Values reported under the "Change in Pension Value and Nonqualified Deferred Compensation Earnings" Column of the Summary Compensation Table for Applicable FY | 0 | 0 | 0 | 0 | 0 | 0 | 0 | 0 | 0 | 0 | 0 | 0 | |||||||||||||
Increase for Service Cost and, if applicable, Prior Service Cost for Pension Plans | 0 | 0 | 0 | 0 | 0 | 0 | 0 | 0 | 0 | 0 | 0 | 0 | |||||||||||||
Total Adjustments | (1,364,034) | (243,106) | 1,926,865 | 270,190 | (6,371,109) | (1,499,457) | (47,214) | (5,477,114) | (430,231) | 11,669,585 | 530,269 | 674,679 | |||||||||||||
Compensation Actually Paid | 3,458,254 | 1,915,624 | 7,321,335 | 1,902,483 | (1,080,067) | 218,609 | 1,988,228 | 817,276 | 1,062,511 | 24,509,304 | 1,595,756 | 2,187,869 | |||||||||||||
| (4) | Equity values are calculated in accordance with FASB ASC Topic 718, and the valuation assumptions used to calculate fair values did not materially differ from those disclosed at the time of the grant. |
Pay Versus Performance are estimated at close-day stock price as of 12/31/2025, calculations are subject to change)
2021 | 2022 | 2023 | 2024 | 2025 | ||||||||||||||||||||||
Average | Average | Average | Average | Average | ||||||||||||||||||||||
Non-PEO | Non-PEO | Non-PEO | Non-PEO | Non-PEO | ||||||||||||||||||||||
1st PEO | NEO | 1st PEO | NEO | 1st PEO | NEO | 1st PEO | 2nd PEO | NEO | 1st PEO | 2nd PEO | NEO | |||||||||||||||
Mary | Mary | Mary | ||||||||||||||||||||||||
Dean Hall; | Dean Hall; | Mary | Dean Hall; | Mary | ||||||||||||||||||||||
Stacy L. | Stacy L. | Dean Hall; | Stacy | Dean Hall; | ||||||||||||||||||||||
Cozad; | Cozad; | Stacy L. | L. Cozad; | S. Edward | ||||||||||||||||||||||
Michael P. | Michael P. | Cozad; | S. Edward | Woodcock; | ||||||||||||||||||||||
Smith; | Smith; | S. Edward | Luis | Woodcock; | Luis | Rich White; | ||||||||||||||||||||
John C. | S. Edward | John C. | S. Edward | John C. | Woodcock; | Fernandez- | John C. | Rich White; | David H. | Fernandez- | Ryan Fisher; | |||||||||||||||
| Fortson | Woodcock | Fortson | Woodcock | Fortson | Rich White | Moreno | Fortson | Ryan Fisher | Li | Moreno | Terry Dyer | ||||||||||||||
Increase/deduction for Awards Granted during Prior FYs that were Outstanding and Unvested as of Applicable FY End, determined based on change in Fair Value from Prior FY End to Applicable FY End | | (1,109,324) | | | (178,326) | | 1,512,795 | | 196,153 | | (3,874,416) | | (820,193) | | 0 | (154,637) | | (820,193) | | 0 | | 204,997 | | 302,841 | ||
Increase/deduction for Awards Granted during Prior FYs that Vested During Applicable FY, determined based on change in Fair Value from Prior FY End to Vesting Date |
| (140,069) |
|
| (39,102) |
| (78,275) |
| (30,741) |
| 481,618 |
| 104,701 |
| 0 | 267,327 |
| 104,701 |
| 0 |
| 220,196 |
| 51,404 | ||
Deduction of Fair Value of Awards Granted during Prior FY that were Forfeited during Applicable FY, determined as of Prior FY End |
| 0 |
|
| 0 |
| 0 |
| 0 |
| (205,906) |
| (17,310) |
| 0 | (905,853) |
| (17,310) |
| 0 |
| 0 |
| (22,273) | ||
Increase based on Dividends or Other Earnings Paid during Applicable FY prior to Vesting Date |
| 0 |
|
| 0 |
| 0 |
| 0 |
| 0 |
| 0 |
| 0 | 0 |
| 0 |
| 0 |
| 0 |
| 0 | ||
Increase based on Incremental Fair Value of Options/ SARs Modified during Applicable FY |
| 0 |
|
| 0 |
| 0 |
| 0 |
| 0 |
| 0 |
| 0 | 0 |
| 0 |
| 0 |
| 0 |
| 0 | ||
2021 | 2022 | 2023 | 2024 | 2025 | |||||||||||||||||||||
Average | Average | Average | Average | Average | |||||||||||||||||||||
Non-PEO | Non-PEO | Non-PEO | Non-PEO | Non-PEO | |||||||||||||||||||||
1st PEO | NEO | 1st PEO | NEO | 1st PEO | NEO | 1st PEO | 2nd PEO | NEO | 1st PEO | 2nd PEO | NEO | ||||||||||||||
Mary | Mary | ||||||||||||||||||||||||
Dean Hall; | Mary | Dean Hall; | Mary | ||||||||||||||||||||||
Stacy L. | Dean Hall; | Mary | Stacy | Dean Hall; | |||||||||||||||||||||
Cozad; | Stacy L. | Dean Hall; | L. Cozad; | S. Edward | |||||||||||||||||||||
Michael P. | Cozad; | Stacy L. | S. Edward | Woodcock; | |||||||||||||||||||||
Smith; | S. Edward | Cozad; | Luis | Woodcock; | Luis | Rich White; | |||||||||||||||||||
John C. | S. Edward | John C. | Woodcock; | John C. | Rich White; S. Edward | Fernandez- | John C. | Rich White; | David H. | Fernandez- | Ryan Fisher; | ||||||||||||||
| Fortson | Woodcock | Fortson | Rich White | Fortson | Woodcock | Moreno | Fortson | Ryan Fisher | Li | Moreno | Terry Dyer | |||||||||||||
Deduction for Change in the Actuarial Present Values reported under the “Change in Pension Value and Nonqualified Deferred Compensation Earnings” Column of the Summary Compensation Table for Applicable FY | | 0 | | 0 | | 0 | | 0 | | 0 | | 0 | | 0 | 0 | | 0 | | 0 | | 0 | | 0 | ||
Increase for Service Cost and, if applicable, Prior Service Cost for Pension Plans |
| 0 |
| 0 |
| 0 |
| 0 |
| 0 |
| 0 |
| 0 | 0 |
| 0 |
| 0 |
| 0 |
| 0 | ||
Total Adjustments |
| (1,364,034) |
| (243,106) |
| 1,926,865 |
| 270,190 |
| (6,371,109) |
| (1,499,457) |
| (47,214) | (5,477,114) |
| (430,231) |
| 11,669,585 |
| 530,269 |
| 674,679 | ||
Compensation Actually Paid |
| 3,458,254 |
| 1,915,624 |
| 7,321,335 |
| 1,902,483 |
| (1,080,067) |
| 218,609 |
| 1,988,228 | 817,276 |
| 1,062,511 |
| 24,509,304 |
| 1,595,756 |
| 2,187,869 | ||
| (3) | Equity values are calculated in accordance with FASB ASC Topic 718, and the valuation assumptions used to calculate fair values did not materially differ from those disclosed at the time of the grant. |
2021 | 2022 | 2023 | 2024 | 2025 | |||||||||||||||||||||
Average | Average | Average | Average | Average | |||||||||||||||||||||
Non-PEO | Non-PEO | Non-PEO | Non-PEO | Non-PEO | |||||||||||||||||||||
1st PEO | NEO | 1st PEO | NEO | 1st PEO | NEO | 1st PEO | 2nd PEO | NEO | 1st PEO | 2nd PEO | NEO | ||||||||||||||
Mary | Mary | ||||||||||||||||||||||||
Dean Hall; | Mary | Mary | Dean Hall; | Mary | |||||||||||||||||||||
Stacy L. | Dean Hall; | Dean Hall; | Stacy L. | Dean Hall; | |||||||||||||||||||||
Cozad; | Stacy L. | Stacy L. | Cozad; | S. Edward | |||||||||||||||||||||
Michael P. | Cozad; | Cozad; | S. Edward | Woodcock; | |||||||||||||||||||||
Smith; | S. Edward | Rich White; | Luis | Woodcock; | Luis | Rich White; | |||||||||||||||||||
John C. | S. Edward | John C. | Woodcock; | John C. | S. Edward | Fernandez- | John C. | Rich White; | Fernandez- | Ryan Fisher; | |||||||||||||||
| Fortson | Woodcock | Fortson |
| Rich White | Fortson | Woodcock | Moreno | Fortson | Ryan Fisher | David Li | Moreno |
| Terry Dyer | |||||||||||
SCT Total | | 4,822,288 | | 2,158,730 | | 5,394,470 | | 1,632,294 | | 5,291,042 | | 1,718,066 | | 2,035,442 | | 6,294,390 | | 1,492,742 | | 12,839,719 | | 1,065,486 | | 1,513,190 | |
Deduction for Amounts Reported under the “Stock Awards” and “Option Awards” Columns in the Summary Compensation Table for Applicable FY |
| (2,475,054) |
| (1,077,066) |
| (2,820,065) |
| (630,718) |
| (4,000,032) |
| (1,049,604) |
| (1,135,076) | (4,683,951) |
| (829,969) |
| (10,500,093) |
| (135,017) |
| (679,927) | ||
Increase of Fair Value of Awards Granted during Applicable FY that Remain Unvested as of Applicable FY End, determined as of Applicable FY End |
| 2,360,413 |
| 1,051,388 |
| 3,312,410 |
| 735,497 |
| 1,227,626 |
| 282,949 |
| 1,087,862 | 0 |
| 558,077 |
| 22,169,678 |
| 240,093 |
| 1,022,634 | ||
Increase of Fair Value of Awards Granted during Applicable FY that Vested as of Applicable FY End, determined as of Applicable FY End |
| 0 |
| 0 |
| 0 |
| 0 |
| 0 |
| 0 |
| 0 | 0 |
| 0 |
| 0 |
| 0 |
| 0 | ||
Increase/deduction for Awards Granted during Prior FYs that were Outstanding and Unvested as of Applicable FY End, determined based on change in Fair Value from Prior FY End to Applicable FY End | (1,109,324) | (178,326) | 1,512,795 | 196,153 | (3,874,416) | (820,193) | 0 | (154,637) | (41,541) | 0 | 204,997 | 302,841 | |||||||||||||
Increase/deduction for Awards Granted during Prior FYs that Vested During Applicable FY, determined based on change in Fair Value from Prior FY End to Vesting Date | (140,069) | (39,102) | (78,275) | (30,741) | 481,618 | 104,701 | 0 | 267,327 | (3,635) | 0 | 220,196 | 51,404 | |||||||||||||
Deduction of Fair Value of Awards Granted during Prior FY that were Forfeited during Applicable FY, determined as of Prior FY End | 0 | 0 | 0 | 0 | (205,906) | (17,310) | 0 | (905,853) | (113,163) | 0 | 0 | (22,273) | |||||||||||||
Increase based on Dividends or Other Earnings Paid during Applicable FY prior to Vesting Date | 0 | 0 | 0 | 0 | 0 | 0 | 0 | 0 | 0 | 0 | 0 | 0 | |||||||||||||
Increase based on Incremental Fair Value of Options/SARs Modified during Applicable FY | 0 | 0 | 0 | 0 | 0 | 0 | 0 | 0 | 0 | 0 | 0 | 0 | |||||||||||||
Deduction for Change in the Actuarial Present Values reported under the "Change in Pension Value and Nonqualified Deferred Compensation Earnings" Column of the Summary Compensation Table for Applicable FY | 0 | 0 | 0 | 0 | 0 | 0 | 0 | 0 | 0 | 0 | 0 | 0 | |||||||||||||
Increase for Service Cost and, if applicable, Prior Service Cost for Pension Plans | 0 | 0 | 0 | 0 | 0 | 0 | 0 | 0 | 0 | 0 | 0 | 0 | |||||||||||||
Total Adjustments | (1,364,034) | (243,106) | 1,926,865 | 270,190 | (6,371,109) | (1,499,457) | (47,214) | (5,477,114) | (430,231) | 11,669,585 | 530,269 | 674,679 | |||||||||||||
Compensation Actually Paid | 3,458,254 | 1,915,624 | 7,321,335 | 1,902,483 | (1,080,067) | 218,609 | 1,988,228 | 817,276 | 1,062,511 | 24,509,304 | 1,595,756 | 2,187,869 | |||||||||||||
| (4) | Equity values are calculated in accordance with FASB ASC Topic 718, and the valuation assumptions used to calculate fair values did not materially differ from those disclosed at the time of the grant. |
Pay Versus Performance are estimated at close-day stock price as of 12/31/2025, calculations are subject to change)
2021 | 2022 | 2023 | 2024 | 2025 | ||||||||||||||||||||||
Average | Average | Average | Average | Average | ||||||||||||||||||||||
Non-PEO | Non-PEO | Non-PEO | Non-PEO | Non-PEO | ||||||||||||||||||||||
1st PEO | NEO | 1st PEO | NEO | 1st PEO | NEO | 1st PEO | 2nd PEO | NEO | 1st PEO | 2nd PEO | NEO | |||||||||||||||
Mary | Mary | Mary | ||||||||||||||||||||||||
Dean Hall; | Dean Hall; | Mary | Dean Hall; | Mary | ||||||||||||||||||||||
Stacy L. | Stacy L. | Dean Hall; | Stacy | Dean Hall; | ||||||||||||||||||||||
Cozad; | Cozad; | Stacy L. | L. Cozad; | S. Edward | ||||||||||||||||||||||
Michael P. | Michael P. | Cozad; | S. Edward | Woodcock; | ||||||||||||||||||||||
Smith; | Smith; | S. Edward | Luis | Woodcock; | Luis | Rich White; | ||||||||||||||||||||
John C. | S. Edward | John C. | S. Edward | John C. | Woodcock; | Fernandez- | John C. | Rich White; | David H. | Fernandez- | Ryan Fisher; | |||||||||||||||
| Fortson | Woodcock | Fortson | Woodcock | Fortson | Rich White | Moreno | Fortson | Ryan Fisher | Li | Moreno | Terry Dyer | ||||||||||||||
Increase/deduction for Awards Granted during Prior FYs that were Outstanding and Unvested as of Applicable FY End, determined based on change in Fair Value from Prior FY End to Applicable FY End | | (1,109,324) | | | (178,326) | | 1,512,795 | | 196,153 | | (3,874,416) | | (820,193) | | 0 | (154,637) | | (820,193) | | 0 | | 204,997 | | 302,841 | ||
Increase/deduction for Awards Granted during Prior FYs that Vested During Applicable FY, determined based on change in Fair Value from Prior FY End to Vesting Date |
| (140,069) |
|
| (39,102) |
| (78,275) |
| (30,741) |
| 481,618 |
| 104,701 |
| 0 | 267,327 |
| 104,701 |
| 0 |
| 220,196 |
| 51,404 | ||
Deduction of Fair Value of Awards Granted during Prior FY that were Forfeited during Applicable FY, determined as of Prior FY End |
| 0 |
|
| 0 |
| 0 |
| 0 |
| (205,906) |
| (17,310) |
| 0 | (905,853) |
| (17,310) |
| 0 |
| 0 |
| (22,273) | ||
Increase based on Dividends or Other Earnings Paid during Applicable FY prior to Vesting Date |
| 0 |
|
| 0 |
| 0 |
| 0 |
| 0 |
| 0 |
| 0 | 0 |
| 0 |
| 0 |
| 0 |
| 0 | ||
Increase based on Incremental Fair Value of Options/ SARs Modified during Applicable FY |
| 0 |
|
| 0 |
| 0 |
| 0 |
| 0 |
| 0 |
| 0 | 0 |
| 0 |
| 0 |
| 0 |
| 0 | ||
2021 | 2022 | 2023 | 2024 | 2025 | |||||||||||||||||||||
Average | Average | Average | Average | Average | |||||||||||||||||||||
Non-PEO | Non-PEO | Non-PEO | Non-PEO | Non-PEO | |||||||||||||||||||||
1st PEO | NEO | 1st PEO | NEO | 1st PEO | NEO | 1st PEO | 2nd PEO | NEO | 1st PEO | 2nd PEO | NEO | ||||||||||||||
Mary | Mary | ||||||||||||||||||||||||
Dean Hall; | Mary | Dean Hall; | Mary | ||||||||||||||||||||||
Stacy L. | Dean Hall; | Mary | Stacy | Dean Hall; | |||||||||||||||||||||
Cozad; | Stacy L. | Dean Hall; | L. Cozad; | S. Edward | |||||||||||||||||||||
Michael P. | Cozad; | Stacy L. | S. Edward | Woodcock; | |||||||||||||||||||||
Smith; | S. Edward | Cozad; | Luis | Woodcock; | Luis | Rich White; | |||||||||||||||||||
John C. | S. Edward | John C. | Woodcock; | John C. | Rich White; S. Edward | Fernandez- | John C. | Rich White; | David H. | Fernandez- | Ryan Fisher; | ||||||||||||||
| Fortson | Woodcock | Fortson | Rich White | Fortson | Woodcock | Moreno | Fortson | Ryan Fisher | Li | Moreno | Terry Dyer | |||||||||||||
Deduction for Change in the Actuarial Present Values reported under the “Change in Pension Value and Nonqualified Deferred Compensation Earnings” Column of the Summary Compensation Table for Applicable FY | | 0 | | 0 | | 0 | | 0 | | 0 | | 0 | | 0 | 0 | | 0 | | 0 | | 0 | | 0 | ||
Increase for Service Cost and, if applicable, Prior Service Cost for Pension Plans |
| 0 |
| 0 |
| 0 |
| 0 |
| 0 |
| 0 |
| 0 | 0 |
| 0 |
| 0 |
| 0 |
| 0 | ||
Total Adjustments |
| (1,364,034) |
| (243,106) |
| 1,926,865 |
| 270,190 |
| (6,371,109) |
| (1,499,457) |
| (47,214) | (5,477,114) |
| (430,231) |
| 11,669,585 |
| 530,269 |
| 674,679 | ||
Compensation Actually Paid |
| 3,458,254 |
| 1,915,624 |
| 7,321,335 |
| 1,902,483 |
| (1,080,067) |
| 218,609 |
| 1,988,228 | 817,276 |
| 1,062,511 |
| 24,509,304 |
| 1,595,756 |
| 2,187,869 | ||
| (3) | Equity values are calculated in accordance with FASB ASC Topic 718, and the valuation assumptions used to calculate fair values did not materially differ from those disclosed at the time of the grant. |

Tabular List
The table below represents the most important financial performance measures used by Ingevity to link compensation actually paid to our named executive officers to company performance for FY25, as discussed further in our Compensation Discussion and Analysis (CD&A).
Adjusted EBITDA |
Adjusted Revenue |
Diluted EPS |
2021 | 2022 | 2023 | 2024 | 2025 | ||||||||||||||||||||||
Average | Average | Average | Average | Average | ||||||||||||||||||||||
Non-PEO | Non-PEO | Non-PEO | Non-PEO | Non-PEO | ||||||||||||||||||||||
1st PEO | NEO | 1st PEO | NEO | 1st PEO | NEO | 1st PEO | 2nd PEO | NEO | 1st PEO | 2nd PEO | NEO | |||||||||||||||
Mary | Mary | Mary | ||||||||||||||||||||||||
Dean Hall; | Dean Hall; | Mary | Dean Hall; | Mary | ||||||||||||||||||||||
Stacy L. | Stacy L. | Dean Hall; | Stacy | Dean Hall; | ||||||||||||||||||||||
Cozad; | Cozad; | Stacy L. | L. Cozad; | S. Edward | ||||||||||||||||||||||
Michael P. | Michael P. | Cozad; | S. Edward | Woodcock; | ||||||||||||||||||||||
Smith; | Smith; | S. Edward | Luis | Woodcock; | Luis | Rich White; | ||||||||||||||||||||
John C. | S. Edward | John C. | S. Edward | John C. | Woodcock; | Fernandez- | John C. | Rich White; | David H. | Fernandez- | Ryan Fisher; | |||||||||||||||
| Fortson | Woodcock | Fortson | Woodcock | Fortson | Rich White | Moreno | Fortson | Ryan Fisher | Li | Moreno | Terry Dyer | ||||||||||||||
Increase/deduction for Awards Granted during Prior FYs that were Outstanding and Unvested as of Applicable FY End, determined based on change in Fair Value from Prior FY End to Applicable FY End | | (1,109,324) | | | (178,326) | | 1,512,795 | | 196,153 | | (3,874,416) | | (820,193) | | 0 | (154,637) | | (820,193) | | 0 | | 204,997 | | 302,841 | ||
Increase/deduction for Awards Granted during Prior FYs that Vested During Applicable FY, determined based on change in Fair Value from Prior FY End to Vesting Date |
| (140,069) |
|
| (39,102) |
| (78,275) |
| (30,741) |
| 481,618 |
| 104,701 |
| 0 | 267,327 |
| 104,701 |
| 0 |
| 220,196 |
| 51,404 | ||
Deduction of Fair Value of Awards Granted during Prior FY that were Forfeited during Applicable FY, determined as of Prior FY End |
| 0 |
|
| 0 |
| 0 |
| 0 |
| (205,906) |
| (17,310) |
| 0 | (905,853) |
| (17,310) |
| 0 |
| 0 |
| (22,273) | ||
Increase based on Dividends or Other Earnings Paid during Applicable FY prior to Vesting Date |
| 0 |
|
| 0 |
| 0 |
| 0 |
| 0 |
| 0 |
| 0 | 0 |
| 0 |
| 0 |
| 0 |
| 0 | ||
Increase based on Incremental Fair Value of Options/ SARs Modified during Applicable FY |
| 0 |
|
| 0 |
| 0 |
| 0 |
| 0 |
| 0 |
| 0 | 0 |
| 0 |
| 0 |
| 0 |
| 0 | ||