Pay Versus Performance
Background
Item 402(v) of the SEC’s Regulation S-K, which was mandated by the Dodd-Frank Wall Street Reform and Consumer Protection Act of 2010, requires disclosure of information that demonstrates the relationship between executive compensation actually paid (referred to herein as “CAP”) and the financial performance of the issuer.
PAY VERSUS PERFORMANCE |
||||||||
|
|
|
|
|
Value of Initial Fixed |
|
|
|
Year |
Summary |
Compensation |
Average Summary |
Average Summary |
Total |
Peer Group |
Net |
Adjusted EPS (5) |
(a) |
(b) |
(c) |
(d) |
(e) |
(f) |
(g) |
(h) |
(i) |
2025 |
$6,334,741 |
$10,017,400 |
$2,242,524 |
$3,047,707 |
$213.75 |
$152.71 |
$486,073 |
$5.72 |
2024 |
$5,769,326 |
$8,481,165 |
$1,978,679 |
$2,589,125 |
$143.82 |
$130.90 |
$460,815 |
$5.31 |
2023 |
$5,565,268 |
$5,097,193 |
$1,950,896 |
$1,839,444 |
$123.90 |
$115.63 |
$392,602 |
$5.18 |
2022 |
$6,660,310 |
$8,160,975 |
$2,291,358 |
$2,727,056 |
$120.08 |
$116.10 |
$524,089 |
$5.98 |
2021 |
$5,938,806 |
$9,101,298 |
$2,210,600 |
$3,127,514 |
$121.57 |
$124.74 |
$463,215 |
$5.53 |
|
CEO |
Average of Non-CEO NEOs |
||||||||
|
2025 |
2024 |
2023 |
2022 |
2021 |
2025 |
2024 |
2023 |
2022 |
2021 |
Total Compensation as Reported in the “Total” column of the SCT |
$6,334,741 |
$5,769,326 |
$5,565,268 |
$6,660,310 |
$5,938,806 |
$2,242,524 |
$1,978,679 |
$1,950,896 |
$2,291,358 |
$2,210,600 |
Deduction for Grant Date Fair Values of Stock Awards Granted in the Year as Reported in the “Stock Awards” column of the SCT |
2,970,256 |
2,339,746 |
2,428,302 |
2,327,705 |
2,382,878 |
793,529 |
613,027 |
647,238 |
618,057 |
711,288 |
Increase for fair value as of December 31 of each applicable year of all stock awards granted during that year that are outstanding and unvested as of such date |
3,638,242 |
3,414,897 |
2,032,615 |
2,618,488 |
4,434,765 |
971,986 |
879,322 |
553,326 |
681,623 |
1,274,104 |
Increase for Fair Value of Awards Granted During the Year that Vest During the Year |
- |
- |
- |
- |
- |
- |
- |
- |
- |
- |
Increase (Deduction) for change in fair value from December 31 of the prior year to December 31 of the applicable year of any awards granted in a prior year that are outstanding and unvested as of December 31 of the applicable year |
2,717,772 |
301,250 |
(58,458) |
1,058,257 |
909,106 |
581,548 |
65,097 |
(9,211) |
287,388 |
257,209 |
Increase (Deduction) for change in fair value from December 31 of the prior year to the vesting date of any awards granted in any prior year as to which all vesting conditions were satisfied during the applicable year |
403,942 |
1,296,020 |
63,304 |
98,425 |
174,504 |
81,213 |
254,941 |
22,692 |
34,633 |
69,782 |
Deduction for fair value as of December 31 of the prior year of any awards granted in any prior year as to which vesting conditions failed to be met during the applicable year |
- |
- |
- |
- |
- |
- |
- |
- |
- |
- |
Deduction for changes in the actuarial present value of accumulated pension benefits and earnings on non-qualified deferred compensation plans as reported in the “Change in Pension Value and Nonqualified Deferred Compensation Earnings” of the SCT |
201,403 |
42,779 |
150,460 |
- |
33,171 |
96,143 |
29,989 |
95,777 |
- |
29,156 |
Increase for actuarially determined service cost and prior service cost for services related to defined benefit pension plans during the applicable year |
94,362 |
82,197 |
73,225 |
53,200 |
60,166 |
60,108 |
54,102 |
64,756 |
50,110 |
56,263 |
Compensation Actually Paid |
10,017,400 |
8,481,165 |
5,097,193 |
8,160,975 |
9,101,298 |
3,047,707 |
2,589,125 |
1,839,444 |
2,727,056 |
3,127,514 |
No amounts were added to reflect dividends or other earnings paid on stock awards because accrued dividends
are included in the stock award fair value calculations and therefore are included in total compensation for such
year.
For purposes of the foregoing, the fair value of the stock awards at all applicable dates was calculated using the same methodology (including applicable assumptions) as used to account for share-based payments in the Company’s financial statements. The assumptions used in calculating the fair value of awards at the applicable dates did not differ in any material respect from the assumptions used to calculate the grant date fair value of the
awards as reported in the Summary Compensation Table for the applicable year, except that (i) the fair value calculations of the PSUs subject to the EPS metric which were granted February 16, 2024, assumed a payout of 159.3%, as of December 31, 2025 and 136%, as of December 31, 2024; the PSUs subject to the EPS metric which were granted February 17, 2023, assumed a payout at 65% as of December 31, 2025 and 65% as of December 31, 2024 and 58% as of December 31, 2023, and the PSUs subject to the EPS metric which were granted February 18, 2022, assumed a payout at 122% as of December 31, 2024, 122% as of December 31, 2023 and 165% as of December 31, 2022, respectively, and the PSUs subject to the EPS metric which were granted February 15, 2021, assumed a payout at 200% as of December 31, 2023, 2022 and 2021, respectively, the PSUs subject to the EPS metric which were granted January 2, 2020 assumed a payout at 0% as of December 31, 2022, 2021, and 2020, respectively, the PSUs subject to the EPS metric which were granted January 2, 2018 assumed a payout of 0% as of December 31, 2021 and 2020, respectively; (ii) the share price used to determine fair value as of December 31, 2025, 2024, 2023, 2022 and 2021 differed, in some cases materially, from the share price used to determine the grant date fair values; and (iii) for awards subject to the TSR metric, the assumptions used in the Monte Carlo calculation to determine the fair value as of December 31, 2025, 2024, 2023, 2022 and 2021 and for awards subject to the ROAA and ROATCE metrics, the assumptions used in the Monte Carlo calculation to determine the fair value as of December 31, 2025 differed, in some cases materially, from the assumptions used in the Monte Carlo calculation used to determine the grant date fair values. For a discussion of the assumptions used to estimate the fair value of stock awards, please refer to the following section of the Company’s Annual Report on Form 10-K for the year ended December 31, 2025: “Share-Based Payment Arrangements” in Note 19 to the Consolidated Financial Statements.
Total Shareholder Return
The graph below presents, for the cumulative period from January 1, 2021 – December 31, 2025, the relationship between the CAP to our CEO and the average CAP to our other NEOs and each of Company’s TSR and the TSR of the Regional Banking Index.
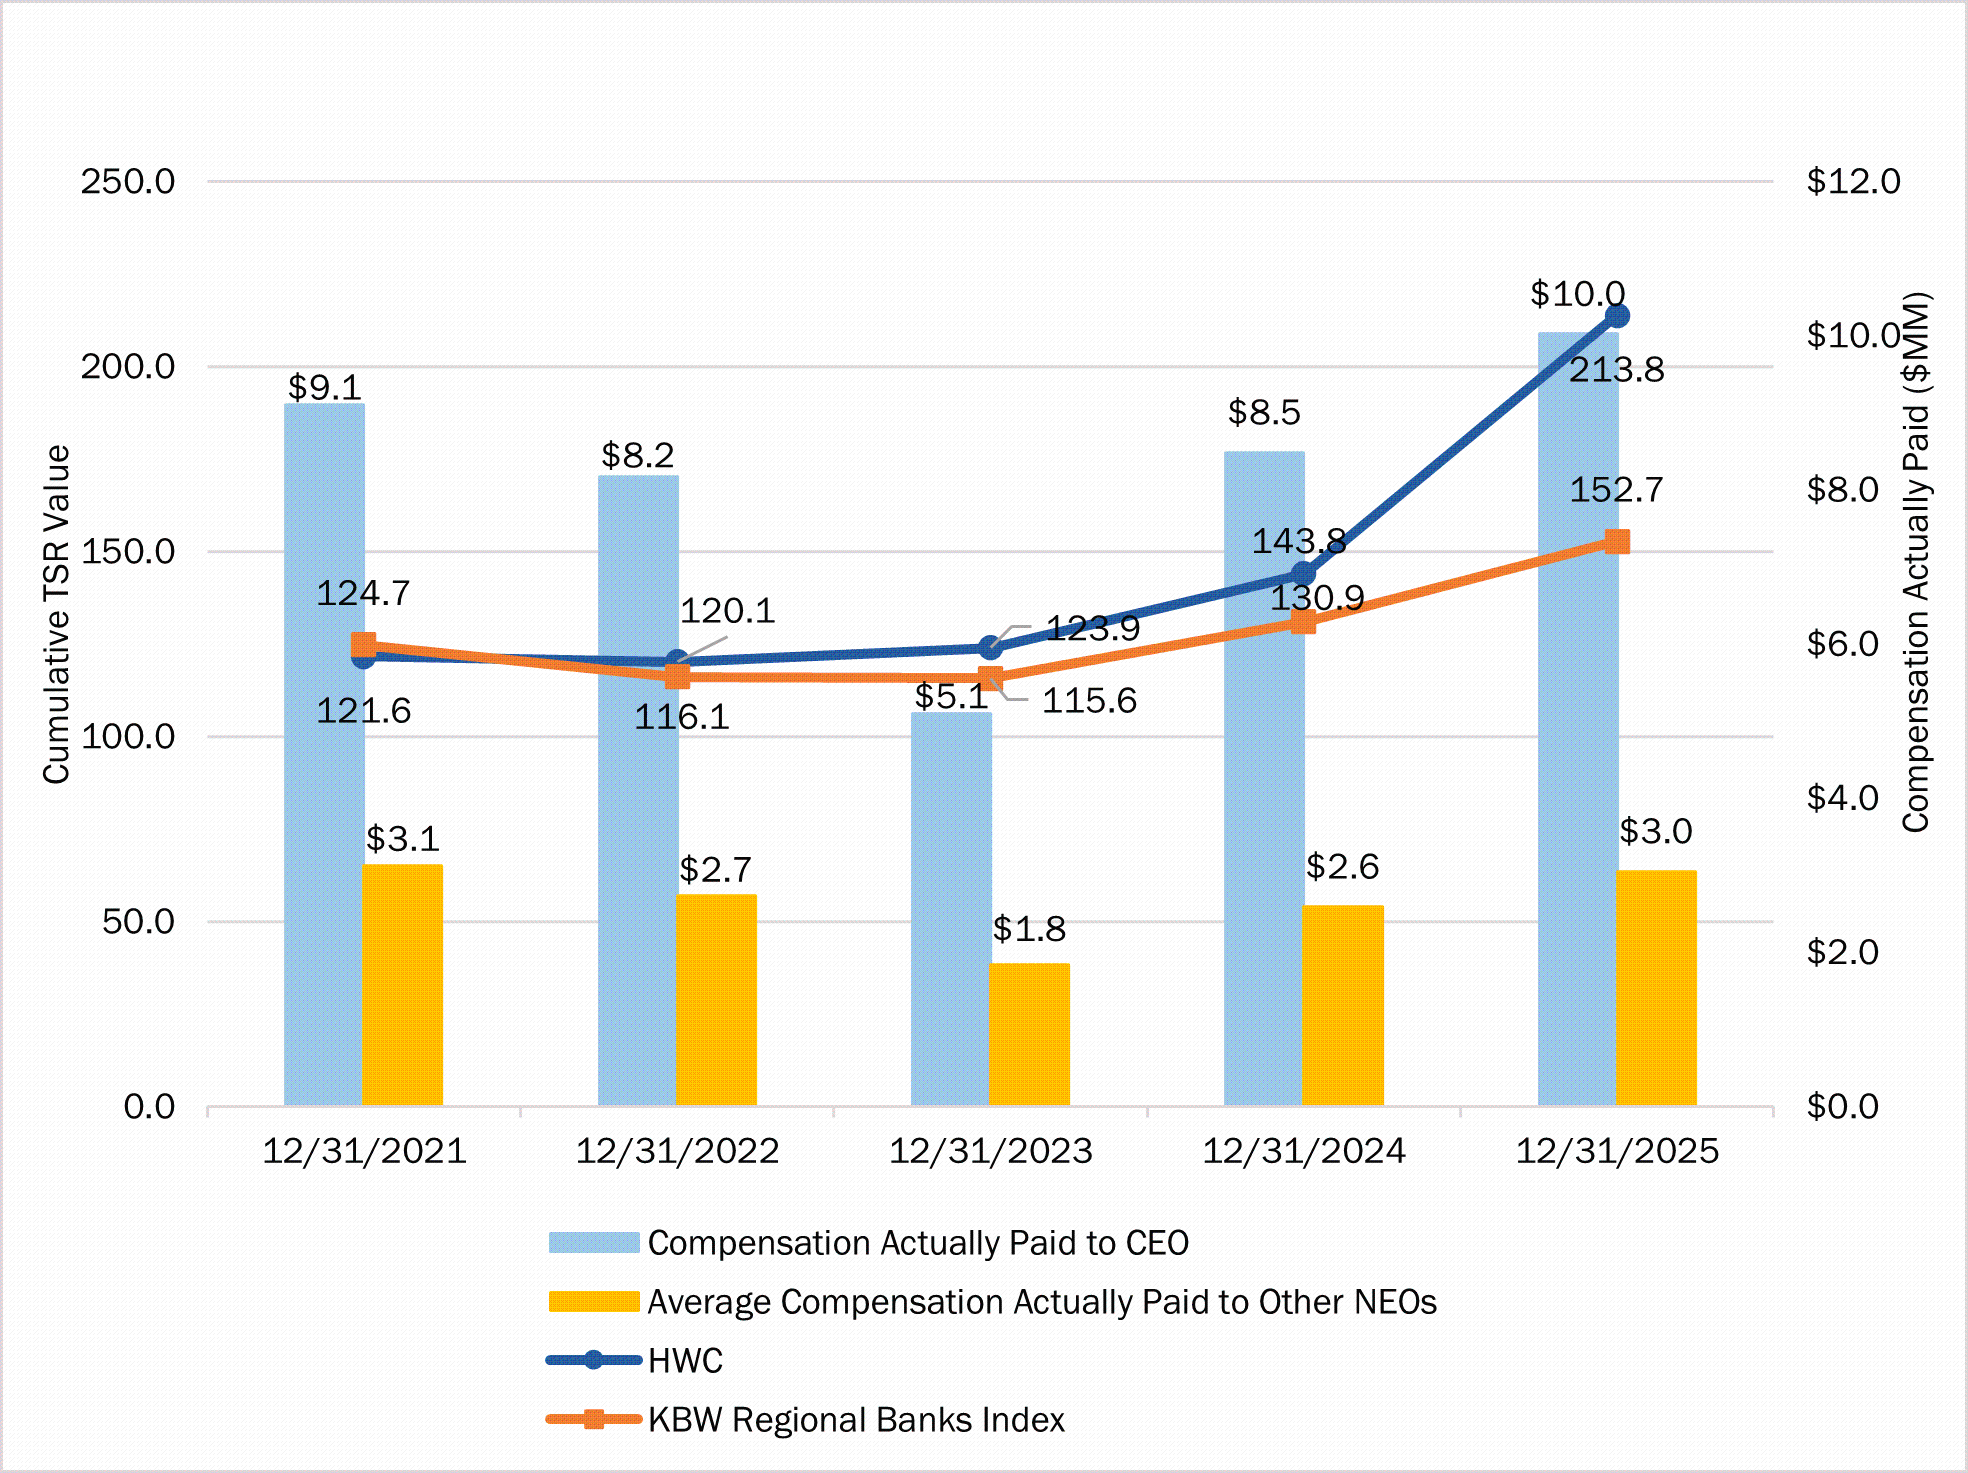
As demonstrated by the graph above, CAP to our CEO and the average CAP to our other NEOs is aligned with Company’s TSR as well as the TSR of the Regional Banking Index. Company’s TSR increased by 113.75% over the reporting period (50.54% in 2021, -1.23% in 2022, 3.18% in 2023, 16.08% in 2024 and 20.02% in 2025), outperforming the Regional Banking Index by 61.04% over the reporting period (13.90% in 2021, 5.70% in 2022, 3.58% in 2023, 2.87% in 2024 and 13.52% in 2025). During the reporting period, CAP to the CEO increased 10% in the aggregate, and average CAP to the other NEOs decreased 3% in the aggregate. CAP to the CEO and to the other NEOs was highest among the
reporting periods when Company achieved its highest year-end closing stock price in 2025, reflecting the high proportion of variable pay at risk for the CEO and the other NEOs. Conversely, CAP to the CEO and the other NEOs was lowest in 2023. 50% of the PSUs awarded in 2021, 2022, 2023 and 2024 vest based on the Company’s relative TSR performance. See “Compensation Discussion & Analysis—Elements of Our Compensation” for additional information.
Net Income
The graph below presents, for each of the years ended December 31, 2025, 2024, 2023, 2022 and 2021, the relationship between the CAP to our CEO and the average CAP to our other NEOs and the Company’s net income.
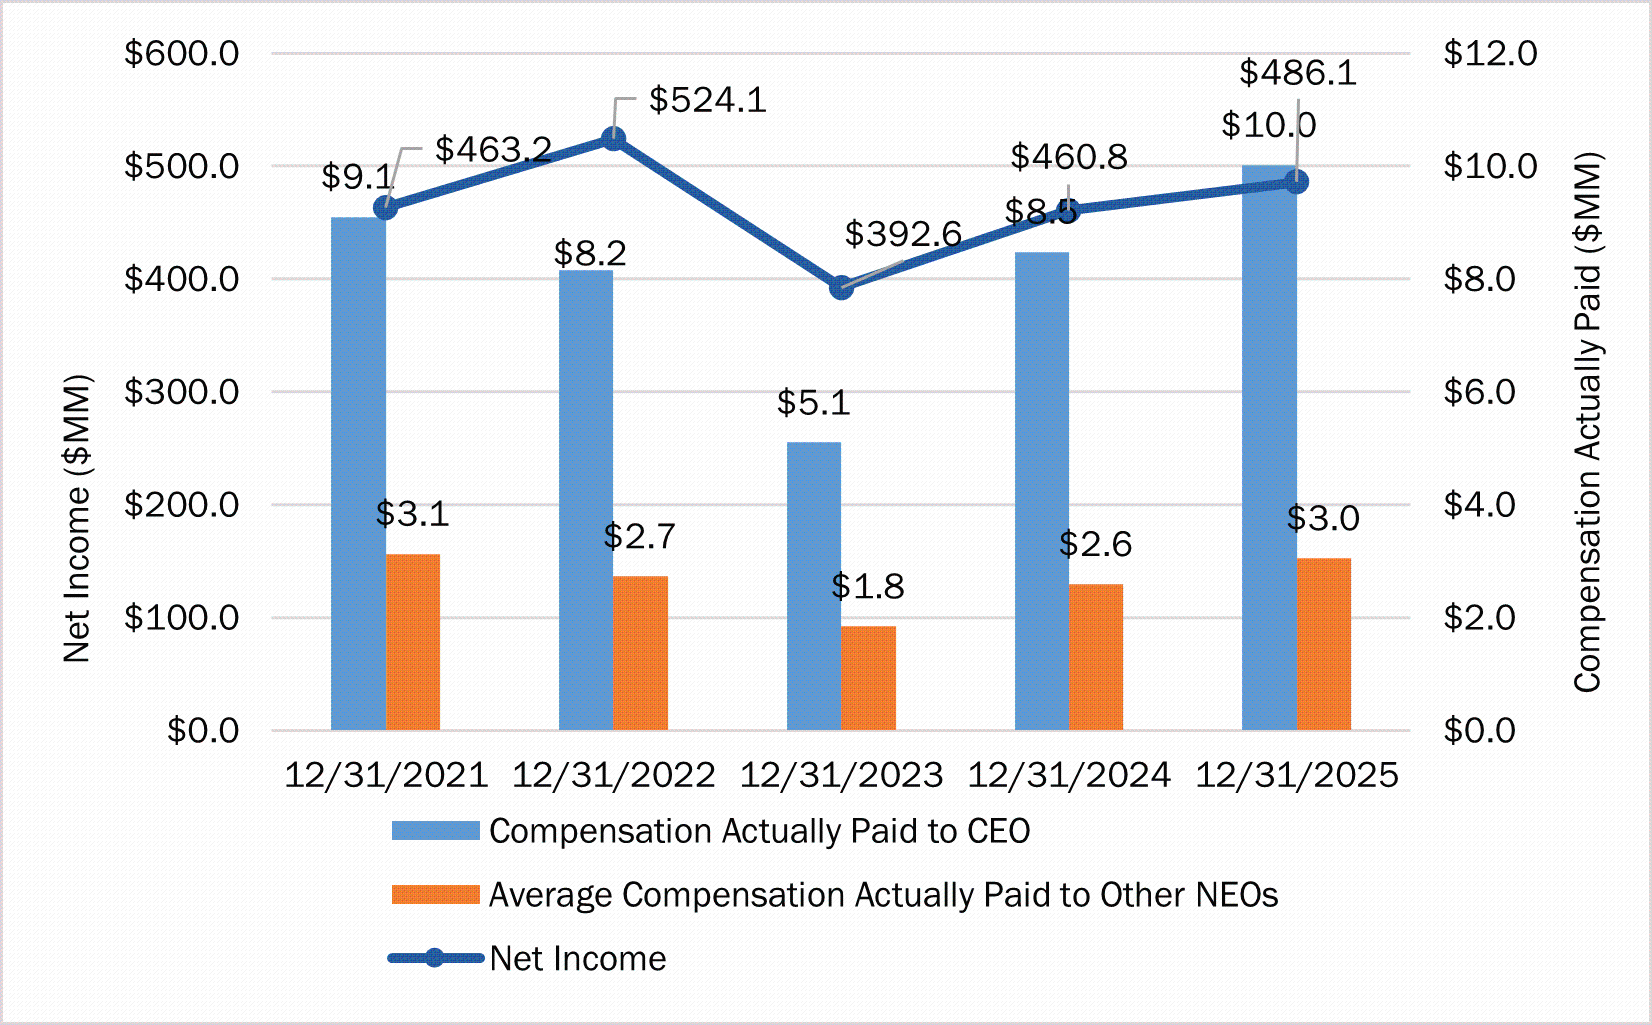
As demonstrated by the graph above, CAP to our CEO and to the other NEOs is aligned with Company’s Net Income. Net Income increased by 5% over the reporting period. During the reporting period, CAP to the CEO increased 10% in the aggregate, and average CAP to the other NEOs decreased 3% in the aggregate. The Compensation Committee did not use net income as a distinct metric for purposes of determining or paying compensation during 2025, 2024, 2023, 2022 or 2021.
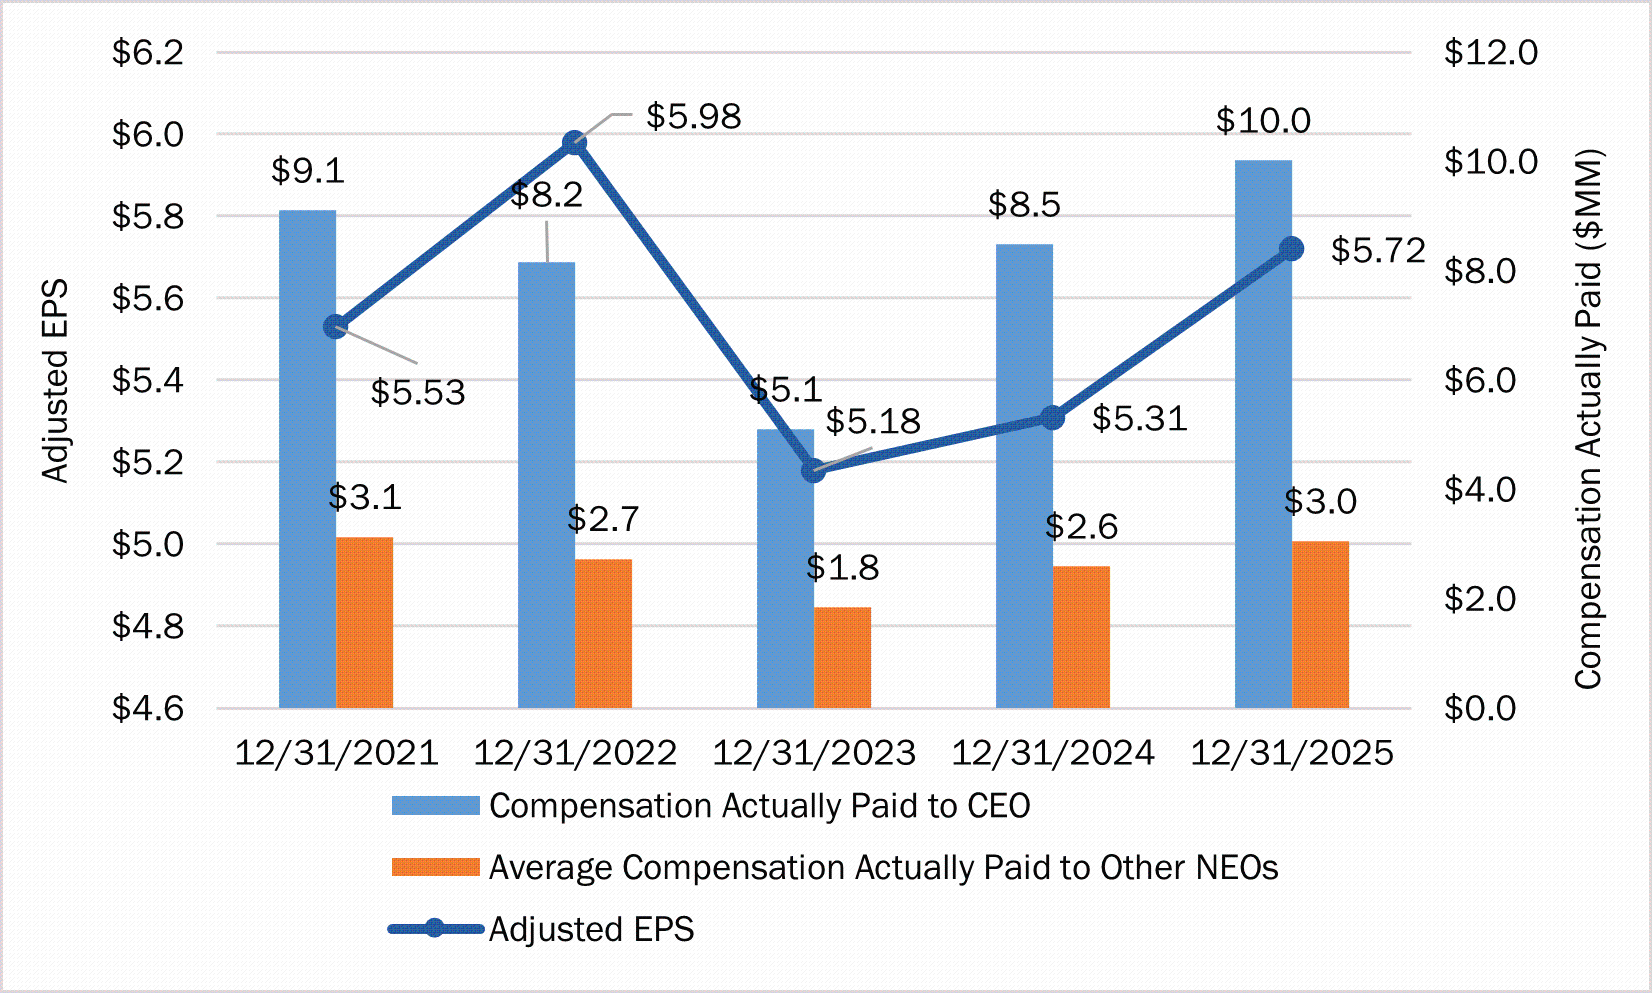
Adjusted EPS
The graph below presents, for each of the years ended December 31, 2025, 2024, 2023, 2022 and 2021, the relationship between the CAP to our CEO and the average CAP to our other NEOs and the Company’s Adjusted EPS.
Performance Metric |
Financial or Non-Financial |
Adjusted EPS |
Financial |
Relative TSR (1) |
Financial |
Adjusted Pre Provision Net Revenue |
Financial |
Commercial Criticized Loans to Total Commercial Loans |
Financial |
Non-Performing Loans to Total Loans |
Financial |
|
CEO |
Average of Non-CEO NEOs |
||||||||
|
2025 |
2024 |
2023 |
2022 |
2021 |
2025 |
2024 |
2023 |
2022 |
2021 |
Total Compensation as Reported in the “Total” column of the SCT |
$6,334,741 |
$5,769,326 |
$5,565,268 |
$6,660,310 |
$5,938,806 |
$2,242,524 |
$1,978,679 |
$1,950,896 |
$2,291,358 |
$2,210,600 |
Deduction for Grant Date Fair Values of Stock Awards Granted in the Year as Reported in the “Stock Awards” column of the SCT |
2,970,256 |
2,339,746 |
2,428,302 |
2,327,705 |
2,382,878 |
793,529 |
613,027 |
647,238 |
618,057 |
711,288 |
Increase for fair value as of December 31 of each applicable year of all stock awards granted during that year that are outstanding and unvested as of such date |
3,638,242 |
3,414,897 |
2,032,615 |
2,618,488 |
4,434,765 |
971,986 |
879,322 |
553,326 |
681,623 |
1,274,104 |
Increase for Fair Value of Awards Granted During the Year that Vest During the Year |
- |
- |
- |
- |
- |
- |
- |
- |
- |
- |
Increase (Deduction) for change in fair value from December 31 of the prior year to December 31 of the applicable year of any awards granted in a prior year that are outstanding and unvested as of December 31 of the applicable year |
2,717,772 |
301,250 |
(58,458) |
1,058,257 |
909,106 |
581,548 |
65,097 |
(9,211) |
287,388 |
257,209 |
Increase (Deduction) for change in fair value from December 31 of the prior year to the vesting date of any awards granted in any prior year as to which all vesting conditions were satisfied during the applicable year |
403,942 |
1,296,020 |
63,304 |
98,425 |
174,504 |
81,213 |
254,941 |
22,692 |
34,633 |
69,782 |
Deduction for fair value as of December 31 of the prior year of any awards granted in any prior year as to which vesting conditions failed to be met during the applicable year |
- |
- |
- |
- |
- |
- |
- |
- |
- |
- |
Deduction for changes in the actuarial present value of accumulated pension benefits and earnings on non-qualified deferred compensation plans as reported in the “Change in Pension Value and Nonqualified Deferred Compensation Earnings” of the SCT |
201,403 |
42,779 |
150,460 |
- |
33,171 |
96,143 |
29,989 |
95,777 |
- |
29,156 |
Increase for actuarially determined service cost and prior service cost for services related to defined benefit pension plans during the applicable year |
94,362 |
82,197 |
73,225 |
53,200 |
60,166 |
60,108 |
54,102 |
64,756 |
50,110 |
56,263 |
Compensation Actually Paid |
10,017,400 |
8,481,165 |
5,097,193 |
8,160,975 |
9,101,298 |
3,047,707 |
2,589,125 |
1,839,444 |
2,727,056 |
3,127,514 |