Pay vs Performance Disclosure - USD ($)
Dec. 31, 2025
Dec. 31, 2024
Dec. 31, 2023
Dec. 31, 2022
Dec. 31, 2021
Pay Versus Performance
As required by SEC rules, we are providing the following information about the relationship between executive compensation actually paid and certain financial performance of the Company. See philosophy and how the Company aligns executive compensation with the Company’s performance.
Section
3—Executive-Compensation Framework
on page 49 for additional information on the Company’s pay-for-performance
The table below provides information on the following for each reporting year: (1) the amount of total compensation reported in the “Total” column of the
Summary Compensation Table
for the principal executive officer (the “PEO”) and the non-PEO
NEOs; (2) the compensation actually paid to the PEO and the non-PEO
NEOs; (3) our TSR; (4) the TSR of the KBW Nasdaq Bank Index (which is our peer group for purposes of this section); (5) our net income; and (6) our adjusted earnings per share (which is our company-selected performance measure). “Compensation actually paid” is an amount calculated under SEC rules which does not reflect the actual amount of compensation realized by the PEO and non-PEO
NEOs in any reporting year. See Realized Pay
on page 47 for additional information on aggregate compensation amounts actually realized by our Chief Executive Officer for 2022 to 2025. Year |
Summary Compensation Table Total for PEO (1) ($) |
|
Compensation Actually Paid to PEO (2) ($) |
Average Summary Compensation Table Total for Non-PEO NEOs (1) ($) |
Average Compensation Actually Paid to Non-PEO NEOs (2) ($) |
Value of Initial Fixed $100 Investment Based On: |
Net Income (Loss) (5) ($ in millions) |
Adjusted Earnings Per Share (6) ($) | |||||||||||||||||||||||||||||||||||||||||||||||
| |
Total Shareholder Return (3) ($) |
Peer Group Total Shareholder Return (4) ($) | |||||||||||||||||||||||||||||||||||||||||||||||||||||
Kelly S. King |
William H. Rogers, Jr. |
|
Kelly S. King |
William H. Rogers, Jr. | |||||||||||||||||||||||||||||||||||||||||||||||||||
2025 |
— | 14,313,770 | — | 15,202,106 | 5,695,498 | 5,939,629 | 129.86 | 196.02 | 5,307 | 4.00 | |||||||||||||||||||||||||||||||||||||||||||||
2024 |
— | 13,951,543 | — | 18,337,254 | 10,170,694 | 12,310,236 | 96.99 | 132.63 | 4,840 | 3.81 | |||||||||||||||||||||||||||||||||||||||||||||
2023 |
— | 12,401,590 | — | 4,483,210 | 9,336,938 | 4,007,586 | 78.39 | 96.66 | (1,047 | ) | 3.81 | ||||||||||||||||||||||||||||||||||||||||||||
2022 |
— | 13,237,842 | — | 11,774,153 | 6,193,618 | 6,642,889 | 85.70 | 97.53 | 6,267 | 4.96 | |||||||||||||||||||||||||||||||||||||||||||||
2021 |
15,288,905 | 10,395,426 | 23,785,332 | 24,811,139 | 9,296,667 | 9,957,776 | 112.04 | 124.08 | 6,437 | 5.53 | |||||||||||||||||||||||||||||||||||||||||||||
| (1) | The PEO for each reporting year was William H. Rogers, Jr. and in 2021, was also Kelly S. King. The non-PEO NEOs for each reporting year are as follows: |
◾ |
2025: Michael B. Maguire, Kristin Lesher, Dontá L. Wilson, Bradley D. Bender, and Hugh S. Cummins III |
◾ |
2024: Michael B. Maguire, Kristin Lesher, Dontá L. Wilson, and Hugh S. Cummins III |
◾ |
2023: Michael B. Maguire, Dontá L. Wilson, Hugh S. Cummins III, Clarke R. Starnes III, and John M. Howard |
◾ |
2022: Daryl N. Bible, Michael B. Maguire, Dontá L. Wilson, Hugh S. Cummins III, and Clarke R. Starnes III |
◾ |
2021: Daryl N. Bible, Hugh S. Cummins III, Clarke R. Starnes III, John M. Howard, and Christopher L. Henson |
| (2) | SEC rules require certain adjustments be made to the amount of total compensation reported in the “Total” column of the Summary Compensation Table for the PEO and non-PEO NEOs to determine compensation actually paid for the applicable reporting year. For 2025, these adjustments are as set forth below, provided as an average for the non-PEO NEOs: |
Year |
Executive(s) |
Reported Summary Compensation Table Total ($) |
Minus Reported Value of Equity Awards (a) ($) |
Plus Equity Award Adjustments (b) ($) |
Minus Reported Change in Actuarial Present Value of Pension Benefits (c) ($) |
Plus Pension Benefit Adjustments (d) ($) |
Equals Compensation Actually Paid ($) | ||||||||||||||||||||||||||||
2025 |
PEO | 14,313,770 | (7,275,126 | ) | 9,409,789 | (1,282,068 | ) | 35,741 | 15,202,106 | ||||||||||||||||||||||||||
Non-PEO NEOs |
5,695,498 | (1,988,651 | ) | 2,555,292 | (505,477 | ) | 182,967 | 5,939,629 | |||||||||||||||||||||||||||
| (a) | Represents the grant date fair value of equity awards reported in the “Stock Awards” column in the 2025 Summary Compensation Table . |
| (b) | Amounts provided in the “Equity Award Adjustments” column were determined as set forth below. There were no equity awards granted to NEOs in 2025 which vested on or before December 31, 2025, and no dividends, dividend equivalents, or other earnings paid to NEOs on unvested equity awards. The valuation assumptions used to calculate fair values did not materially differ from those disclosed at the time of grant, except that the 2024 PSU (Leadership) awards are valued based on the assumption that threshold performance is probable. Values are provided as an average for the non-PEO NEOs. |
Year |
Executive(s) |
Value as of 2025 Year-End of 2025 Equity Awards Outstanding as of Year-End ($) |
Plus Change in Value as of 2025 Year-End for Prior Year Awards Outstanding as of Year-End ($) |
Plus Change in Value as of Vesting Date for Prior Year Awards That Vested in 2025 ($) |
Minus Value as of 2024 Year-End of Prior Year Awards That Failed to Vest in 2025 ($) |
Equals Equity Award Adjustments ($) | ||||||||||||||||||||||||
2025 |
PEO | 7,949,056 | 1,557,250 | (96,517 | ) | — | 9,409,789 | |||||||||||||||||||||||
Non-PEO NEOs |
2,170,703 | 402,270 | 145,162 | (162,842 | ) | 2,555,292 | ||||||||||||||||||||||||
| (c) | Represents the aggregate change in actuarial present value of accumulated benefits under defined benefit and actuarial pension plans reported in the “Change in Pension Value & Non-Qualified Deferred Compensation Earnings” column of the 2025 Summary Compensation Table . |
| (d) | Amounts provided in the “Pension Benefit Adjustments” column were determined as set forth below. “Service cost” refers to the actuarially determined present value of plan benefits attributable to services rendered during 2025. “Prior service cost” refers to the entire cost of plan benefits granted (or credit for benefits reduced) in a plan amendment (or initiation) during 2025 that are attributable under the plan benefit formula to services rendered in periods prior to the plan amendment or initiation. Both service cost and prior service cost are calculated in accordance with U.S. GAAP. Values are provided as an average for the non-PEO NEOs. |
Year |
Executive(s) |
Service Cost ($) |
Plus Prior Service Cost ($) |
Equals Pension Benefit Adjustments ($) | ||||||||||||||||
2025 |
PEO | 35,741 | — | 35,741 | ||||||||||||||||
Non-PEO NEOs |
182,967 | — | 182,967 | |||||||||||||||||
| (3) | TSR is calculated by dividing (1) the sum of (A) the cumulative amount of dividends for the measurement period, assuming dividend reinvestment, and (B) the difference between the Company’s share price at the end and the beginning of the measurement period, by (2) the Company’s share price at the beginning of the measurement period. |
| (4) | Represents the weighted TSR of the KBW Nasdaq Bank Index, weighted according to the respective companies’ stock market capitalization at the beginning of each period for which a return is indicated. |
| (5) | The dollar amounts reported represent the net income (or loss) reflected in the Company’s audited financial statements for the applicable year, calculated in accordance with U.S. GAAP. |
| (6) | For purposes of our incentive-compensation programs, adjusted EPS was calculated for 2025 and 2024 by dividing the Company’s net income available to common shareholders for the applicable year, adjusted for certain significant unusual or non-core performance items as determined by the Committee, by the average number of fully diluted common shares outstanding during the year. Because the method of calculating adjusted EPS for 2024 and 2025 differed from the approach used in prior years, the adjusted EPS values for 2021–2023 have been recalculated for purposes of this Pay Versus Performance (“PvP”) table to be consistent with the method of calculation for 2024 and 2025. While the Company uses numerous financial and non-financial performance measures for the purpose of evaluating performance for the Company’s compensation programs, the Company has determined that adjusted EPS is the financial performance measure that, in the Company’s assessment, represents the most important performance measure (that is not otherwise required to be disclosed in the table above) used by the Company to link compensation actually paid to the Company’s NEOs, for the most recently completed fiscal year, to Company performance. Adjusted EPS for purposes of our incentive-compensation programs is a non-GAAP financial measure and excludes securities (gains) losses, goodwill impairments, charitable contributions, FDIC special assessments, discrete tax benefits, legal accruals, and certain other selected items. |
| (1) | The PEO for each reporting year was William H. Rogers, Jr. and in 2021, was also Kelly S. King. The non-PEO NEOs for each reporting year are as follows: |
◾ |
2025: Michael B. Maguire, Kristin Lesher, Dontá L. Wilson, Bradley D. Bender, and Hugh S. Cummins III |
◾ |
2024: Michael B. Maguire, Kristin Lesher, Dontá L. Wilson, and Hugh S. Cummins III |
◾ |
2023: Michael B. Maguire, Dontá L. Wilson, Hugh S. Cummins III, Clarke R. Starnes III, and John M. Howard |
◾ |
2022: Daryl N. Bible, Michael B. Maguire, Dontá L. Wilson, Hugh S. Cummins III, and Clarke R. Starnes III |
◾ |
2021: Daryl N. Bible, Hugh S. Cummins III, Clarke R. Starnes III, John M. Howard, and Christopher L. Henson |
| (2) | SEC rules require certain adjustments be made to the amount of total compensation reported in the “Total” column of the Summary Compensation Table for the PEO and non-PEO NEOs to determine compensation actually paid for the applicable reporting year. For 2025, these adjustments are as set forth below, provided as an average for the non-PEO NEOs: |
Year |
Executive(s) |
Reported Summary Compensation Table Total ($) |
Minus Reported Value of Equity Awards (a) ($) |
Plus Equity Award Adjustments (b) ($) |
Minus Reported Change in Actuarial Present Value of Pension Benefits (c) ($) |
Plus Pension Benefit Adjustments (d) ($) |
Equals Compensation Actually Paid ($) | ||||||||||||||||||||||||||||
2025 |
PEO | 14,313,770 | (7,275,126 | ) | 9,409,789 | (1,282,068 | ) | 35,741 | 15,202,106 | ||||||||||||||||||||||||||
Non-PEO NEOs |
5,695,498 | (1,988,651 | ) | 2,555,292 | (505,477 | ) | 182,967 | 5,939,629 | |||||||||||||||||||||||||||
| (a) | Represents the grant date fair value of equity awards reported in the “Stock Awards” column in the 2025 Summary Compensation Table . |
| (b) | Amounts provided in the “Equity Award Adjustments” column were determined as set forth below. There were no equity awards granted to NEOs in 2025 which vested on or before December 31, 2025, and no dividends, dividend equivalents, or other earnings paid to NEOs on unvested equity awards. The valuation assumptions used to calculate fair values did not materially differ from those disclosed at the time of grant, except that the 2024 PSU (Leadership) awards are valued based on the assumption that threshold performance is probable. Values are provided as an average for the non-PEO NEOs. |
Year |
Executive(s) |
Value as of 2025 Year-End of 2025 Equity Awards Outstanding as of Year-End ($) |
Plus Change in Value as of 2025 Year-End for Prior Year Awards Outstanding as of Year-End ($) |
Plus Change in Value as of Vesting Date for Prior Year Awards That Vested in 2025 ($) |
Minus Value as of 2024 Year-End of Prior Year Awards That Failed to Vest in 2025 ($) |
Equals Equity Award Adjustments ($) | ||||||||||||||||||||||||
2025 |
PEO | 7,949,056 | 1,557,250 | (96,517 | ) | — | 9,409,789 | |||||||||||||||||||||||
Non-PEO NEOs |
2,170,703 | 402,270 | 145,162 | (162,842 | ) | 2,555,292 | ||||||||||||||||||||||||
| (c) | Represents the aggregate change in actuarial present value of accumulated benefits under defined benefit and actuarial pension plans reported in the “Change in Pension Value & Non-Qualified Deferred Compensation Earnings” column of the 2025 Summary Compensation Table . |
| (d) | Amounts provided in the “Pension Benefit Adjustments” column were determined as set forth below. “Service cost” refers to the actuarially determined present value of plan benefits attributable to services rendered during 2025. “Prior service cost” refers to the entire cost of plan benefits granted (or credit for benefits reduced) in a plan amendment (or initiation) during 2025 that are attributable under the plan benefit formula to services rendered in periods prior to the plan amendment or initiation. Both service cost and prior service cost are calculated in accordance with U.S. GAAP. Values are provided as an average for the non-PEO NEOs. |
Year |
Executive(s) |
Service Cost ($) |
Plus Prior Service Cost ($) |
Equals Pension Benefit Adjustments ($) | ||||||||||||||||
2025 |
PEO | 35,741 | — | 35,741 | ||||||||||||||||
Non-PEO NEOs |
182,967 | — | 182,967 | |||||||||||||||||
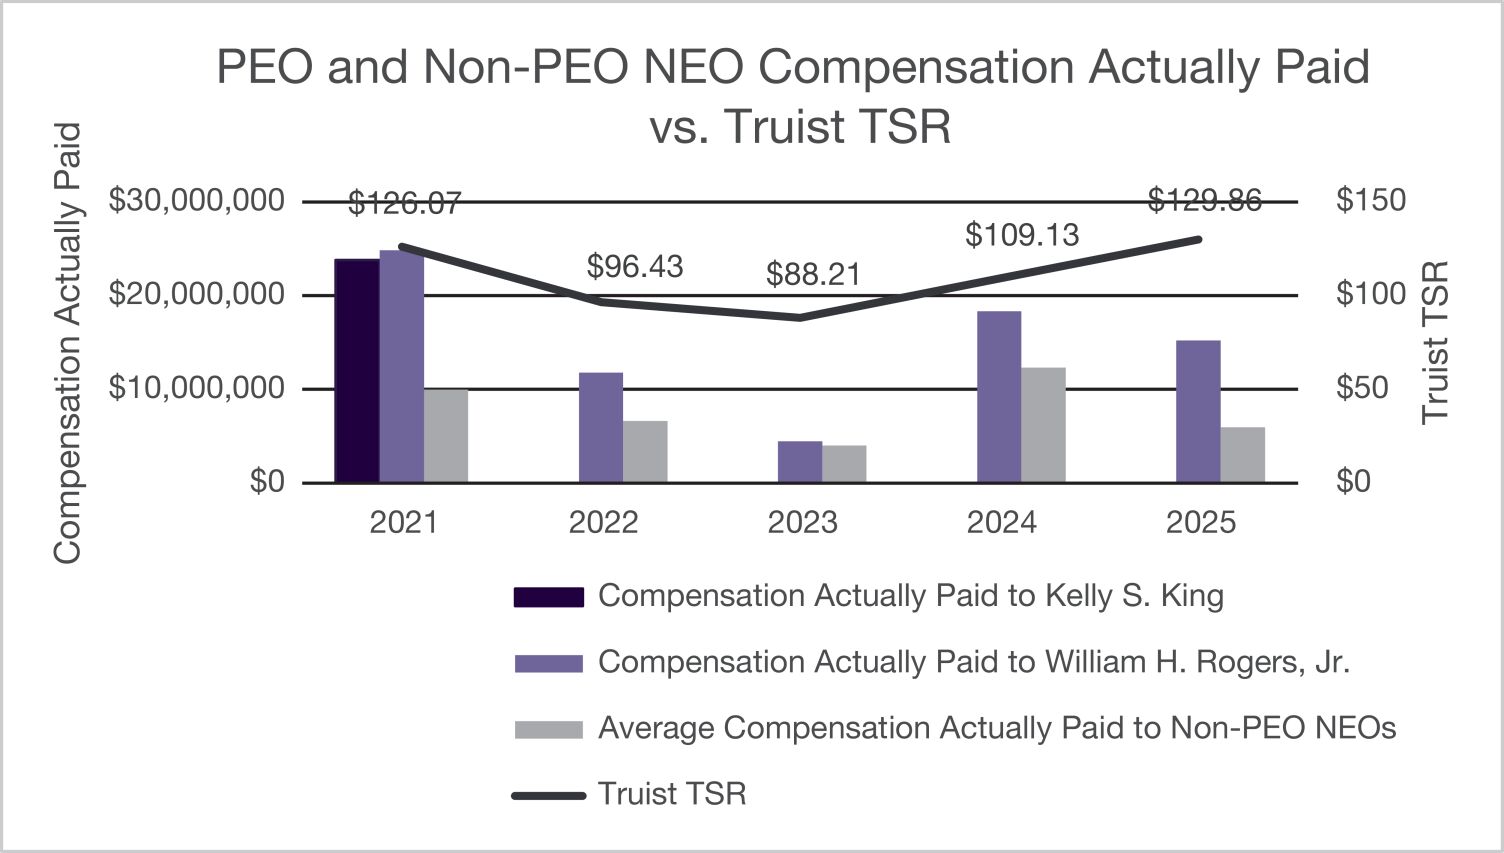
Compensation Actually Paid and Cumulative TSR
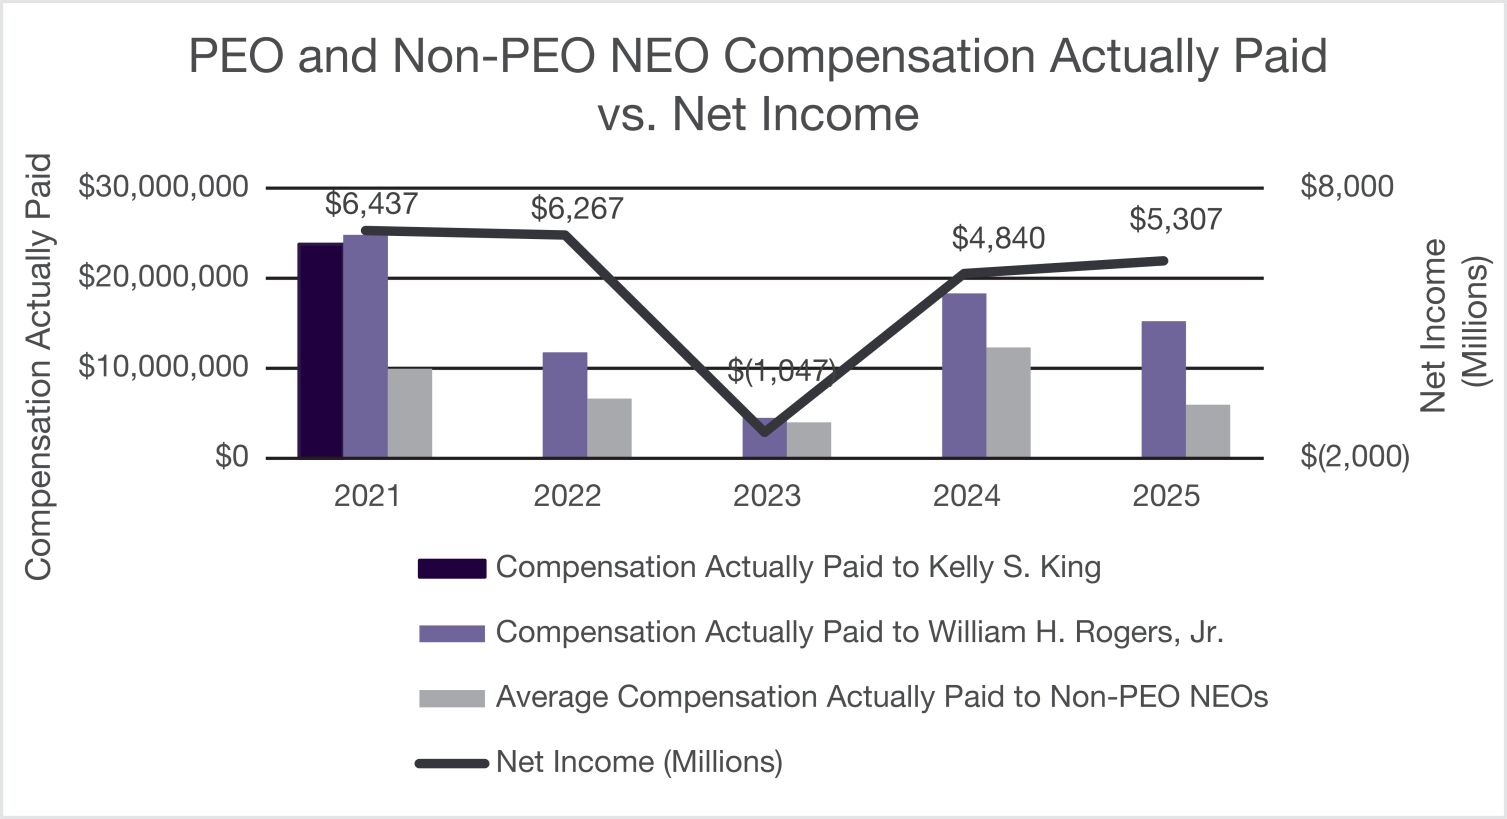
Compensation Actually Paid and GAAP Net Income
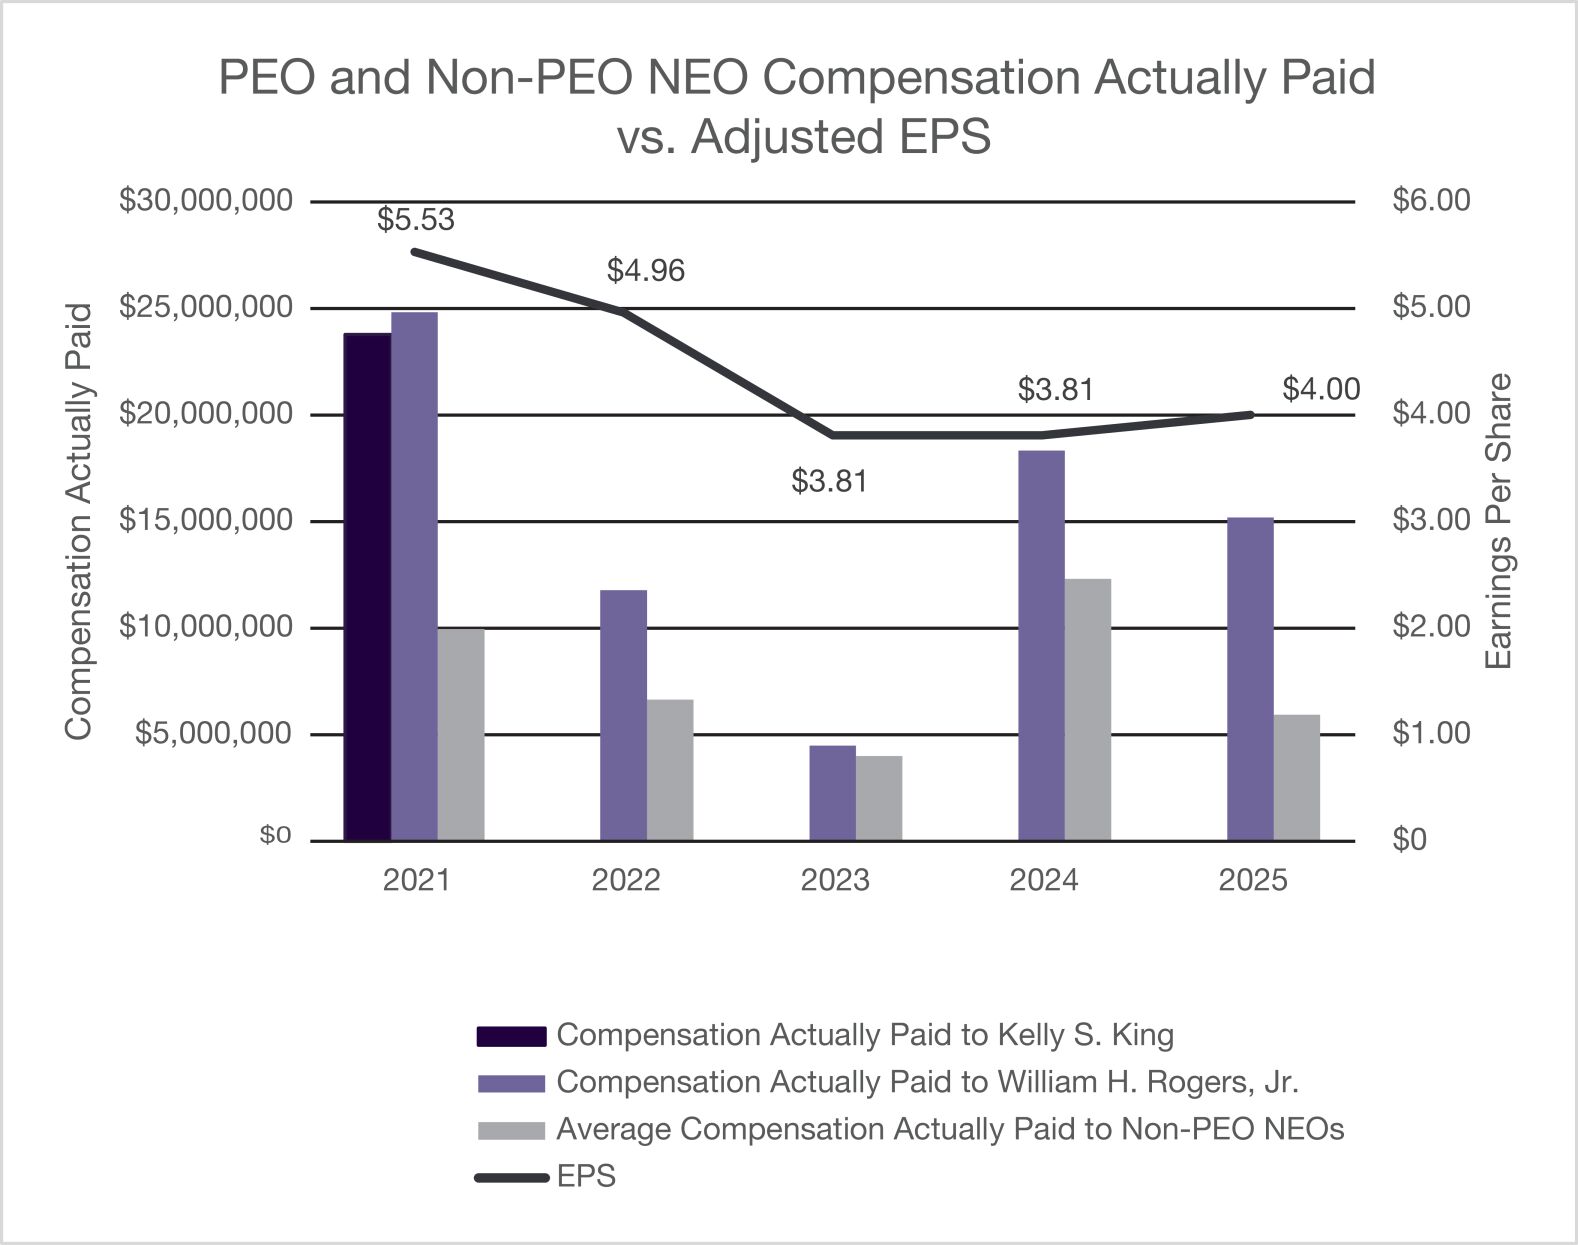
Compensation Actually Paid and Adjusted EPS
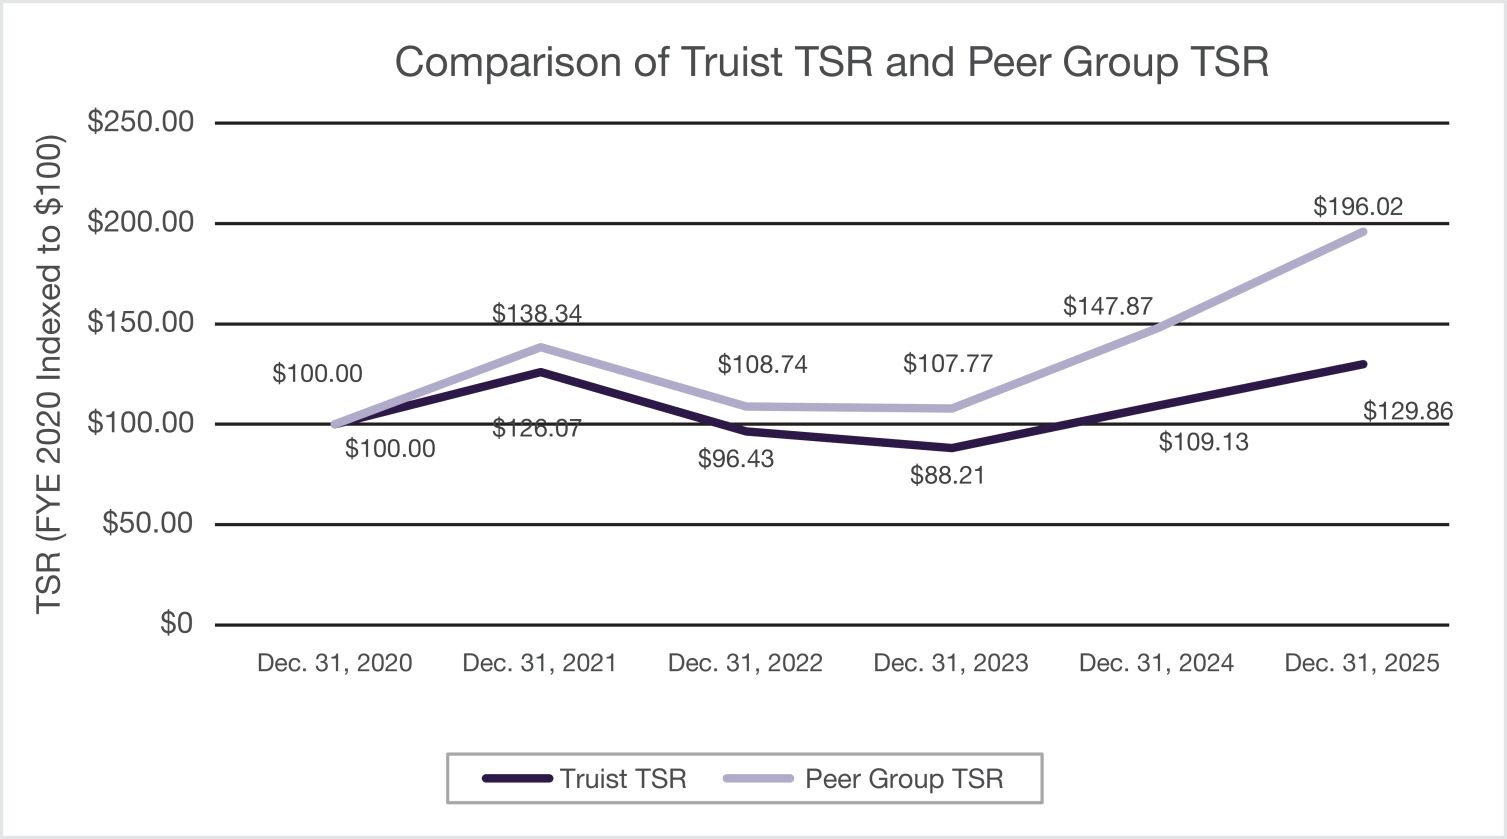
Cumulative TSR of the Company and Cumulative TSR of the Peer Group
Financial Performance Measures
As described in the
Compensation Discussion and Analysis
, the Committee believes our executive-compensation program should be aligned with the interests of shareholders, drive long-term value creation for the Company, and account for the safety and soundness of Truist commensurate with its structure, risk profile, complexity, activities, and size. At the beginning of 2025, the Committee selected the financial performance measures which it believed would incentivize the execution of short- and long-term goals that support Truist’s enterprise strategic goals. These metrics, as set forth below, are the most important financial performance measures used by the Company in 2025 to link the Company’s performance to the compensation actually paid to the Company’s NEOs. ◾ Adjusted EPS ◾ Adjusted Operating Leverage ◾ Adjusted PPNR ◾ Adjusted ROTCE ◾ CET1 Capital Ratio ◾ TBVPS + Dividend Growth ◾ TSR |
non-core
performance items as determined by the Committee, by the average number of fully diluted common shares outstanding during the year. Because the method of calculating adjusted EPS for 2024 and 2025 differed from the approach used in prior years, the adjusted EPS values for 2021–2023 have been recalculated for purposes of this Pay Versus Performance (“PvP”) table to be consistent with the method of calculation for 2024 and 2025. While the Company uses numerous financial and non-financial
performance measures for the purpose of evaluating performance for the Company’s compensation programs, the Company has determined that adjusted EPS is the financial performance measure that, in the Company’s assessment, represents the most important performance measure (that is not otherwise required to be disclosed in the table above) used by the Company to link compensation actually paid to the Company’s NEOs, for the most recently completed fiscal year, to Company performance. Adjusted EPS for purposes of our incentive-compensation programs is a non-GAAP
financial measure and excludes securities (gains) losses, goodwill impairments, charitable contributions, FDIC special assessments, discrete tax benefits, legal accruals, and certain other selected items.
non-GAAP
financial measures that include adjustments to the corresponding GAAP amounts. As such, the terms “EPS”, “Operating Leverage”, “PPNR”, and “ROTCE” as used in this PvP section refer to as-adjusted values. Accordingly, the as-adjusted
values used for compensation purposes may differ from those identified in Section 2—Performance
of the Compensation Discussion and Analysis
or the Company’s financial reporting disclosures. For additional detail regarding these adjustments and the calculation of adjusted EPS, Operating Leverage, PPNR, and ROTCE, and TBVPS + Dividend Growth for 2025 and 2024, please refer to Annex A.