Pay vs Performance Disclosure
Dec. 31, 2025
USD ($)
Dec. 31, 2024
USD ($)
Dec. 31, 2023
USD ($)
Dec. 31, 2022
USD ($)
Dec. 31, 2021
USD ($)
Pay-Versus-Performance
The following table presents certain information regarding compensation paid to Trustmark’s CEO and other
NEOs
, and certain measures of financial performance, for the five years ended December 31, 2025. Year |
Summary Compensation Table Total for CEO ($) |
Compensation Actually Paid to CEO (1) ($) |
Average Summary Compensation Table Total for non-CEO Named Executive Officers (2) ($) |
Average Compensation Actually Paid to non-CEO Named Executive Officers (1) ($) |
Value of Initial Fixed $100 Investment Based on: |
Net Income ($ in thousands) ($) |
ROATE (4) (%) | |||||||||
Trustmark Total Shareholder Return ($) |
S&P 500 Regional Banks TotalShareholder Return (3) ($) | |||||||||||||||
2025 |
$ 3,635,690 | $ 3,704,208 | $ 1,364,521 | $ 1,376,653 | $ 165.91 | $ 126.79 | $ 224,135 | 12.97% | ||||||||
2024 |
$ 3,241,681 | $ 4,049,459 | $ 1,289,070 | $ 1,542,097 | $ 120.56 | $ 102.05 | $ 223,009 | 12.71% | ||||||||
2023 |
$ 2,840,046 | $ 2,327,122 | $ 1,077,576 | $ 951,013 | $ 92.30 | $ 78.33 | $ 165,489 | 12.95% | ||||||||
2022 |
$ 2,739,279 | $ 2,810,846 | $ 1,047,684 | $ 1,056,136 | $ 111.19 | $ 99.93 | $ 71,887 | 10.78% | ||||||||
2021 |
$ 2,472,426 | $ 2,666,493 | $ 1,151,155 | $ 1,222,268 | $ 100.46 | $ 134.16 | $ 147,365 | 10.38% | ||||||||
(1) |
The dollar amounts reported in this column represent the amount of “compensation actually paid” to the CEO or the non-CEO NEOs as a group, as applicable, as computed in accordance with Item 402(v) of Regulation S-K. The dollar amounts do not reflect the actual amount of compensation earned by or paid to the CEO or the non-CEO NEOs as a group during the applicable year. See the “Adjustments to Calculate Compensation Actually Paid” table on page 39 for details of the adjustments to total compensation as shown in the Summary Compensation Table to determine compensation actually paid in accordance with Item 402(v) of Regulation S-K. |
(2) |
In 2025, 2024, 2023 and 2022, the other NEOs were Messrs. Owens, Harvey, Stevens and Tate. In 2021, the other NEOs were Messrs. Owens, Host, Harvey, Tate and Louis E. Greer (former CFO). |
(3) |
Market index used for this column is S&P 500 – Regional Banks. |
(4) |
Return on average tangible equity (ROATE) is calculated using net income adjusted for intangible amortization divided by total average tangible common equity (total shareholders’ equity less goodwill and other identifiable intangible assets); it excludes the impact of (i) restructurings, discontinued operations, extraordinary items and other significant non-routine transactions, (ii) material litigation and insurance settlements, (iii) changes to comply with ASU 2016-02 and ASU 2016-13, and (iv) cumulative effects of income tax and accounting changes in accordance with GAAP. |
38
Adjustments to Calculate Compensation Actually Paid
.
The table below shows the details of the adjustments to total compensation as shown in the Summary Compensation Table to determine compensation actually paid in accordance with Item 402(v) of Regulation S-K.
CEO |
Average Non-CEO NEOs |
|||||||||||||||||||||||||||||||||||||||
2025 |
2024 |
2023 |
2022 |
2021 |
2025 |
2024 |
2023 |
2022 |
2021 |
|||||||||||||||||||||||||||||||
Total Compensation per Summary Compensation Table |
$ |
3,635,690 |
$ |
3,241,681 |
$ |
2,840,046 |
$ |
2,739,279 |
$ |
2,472,426 |
$ |
1,364,521 |
$ |
1,289,070 |
$ |
1,077,576 |
$ |
1,047,684 |
$ |
1,151,155 |
||||||||||||||||||||
| Less Reported Change in Actuarial Present Value of Pension Benefits (1) | (117,483 | ) | (12,410 | ) | (115,653 | ) | --- | --- | (52,318 | ) | --- | (47,836 | ) | --- | --- | |||||||||||||||||||||||||
| Less Reported Value of Equity Awards (2) | 991,904 | (843,828 | ) | (840,180 | ) | (799,741 | ) | (909,128 | ) | (297,583 | ) | (305,638 | ) | (247,110 | ) | (249,936 | ) | (405,875 | ) | |||||||||||||||||||||
Summary Compensation Table Adjustments |
$ |
(1,109,387 |
) |
$ |
(856,238 |
) |
$ |
(955,833 |
) |
$ |
(799,741 |
) |
$ |
(909,128 |
) |
$ |
(349,901 |
) |
$ |
(305,638 |
) |
$ |
(294,946 |
) |
$ |
(249,936 |
) |
$ |
(405,875 |
) | ||||||||||
| Additional Service Cost | --- | --- | --- | --- | --- | 3,569 | 11,131 | 10,615 | 9,804 | 7,024 | ||||||||||||||||||||||||||||||
| Additional Prior Service Cost | --- | --- | --- | --- | --- | --- | --- | --- | --- | --- | ||||||||||||||||||||||||||||||
Pension Benefit Adjustments (3) |
--- |
--- |
--- |
--- |
--- |
$ |
3,569 |
$ |
11,131 |
$ |
10,615 |
$ |
9,804 |
$ |
7,024 |
|||||||||||||||||||||||||
| Year-end Fair Value of Outstanding and Unvested Equity Awards Granted During Year | 1,027,753 | 1,114,695 | 785,583 | 854,411 | 1,019,072 | 308,337 | 380,612 | 231,052 | 267,021 | 420,591 | ||||||||||||||||||||||||||||||
| Year over Year Change in Fair Value of Outstanding and Unvested Equity Awards | 80,616 | 523,394 | (339,584 | ) | 70,676 | 63,329 | 29,083 | 159,742 | (68,464 | ) | 19,986 | 48,416 | ||||||||||||||||||||||||||||
| Fair Value of Vesting Date of Equity Awards Granted and Vested in the Year | --- | --- | --- | --- | --- | --- | --- | --- | --- | 21,036 | ||||||||||||||||||||||||||||||
| Year over Year Change in Fair Value Equity Awards Granted in Prior Years that Vested in the Year | 28,161 | (12,853 | ) | (28,418 | ) | 92 | 7,985 | 8,800 | (4,434 | ) | (10,555 | ) | 55 | 16,684 | ||||||||||||||||||||||||||
| Fair Value at the End of the Prior Year of Equity Awards that Failed to Meet Vesting Conditions in the Year | --- | --- | (8,239 | ) | (79,449 | ) | (5,726 | ) | --- | --- | (3,053 | ) | (47,671 | ) | (46,728 | ) | ||||||||||||||||||||||||
| Value of Dividends or other Earnings Paid on Stock or Option Awards Not Otherwise Reflected in Fair Value or Total Compensation | 41,375 | 38,780 | 33,567 | 25,578 | 18,535 | 12,244 | 11,614 | 8,788 | 9,193 | 9,965 | ||||||||||||||||||||||||||||||
Total Equity Award Adjustments (4) |
$ |
1,177,905 |
$ |
1,664,016 |
$ |
442,909 |
$ |
871,308 |
$ |
1,103,195 |
$ |
358,464 |
$ |
547,534 |
$ |
157,768 |
$ |
248,584 |
$ |
469,964 |
||||||||||||||||||||
Compensation Actually Paid |
$ |
3,704,208 |
$ |
4,049,459 |
$ |
2,327,122 |
$ |
2,810,846 |
$ |
2,666,493 |
$ |
1,376,653 |
$ |
1,542,097 |
$ |
951,013 |
$ |
1,056,136 |
$ |
1,222,268 |
||||||||||||||||||||
(1) |
Represents amounts reported in “Change in Pension Value and Non-Qualified Deferred Compensation Earnings” column of the Summary Com pen sation Table for each applicable year (and the average of such amounts for the Non-CEO NEOs). |
(2) |
Represents the total of the amounts reported in the “Stock Awards” column in the Summary Compensation Table for the applicable year (and the average of such amounts for the Non-CEO NEOs). |
(3) |
The total pension benefit adjustments for each applicable year include the aggregate of two components: (i) the actuarially determined service cost for services rendered by the CEO or the non-CEO NEOs as a group during the applicable year (the “service cost”); and (ii) the entire cost of benefits granted in a plan amendment (or initiation) during the applicable year that are attributed by the benefit formula to services rendered in periods prior to the plan amendment or initiation (the “prior service cost”), in each case, calculated in accordance with GAAP. |
(4) |
The equity award adjustments for each applicable year are made in accordance with Item 402(v)(2)(iii)(C) of Regulation S-K. |
(2) |
In 2025, 2024, 2023 and 2022, the other NEOs were Messrs. Owens, Harvey, Stevens and Tate. In 2021, the other NEOs were Messrs. Owens, Host, Harvey, Tate and Louis E. Greer (former CFO). |
(3) |
Market index used for this column is S&P 500 – Regional Banks. |
The dollar amounts reported in this column represent the amount of “compensation actually paid” to the CEO or the non-CEO NEOs as a group, as applicable, as computed in accordance with Item 402(v) of Regulation S-K. The dollar amounts do not reflect the actual amount of compensation earned by or paid to the CEO or the non-CEO NEOs as a group during the applicable year. See the “Adjustments to Calculate Compensation Actually Paid” table on page 39 for details of the adjustments to total compensation as shown in the Summary Compensation Table to determine compensation actually paid in accordance with Item 402(v) of Regulation S-K.
Adjustments to Calculate Compensation Actually Paid
.
The table below shows the details of the adjustments to total compensation as shown in the Summary Compensation Table to determine compensation actually paid in accordance with Item 402(v) of Regulation S-K.
CEO |
Average Non-CEO NEOs |
|||||||||||||||||||||||||||||||||||||||
2025 |
2024 |
2023 |
2022 |
2021 |
2025 |
2024 |
2023 |
2022 |
2021 |
|||||||||||||||||||||||||||||||
Total Compensation per Summary Compensation Table |
$ |
3,635,690 |
$ |
3,241,681 |
$ |
2,840,046 |
$ |
2,739,279 |
$ |
2,472,426 |
$ |
1,364,521 |
$ |
1,289,070 |
$ |
1,077,576 |
$ |
1,047,684 |
$ |
1,151,155 |
||||||||||||||||||||
| Less Reported Change in Actuarial Present Value of Pension Benefits (1) | (117,483 | ) | (12,410 | ) | (115,653 | ) | --- | --- | (52,318 | ) | --- | (47,836 | ) | --- | --- | |||||||||||||||||||||||||
| Less Reported Value of Equity Awards (2) | 991,904 | (843,828 | ) | (840,180 | ) | (799,741 | ) | (909,128 | ) | (297,583 | ) | (305,638 | ) | (247,110 | ) | (249,936 | ) | (405,875 | ) | |||||||||||||||||||||
Summary Compensation Table Adjustments |
$ |
(1,109,387 |
) |
$ |
(856,238 |
) |
$ |
(955,833 |
) |
$ |
(799,741 |
) |
$ |
(909,128 |
) |
$ |
(349,901 |
) |
$ |
(305,638 |
) |
$ |
(294,946 |
) |
$ |
(249,936 |
) |
$ |
(405,875 |
) | ||||||||||
| Additional Service Cost | --- | --- | --- | --- | --- | 3,569 | 11,131 | 10,615 | 9,804 | 7,024 | ||||||||||||||||||||||||||||||
| Additional Prior Service Cost | --- | --- | --- | --- | --- | --- | --- | --- | --- | --- | ||||||||||||||||||||||||||||||
Pension Benefit Adjustments (3) |
--- |
--- |
--- |
--- |
--- |
$ |
3,569 |
$ |
11,131 |
$ |
10,615 |
$ |
9,804 |
$ |
7,024 |
|||||||||||||||||||||||||
| Year-end Fair Value of Outstanding and Unvested Equity Awards Granted During Year | 1,027,753 | 1,114,695 | 785,583 | 854,411 | 1,019,072 | 308,337 | 380,612 | 231,052 | 267,021 | 420,591 | ||||||||||||||||||||||||||||||
| Year over Year Change in Fair Value of Outstanding and Unvested Equity Awards | 80,616 | 523,394 | (339,584 | ) | 70,676 | 63,329 | 29,083 | 159,742 | (68,464 | ) | 19,986 | 48,416 | ||||||||||||||||||||||||||||
| Fair Value of Vesting Date of Equity Awards Granted and Vested in the Year | --- | --- | --- | --- | --- | --- | --- | --- | --- | 21,036 | ||||||||||||||||||||||||||||||
| Year over Year Change in Fair Value Equity Awards Granted in Prior Years that Vested in the Year | 28,161 | (12,853 | ) | (28,418 | ) | 92 | 7,985 | 8,800 | (4,434 | ) | (10,555 | ) | 55 | 16,684 | ||||||||||||||||||||||||||
| Fair Value at the End of the Prior Year of Equity Awards that Failed to Meet Vesting Conditions in the Year | --- | --- | (8,239 | ) | (79,449 | ) | (5,726 | ) | --- | --- | (3,053 | ) | (47,671 | ) | (46,728 | ) | ||||||||||||||||||||||||
| Value of Dividends or other Earnings Paid on Stock or Option Awards Not Otherwise Reflected in Fair Value or Total Compensation | 41,375 | 38,780 | 33,567 | 25,578 | 18,535 | 12,244 | 11,614 | 8,788 | 9,193 | 9,965 | ||||||||||||||||||||||||||||||
Total Equity Award Adjustments (4) |
$ |
1,177,905 |
$ |
1,664,016 |
$ |
442,909 |
$ |
871,308 |
$ |
1,103,195 |
$ |
358,464 |
$ |
547,534 |
$ |
157,768 |
$ |
248,584 |
$ |
469,964 |
||||||||||||||||||||
Compensation Actually Paid |
$ |
3,704,208 |
$ |
4,049,459 |
$ |
2,327,122 |
$ |
2,810,846 |
$ |
2,666,493 |
$ |
1,376,653 |
$ |
1,542,097 |
$ |
951,013 |
$ |
1,056,136 |
$ |
1,222,268 |
||||||||||||||||||||
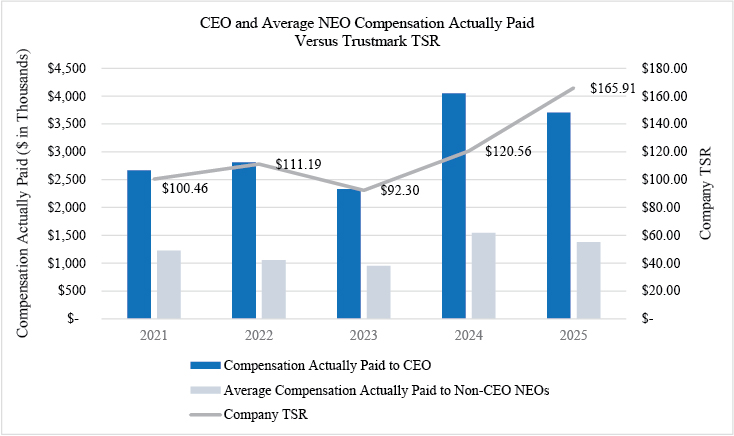
Relationship Between Compensation Actually Paid and Company TSR
.
The following chart sets forth the relationship between Compensation Actually Paid to our CEO, the average of Compensation Actually Paid to our non-CEO NEOs, and the Company’s cumulative TSR over the five most recently completed fiscal years.
Relationship Between Compensation Actually Paid and Net Income
.
The following chart sets forth the relationship between Compensation Actually Paid to our CEO, the average of Compensation Actually Paid to our
non-CEO
NEOs, and our net income over the five most recently completed fiscal years.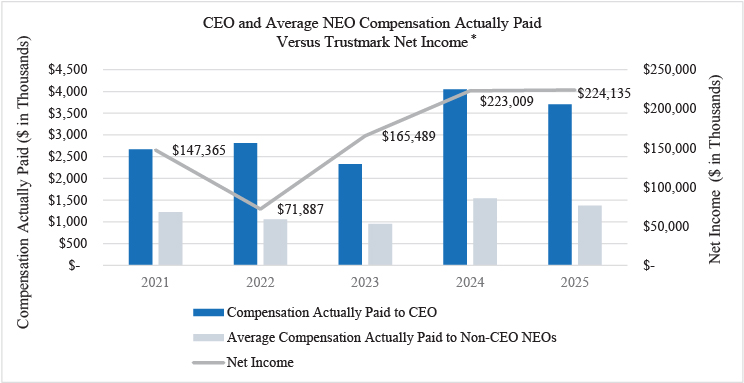
* |
The chart above shows net income determined in accordance with GAAP. Net income from continuing operations adjusted for significant non-routine transactions, which is a non-GAAP financial measure, was $147.3 million (2021), $136.5 million (2022), $159.2 million (2023), and $186.3 million (2024). There were no significant non-routine transactions in 2025. Information regarding significant non-routine transactions is included in Trustmark’s Form 10-K for each appropriate year. |
Relationship Between Compensation Actually Paid and Return on Average Tangible Equity
.
The following chart sets forth the relationship between Compensation Actually Paid to our CEO, the average of Compensation Actually Paid to our
non-CEO
NEOs, and the Company’s Return on Average Tangible Equity over the five most recently completed fiscal years.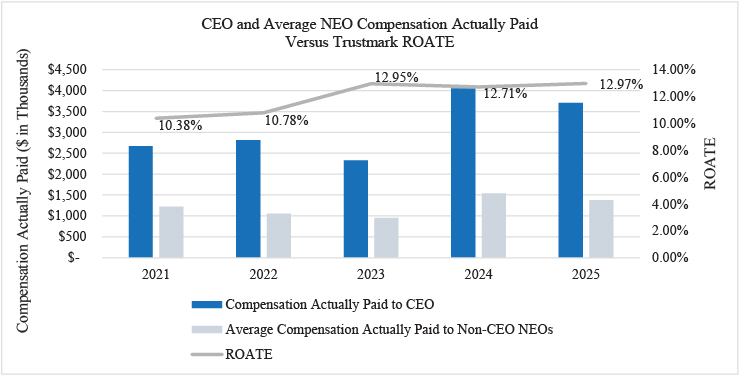
Company TSR versus S&P 500 Regional Banks TSR
. The
relationship
between the company’s TSR and the TSR of S&P 500 Regional Banks index is shown below: 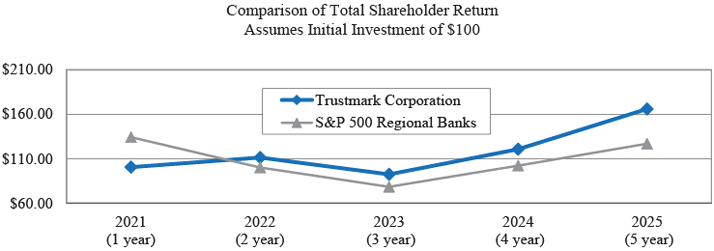
Tabular List of Financial Performance Measures
.
Trustmark considers the following to be the most important financial performance measures it uses to link compensation actually paid to its NEOs, for 2025, to company performance.
| • | ROATE |
| • | EPS |
| • | Efficiency Ratio |
| • | Non-Performing Assets/total loans + ORE |
| • | Non-Interest Expense (Core) |