Pure in Millions
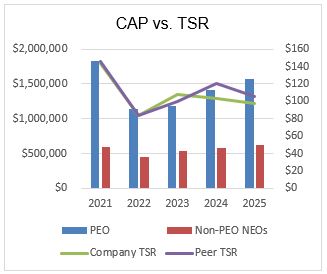
As required by Section 953(a) of the Dodd-Frank Wall Street Reform and Consumer Protection Act, and Item 402(v) of Regulation S-K, we are providing the following information about the relationship between executive compensation actually paid (“CAP”) for our principal executive officer (“PEO”) and our non-PEO named executive officers (“Non-PEO NEOs”) and certain financial performance of the Company. For further information concerning the Company’s pay-for-performance philosophy and how the Company aligns executive compensation with performance, refer to the Compensation Discussion and Analysis portion of this proxy statement.
|
Value of Initial Fixed $100 Based On: |
||||||||||||||||||||||||||||||||
|
Year |
Summary |
Compensation |
Average |
Average |
Total |
Peer Group Total Shareholder Return(6) |
Net |
Core Net Income (millions)(8) |
||||||||||||||||||||||||
|
(a) |
(b) |
(c) |
(d) |
(e) |
(f) |
(g) |
(h) |
(i) |
||||||||||||||||||||||||
|
2025
|
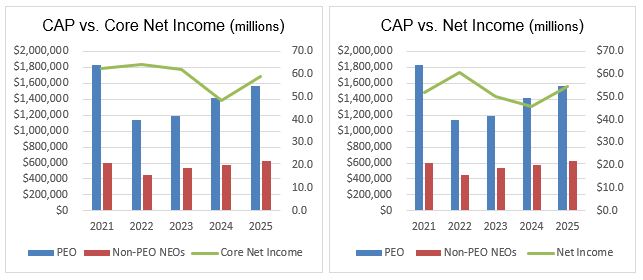
$ | 1,644,243 | $ | 1,565,033 | $ | 661,897 | $ | 619,517 | $ | 98 | $ | 106 | $ | 54.6 | $ | 59.0 | ||||||||||||||||
|
2024 |
$ | 1,435,778 | $ | 1,413,407 | $ | 583,847 | $ | 578,350 | $ | 103 | $ | 120 | $ | 45.9 | $ | 48.2 | ||||||||||||||||
|
2023 |
$ | 1,159,314 | $ | 1,183,259 | $ | 541,464 | $ | 537,863 | $ | 108 | $ | 100 | $ | 49.9 | $ | 61.8 | ||||||||||||||||
|
2022 |
$ | 1,471,138 | $ | 1,137,486 | $ | 505,850 | $ | 450,071 | $ | 84 | $ | 84 | $ | 60.6 | $ | 64.0 | ||||||||||||||||
|
2021 |
$ | 1,528,022 | $ | 1,826,820 | $ | 525,658 | $ | 596,591 | $ | 144 | $ | 146 | $ | 51.8 | $ | 62.3 | ||||||||||||||||
(1) The amounts reported in column (b) are the amounts of total compensation reported for Mr. Helmick, our PEO, for each corresponding year in the “Total” column of the Summary Compensation Table. Refer to “Executive Compensation and Other Information – Summary Compensation Table.”
(2) The amounts reported in column (c) represent the amount of CAP for Mr. Helmick as computed in accordance with Item 402(v) of Regulation S-K. Amounts do not reflect the actual amount of compensation earned by or paid to Mr. Helmick during the applicable year. In accordance with the requirements of Item 402(v) of Regulation S-K, the following adjustments were made to Mr. Helmick’s total compensation for each year to determine the CAP:
|
Year |
Reported |
Reported |
Equity |
Compensation |
||||||||||||
|
2025 |
$ | 1,644,243 | $ | 331,913 | $ | 252,703 | $ | 1,565,033 | ||||||||
|
2024 |
$ | 1,435,778 | $ | 302,978 | $ | 280,607 | $ | 1,413,407 | ||||||||
|
2023 |
$ | 1,159,314 | $ | 256,324 | $ | 280,269 | $ | 1,183,259 | ||||||||
|
2022 |
$ | 1,471,138 | $ | 575,207 | $ | 241,555 | $ | 1,137,486 | ||||||||
|
2021 |
$ | 1,528,022 | $ | 199,768 | $ | 498,566 | $ | 1,826,820 | ||||||||
(a) The grant date fair value of equity awards represents the total of the amounts reported in the “Stock Awards” column in the Summary Compensation Table for the applicable year.
(b) The equity award adjustments for each applicable year include the addition (or subtraction, as applicable) of the following: (i) the year-end fair value of any equity awards granted in the applicable year that are outstanding and unvested as of the end of the year; (ii) the amount of change as of the end of the applicable year in fair value of any awards granted in prior years that are outstanding and unvested as of the end of the applicable year (from the end of the prior fiscal year); (iii) for awards that are granted and vest in same applicable year, the fair value as of the vesting date; (iv) for awards granted in prior years that vest in the applicable year, the amount equal to the change as of the vesting date in fair value (from the end of the prior fiscal year); (v) for awards granted in prior years that are determined to fail to meet the applicable vesting conditions during the applicable year, a deduction for the amount equal to the fair value at the end of the prior fiscal year; and (vi) the dollar value of any dividends or other earnings paid on stock awards in the applicable year prior to the vesting date that are not otherwise reflected in the fair value of such award or included in any other component of total compensation for the applicable year. The valuation assumptions used to calculate fair values did not materially differ from those disclosed at the time of grant.
The amounts deducted or added in calculating the equity award adjustments are as follows:
|
Year |
Year End Fair |
Change in |
Fair Value |
Change in |
Fair Value at |
Value of |
Total |
|||||||||||||||||||
|
2025 |
$ | 305,534 | $ | (60,059 | ) | N/A | $ | 7,228 | $ | 0 | N/A | $ | 252,703 | |||||||||||||
|
2024 |
$ | 311,973 | $ | (16,244 | ) | N/A | $ | (15,122 | ) | $ | 0 | N/A | $ | 280,607 | ||||||||||||
|
2023 |
$ | 261,574 | $ | 14,149 | N/A | $ | 4,546 | $ | 0 | N/A | $ | 280,269 | ||||||||||||||
|
2022 |
$ | 462,571 | $ | (192,235 | ) | N/A | $ | (28,781 | ) | $ | 0 | N/A | $ | 241,555 | ||||||||||||
|
2021 |
$ | 263,002 | $ | 224,020 | N/A | $ | 11,544 | $ | 0 | N/A | $ | 498,566 | ||||||||||||||
(3) Amounts reported in column (d) represent the average of the amounts reported for the Company’s Non-PEO NEOs as a group in the “Total” column of the Summary Compensation Table in each applicable year. The names of each of the Non–CEO NEOs included for purposes of calculating the average amounts in each applicable year are as follows: (i) for 2025, Troy Adair, Myke Matuszak, Amber Wallace Soukenik, and Mark Wenick; (ii) for 2024 and 2023, Troy Adair, Myke Matuszak, Timothy F. Shaffer, and Mark Wenick; (iii) for 2022, Troy Adair, Tim Carney, James Gasior, and Mark Wenick; and (iv) for 2021, Troy Adair, Carl D. Culp, Timothy F. Shaffer, Amber Wallace Soukenik, and Mark Wenick.
(4) Amounts reported in column (e) represent the average amount of CAP for the Non-PEO NEOs as a group as computed in accordance with Item 402(v) of Regulation S-K. The dollar amounts do not reflect the actual average amount of compensation earned by or paid to the Non-PEO NEOs as a group during the applicable year. In accordance with the requirements of Item 402(v) of Regulation S-K, the following adjustments were made to average total compensation for the Non-PEO NEOs as a group for each year to determine the CAP, using the same methodology described above in Note 2:
|
Year |
Average |
Average |
Average |
Average |
||||||||||||
|
2025 |
$ | 661,897 | $ | 102,534 | $ | 60,154 | $ | 619,517 | ||||||||
|
2024 |
$ | 583,847 | $ | 92,700 | $ | 87,203 | $ | 578,350 | ||||||||
|
2023 |
$ | 541,464 | $ | 108,451 | $ | 104,850 | $ | 537,863 | ||||||||
|
2022 |
$ | 505,850 | $ | 142,108 | $ | 86,329 | $ | 450,071 | ||||||||
|
2021 |
$ | 525,658 | $ | 83,035 | $ | 154,328 | $ | 596,591 | ||||||||
(a) The amounts deducted or added in calculating the total average equity award adjustments are as follows:
|
Year |
Average |
Average |
Average |
Average |
Average |
Average Value |
Total |
|||||||||||||||||||
|
2025 |
$ | 75,508 | $ | (16,238 | ) | N/A | $ | 884 | $ | 0 | N/A | $ | 60,154 | |||||||||||||
|
2024 |
$ | 95,452 | $ | (4,605 | ) | N/A | $ | (3,644 | ) | $ | 0 | N/A | $ | 87,203 | ||||||||||||
|
2023 |
$ | 102,086 | $ | 4,277 | N/A | $ | (1,513 | ) | $ | 0 | N/A | $ | 104,850 | |||||||||||||
|
2022 |
$ | 114,146 | $ | (22,858 | ) | N/A | $ | (4,959 | ) | $ | 0 | N/A | $ | 86,329 | ||||||||||||
|
2021 |
$ | 103,806 | $ | 47,864 | N/A | $ | 2,658 | $ | 0 | N/A | $ | 154,328 | ||||||||||||||
(5) Cumulative TSR is calculated by dividing the sum of the cumulative amount of dividends for the measurement period, assuming dividend reinvestment, and the difference between the Company’s share price at the end and the beginning of the measurement period by the Company’s share price at the beginning of the measurement period.
(6) Represents the peer group TSR, weighted according to the respective companies’ stock market capitalization at the beginning of each period for which a return is indicated. The peer group used for this purpose is the following published industry index, which is also included in the five year cumulative total return chart included in the Company’s 2024 Annual Report on Form 10-K: Dow Jones U.S. MicroCap Banks Index.
(7) Amounts reported represent the amount of net income reflected in the Company’s audited financial statements for the applicable year.
(8) Core net income is defined as net income adjusted for certain after-tax items including acquisition related costs, litigation settlement income, litigation settlement legal expense, a charitable donation, and net losses on asset/security sales. While the Company uses numerous financial and non-financial performance measures for the purpose of evaluating performance for the Company’s compensation programs, the Company has determined that Core Net Income is the financial performance measure that, in the Company’s assessment, represents the most important performance measure (that is not otherwise required to be disclosed in the table) used by the Company to link CAP to the Company’s NEOs for the most recently completed fiscal year, to Company performance.
Financial Performance Measures
As described in greater detail in the Compensation Discussion and Analysis portion of this proxy statement, the Company’s executive compensation program embraces a pay-for-performance philosophy. The metrics used for both our long-term and short-term incentive awards are selected based on an overall objective of providing incentives to our NEOs to increase the value of our enterprise for our shareholders. The most important financial performance measures used by the Company to link executive compensation actually paid to the Company’s NEOs to the Company’s performance for the most recently completed fiscal year are as follows:
• Earnings per Share (adjusted) (EPS)
• Return on Average Assets
• Pre-tax Pre-provision Net Income