Pay vs Performance Disclosure - USD ($)
Dec. 31, 2025
Dec. 31, 2024
Dec. 31, 2023
Pay versus Performance Table
Tabular disclosure for the PEO (CEO) and the average NEO (excluding the PEO) for reporting years 2023, 2024, and 2025 is shown in the table below:
Year (1) (a) |
Summary Compensation Table Total for PEO (Mitchell) (2) (b) |
Compensation Actually Paid to PEO (Mitchell) (3) (c) |
Average Summary Compensation Table Total for Non-PEO NEOs (4) (d) |
Average Compensation Actually Paid to Non-PEO NEOs (5) (e) |
Value of Initial Fixed $100 Investment Based on: |
Net Income (GAAP) (8) (h) |
Adjusted EPS (9) (i) |
|||||||||||||||||||||||||
Post- Separation Crane Co. Total Stockholder Return (6) (f) |
Peer Group Total Stockholder Return (7) (g) |
|||||||||||||||||||||||||||||||
2025 |
$10,518,852 | $14,623,697 | $2,512,307 | $3,194,189 | $237.42 | $177.30 | $331.7 | $6.12 | ||||||||||||||||||||||||
2024 |
$ 9,600,139 | $17,309,821 | $2,346,092 | $3,583,444 | $194.33 | $148.45 | $268.2 | $5.32 | ||||||||||||||||||||||||
2023 |
$10,065,027 | $33,526,560 | $2,478,236 | $5,802,807 | $150.46 | $129.94 | $203.8 | $4.16 | ||||||||||||||||||||||||
(1) |
The Pay Versus Performance table reflects required disclosures for fiscal years 2023, 2024, and 2025. |
(2) |
For fiscal years 2023, 2024, and 2025, Mr. Mitchell was the Principal Executive Officer for the Company. |
(3) |
Compensation Actually Paid (CAP) is calculated from the PEO’s SCT compensation total, less the amounts reported in the SCT equity awards (i.e., RSUs, PRSUs, and stock options), less the change in pension value; adding the fair value as of the end of the covered fiscal year of all awards granted during the fiscal year that are outstanding and unvested as of the fiscal year-end; adding the amount equal to the change in fair value as of the end of the covered fiscal year, whether positive or negative, of any awards granted in any prior fiscal year that are outstanding and unvested as of the end of the covered fiscal year; adding the amount equal to the change in fair value as of the vesting date, whether positive or negative, of any award granted in any prior fiscal year for which all applicable vesting conditions were satisfied at the end of or during the covered fiscal year. As described above, equity awards granted to the NEOs prior to the separation were adjusted upon the separation into awards denominated in both Crane Company and Crane NXT stock. The CAP calculations include both the Crane Company component and Crane NXT component of |
| awards that vested during, and/or remained outstanding at the end, of the covered fiscal year. The following table shows the relationship between SCT compensation and CAP: |
Year |
Salary |
Bonus and Non-Equity Incentive Compensation |
All Other Compensation |
Stock Awards |
Options Awards |
Change in Pension Value and Nonqualified Deferred Compensation Earnings |
SCT Total |
Deductions from SCT Total (i) |
Additions to SCT Total (ii) |
CAP |
||||||||||||||||||||||||||||||
2025 |
$1,244,231 | $1,840,200 | $334,881 | $5,480,738 | $1,562,506 | $ 56,296 | $10,518,852 | ($7,099,540 | ) | $11,204,385 | $14,623,697 | |||||||||||||||||||||||||||||
2024 |
$1,200,000 | $1,732,320 | $356,992 | $4,900,834 | $1,409,993 | $ 0 | $ 9,600,139 | ($6,310,827 | ) | $14,020,509 | $17,309,821 | |||||||||||||||||||||||||||||
2023 |
$1,200,000 | $2,610,720 | $256,079 | $4,557,813 | $1,340,013 | $100,402 | $10,065,027 | ($5,998,228 | ) | $29,459,761 | $33,526,560 | |||||||||||||||||||||||||||||
i. |
Represents the grant date fair value of equity-based awards granted during the year and change in pension value. |
ii. |
Additions to the SCT Total reflect the value of equity calculated in accordance with the SEC methodology for determining CAP. The equity awards were revalued using the Monte Carlo values for the PRSUs (which vest based on relative TSR) and the Black-Scholes values for the options. Because the Company includes the amount of cash dividends paid with respect to unvested TRSUs as compensation in the All Other Compensation column of the SCT, no adjustments were made for purposes of calculating CAP. Dividends or dividend equivalents do not accrue on stock options or PRSUs. There were no service cost additions to be made with respect to pension values because the Crane Company’s pension plan was previously frozen. |
Equity Reconciliation Detail for PEO
Year |
Year End Fair Value of Equity Awards Granted in the Year |
Year over Year Change in Fair Value of Outstanding Unvested Equity Awards Granted in Prior Years |
Year over Year Change in Fair Value of Equity Awards Granted in Prior Years that Vested in the Year (i) |
Total Equity Value Included in CAP |
||||||||||||
2025 |
$ 7,495,925 | $ 3,285,589 | $ 422,871 | $11,204,385 | ||||||||||||
2024 |
$ 8,685,169 | $ 3,927,467 | $1,407,872 | $14,020,509 | ||||||||||||
2023 |
$10,515,835 | $12,007,601 | $6,936,325 | $29,459,761 | ||||||||||||
i. |
PRSUs vest on the last day of the applicable performance period, which is also the last day of the applicable fiscal year, but are not delivered until early in the next fiscal year. For purposes of the CAP calculations, however, PRSUs are included as awards that vested in the year and are reflected based on the certified performance results and the stock price on the last day of the performance period. |
(4) |
Includes the average SCT totals of the following Non-PEO Named Executive Officers (NEOs) for the covered fiscal years: Mr. Maue, Mr. D’Iorio, Mr. Alcala, and Ms. Polmanteer. |
(5) |
Average CAP is calculated by averaging the following for the non-PEO NEOs; SCT total, less the amounts reported in the SCT equity awards (i.e., RSUs, PRSUs, and stock options), less the change in pension value; adding the fair value as of the end of the fiscal year of all awards granted during the fiscal year that are outstanding and unvested as of the fiscal year-end; adding the amount equal to the change in fair value as of the end of the fiscal year, whether positive or negative, of any awards granted in the prior fiscal year that are outstanding and unvested as of the end of the fiscal year; adding the amount equal to the change in fair value as of the vesting date, whether positive or negative, of any award granted in any prior fiscal year for which all applicable vesting conditions were satisfied at the end of or during the fiscal year. As described above, equity awards granted to the NEOs prior to the separation were adjusted upon the separation into awards denominated in Crane Company and Crane NXT stock. The CAP calculations include both the Crane Company component and Crane NXT component of awards that vested and/or remained outstanding at the end of the covered fiscal year. The following table shows the relationship between SCT compensation and CAP: |
Average
Non-PEO
NEOs SCT Total to CAP Reconciliation: Year |
Salary |
Bonus and Non-Equity Incentive Compensation |
Other Compensation |
Stock Awards |
Options Awards |
Change in Pension Value and Nonqualified Deferred Compensation Earnings |
SCT Total |
Deductions from SCT Total (i) |
Additions to SCT Total (ii) |
CAP |
||||||||||||||||||||||||||||||
2025 |
$ | 661,563 | $618,053 | $69,910 | $897,785 | $259,376 | $5,620 | $2,512,307 | ($1,162,780 | ) | $1,844,662 | $3,194,189 | ||||||||||||||||||||||||||||
2024 |
$ | 625,634 | $589,810 | $77,944 | $815,207 | $237,497 | $ 0 | $2,346,092 | ($1,052,704 | ) | $2,290,056 | $3,583,444 | ||||||||||||||||||||||||||||
2023 |
$ | 594,250 | $839,775 | $69,186 | $746,608 | $221,874 | $6,542 | $2,478,236 | ($ 975,024 | ) | $4,299,596 | $5,802,807 | ||||||||||||||||||||||||||||
i. |
Represents the average of the NEOs’ grant date fair value of equity-based awards granted during the year and average change in pension value. |
ii. |
Additions to the SCT Total reflect the value of equity calculated in accordance with the SEC methodology for determining CAP. The equity awards were revalued using the Monte Carlo values for the PRSUs (which vest based on relative TSR) and the Black-Scholes values for the options. Because the Company includes the amount of cash dividends paid with respect to unvested TRSUs as compensation in the All Other Compensation column of the SCT, no adjustments were made for purposes of calculating CAP. Dividends or dividend equivalents do not accrue on stock options or PRSUs. There were no service cost additions to be made with respect to pension values because the historic Crane Holdings, Co.’s pension plan was previously frozen. |
Equity Reconciliation Detail for
Non-PEO
NEOs Year |
Year End Fair Value of Equity Awards Granted in the Year |
Year over Year Change in Fair Value of Outstanding Unvested Equity Awards Granted in Prior Years |
Year over Year Change in Fair Value of Equity Awards Granted in Prior Years that Vested in the Year (i) |
Total Equity Value Included in CAP |
||||||||||||
2025 |
$1,231,816 | $ 544,433 | $ 68,413 | $1,844,662 | ||||||||||||
2024 |
$1,439,114 | $ 629,317 | $221,625 | $2,290,056 | ||||||||||||
2023 |
$1,714,276 | $1,768,298 | $817,022 | $4,299,596 | ||||||||||||
i. |
PRSUs vest on the last day of the applicable performance period, which is also the last day of the applicable fiscal year, but are not delivered until early in the next fiscal year. For purposes of the CAP calculations, however, PRSUs are included as awards that vested in the year and are reflected based on the certified performance results and the stock price on the last day of the performance period. |
(6) |
The amount represents the value of an initial fixed $100 investment in Company stock on April 4, 2023 (our first trading day as an independently publicly-traded company), assuming reinvestment of all dividends. |
(7) |
Peer group companies include those comprising the S&P 400 MidCap Capital Goods Index, which Crane also uses in its stock performance graph disclosure in the Form 10-K. The amount represents the value of an initial fixed $100 investment in the index on April 4, 2023 (our first trading day as an independently publicly-traded company), assuming reinvestment of all dividends. |
(8) |
Represents the Company’s Net Earnings (Loss) Attributable to Crane (in millions) for the covered fiscal year. |
(9) |
Adjusted EPS is calculated as Earnings from continuing operations per diluted share excluding special items, as used for determining annual incentive compensation awards. |
Non-PEO
Named Executive Officers (NEOs) for the covered fiscal years: Mr. Maue, Mr. D’Iorio, Mr. Alcala, and Ms. Polmanteer.
10-K.
The amount represents the value of an initial fixed $100 investment in the index on April 4, 2023 (our first trading day as an independently publicly-traded company), assuming reinvestment of all dividends.
(3) |
Compensation Actually Paid (CAP) is calculated from the PEO’s SCT compensation total, less the amounts reported in the SCT equity awards (i.e., RSUs, PRSUs, and stock options), less the change in pension value; adding the fair value as of the end of the covered fiscal year of all awards granted during the fiscal year that are outstanding and unvested as of the fiscal year-end; adding the amount equal to the change in fair value as of the end of the covered fiscal year, whether positive or negative, of any awards granted in any prior fiscal year that are outstanding and unvested as of the end of the covered fiscal year; adding the amount equal to the change in fair value as of the vesting date, whether positive or negative, of any award granted in any prior fiscal year for which all applicable vesting conditions were satisfied at the end of or during the covered fiscal year. As described above, equity awards granted to the NEOs prior to the separation were adjusted upon the separation into awards denominated in both Crane Company and Crane NXT stock. The CAP calculations include both the Crane Company component and Crane NXT component of |
| awards that vested during, and/or remained outstanding at the end, of the covered fiscal year. The following table shows the relationship between SCT compensation and CAP: |
Year |
Salary |
Bonus and Non-Equity Incentive Compensation |
All Other Compensation |
Stock Awards |
Options Awards |
Change in Pension Value and Nonqualified Deferred Compensation Earnings |
SCT Total |
Deductions from SCT Total (i) |
Additions to SCT Total (ii) |
CAP |
||||||||||||||||||||||||||||||
2025 |
$1,244,231 | $1,840,200 | $334,881 | $5,480,738 | $1,562,506 | $ 56,296 | $10,518,852 | ($7,099,540 | ) | $11,204,385 | $14,623,697 | |||||||||||||||||||||||||||||
2024 |
$1,200,000 | $1,732,320 | $356,992 | $4,900,834 | $1,409,993 | $ 0 | $ 9,600,139 | ($6,310,827 | ) | $14,020,509 | $17,309,821 | |||||||||||||||||||||||||||||
2023 |
$1,200,000 | $2,610,720 | $256,079 | $4,557,813 | $1,340,013 | $100,402 | $10,065,027 | ($5,998,228 | ) | $29,459,761 | $33,526,560 | |||||||||||||||||||||||||||||
i. |
Represents the grant date fair value of equity-based awards granted during the year and change in pension value. |
ii. |
Additions to the SCT Total reflect the value of equity calculated in accordance with the SEC methodology for determining CAP. The equity awards were revalued using the Monte Carlo values for the PRSUs (which vest based on relative TSR) and the Black-Scholes values for the options. Because the Company includes the amount of cash dividends paid with respect to unvested TRSUs as compensation in the All Other Compensation column of the SCT, no adjustments were made for purposes of calculating CAP. Dividends or dividend equivalents do not accrue on stock options or PRSUs. There were no service cost additions to be made with respect to pension values because the Crane Company’s pension plan was previously frozen. |
Equity Reconciliation Detail for PEO
Year |
Year End Fair Value of Equity Awards Granted in the Year |
Year over Year Change in Fair Value of Outstanding Unvested Equity Awards Granted in Prior Years |
Year over Year Change in Fair Value of Equity Awards Granted in Prior Years that Vested in the Year (i) |
Total Equity Value Included in CAP |
||||||||||||
2025 |
$ 7,495,925 | $ 3,285,589 | $ 422,871 | $11,204,385 | ||||||||||||
2024 |
$ 8,685,169 | $ 3,927,467 | $1,407,872 | $14,020,509 | ||||||||||||
2023 |
$10,515,835 | $12,007,601 | $6,936,325 | $29,459,761 | ||||||||||||
(5) |
Average CAP is calculated by averaging the following for the non-PEO NEOs; SCT total, less the amounts reported in the SCT equity awards (i.e., RSUs, PRSUs, and stock options), less the change in pension value; adding the fair value as of the end of the fiscal year of all awards granted during the fiscal year that are outstanding and unvested as of the fiscal year-end; adding the amount equal to the change in fair value as of the end of the fiscal year, whether positive or negative, of any awards granted in the prior fiscal year that are outstanding and unvested as of the end of the fiscal year; adding the amount equal to the change in fair value as of the vesting date, whether positive or negative, of any award granted in any prior fiscal year for which all applicable vesting conditions were satisfied at the end of or during the fiscal year. As described above, equity awards granted to the NEOs prior to the separation were adjusted upon the separation into awards denominated in Crane Company and Crane NXT stock. The CAP calculations include both the Crane Company component and Crane NXT component of awards that vested and/or remained outstanding at the end of the covered fiscal year. The following table shows the relationship between SCT compensation and CAP: |
Average
Non-PEO
NEOs SCT Total to CAP Reconciliation: Year |
Salary |
Bonus and Non-Equity Incentive Compensation |
Other Compensation |
Stock Awards |
Options Awards |
Change in Pension Value and Nonqualified Deferred Compensation Earnings |
SCT Total |
Deductions from SCT Total (i) |
Additions to SCT Total (ii) |
CAP |
||||||||||||||||||||||||||||||
2025 |
$ | 661,563 | $618,053 | $69,910 | $897,785 | $259,376 | $5,620 | $2,512,307 | ($1,162,780 | ) | $1,844,662 | $3,194,189 | ||||||||||||||||||||||||||||
2024 |
$ | 625,634 | $589,810 | $77,944 | $815,207 | $237,497 | $ 0 | $2,346,092 | ($1,052,704 | ) | $2,290,056 | $3,583,444 | ||||||||||||||||||||||||||||
2023 |
$ | 594,250 | $839,775 | $69,186 | $746,608 | $221,874 | $6,542 | $2,478,236 | ($ 975,024 | ) | $4,299,596 | $5,802,807 | ||||||||||||||||||||||||||||
i. |
Represents the average of the NEOs’ grant date fair value of equity-based awards granted during the year and average change in pension value. |
ii. |
Additions to the SCT Total reflect the value of equity calculated in accordance with the SEC methodology for determining CAP. The equity awards were revalued using the Monte Carlo values for the PRSUs (which vest based on relative TSR) and the Black-Scholes values for the options. Because the Company includes the amount of cash dividends paid with respect to unvested TRSUs as compensation in the All Other Compensation column of the SCT, no adjustments were made for purposes of calculating CAP. Dividends or dividend equivalents do not accrue on stock options or PRSUs. There were no service cost additions to be made with respect to pension values because the historic Crane Holdings, Co.’s pension plan was previously frozen. |
Equity Reconciliation Detail for
Non-PEO
NEOs Year |
Year End Fair Value of Equity Awards Granted in the Year |
Year over Year Change in Fair Value of Outstanding Unvested Equity Awards Granted in Prior Years |
Year over Year Change in Fair Value of Equity Awards Granted in Prior Years that Vested in the Year (i) |
Total Equity Value Included in CAP |
||||||||||||
2025 |
$1,231,816 | $ 544,433 | $ 68,413 | $1,844,662 | ||||||||||||
2024 |
$1,439,114 | $ 629,317 | $221,625 | $2,290,056 | ||||||||||||
2023 |
$1,714,276 | $1,768,298 | $817,022 | $4,299,596 | ||||||||||||
Relationship between CAP and TSR
The chart below reflects the relationship between the PEO and Average
Non-PEO
NEO CAP, the Company’s TSR, Crane NXT’s TSR, and the TSR Peer Group in the above table for 2023, 2024, and 2025 – the S&P 400 MidCap Capital Goods Index, which is also used to determine relative TSR performance for PRSU payouts. As noted above under “Pay versus Performance Calculations and Impact of the Separation” and as illustrated in the graphics above, the equity awards held by the Company’s NEOs following the separation, as reflected in CAP values, are tied to the value of both Crane Company and Crane NXT stock prices and performance, as applicable. 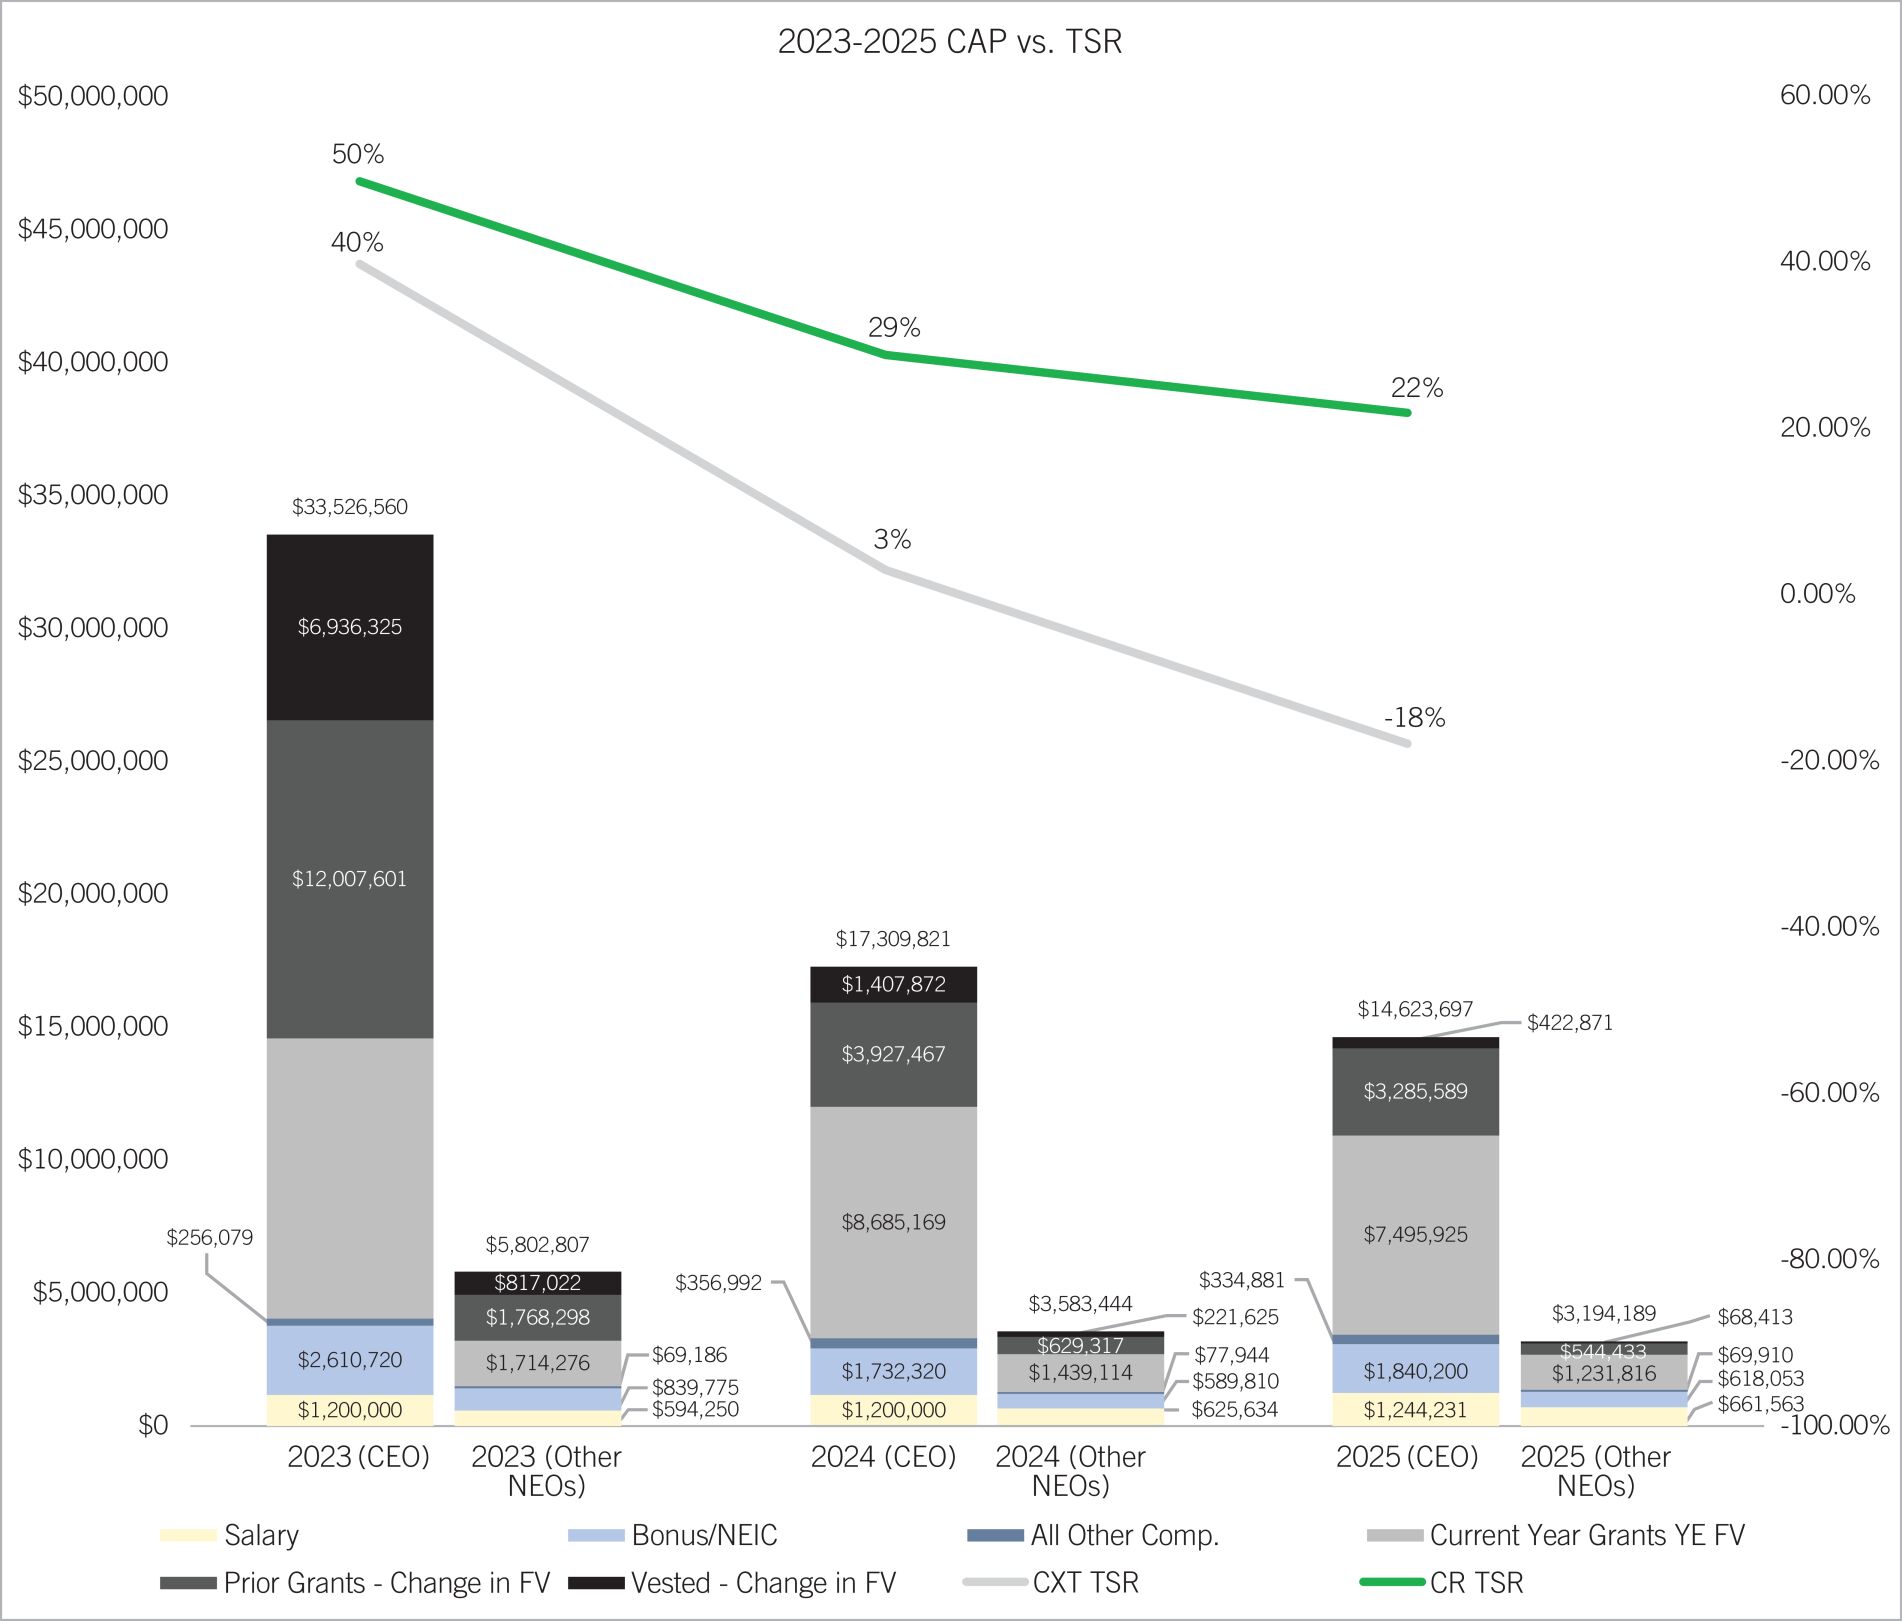
Relationship between CAP and GAAP Net Income
The chart below reflects the relationship between the PEO and Average
Non-PEO
NEO CAP (per the SEC’s definition), and the Company’s GAAP Net Income in 2023, 2024, and 2025. 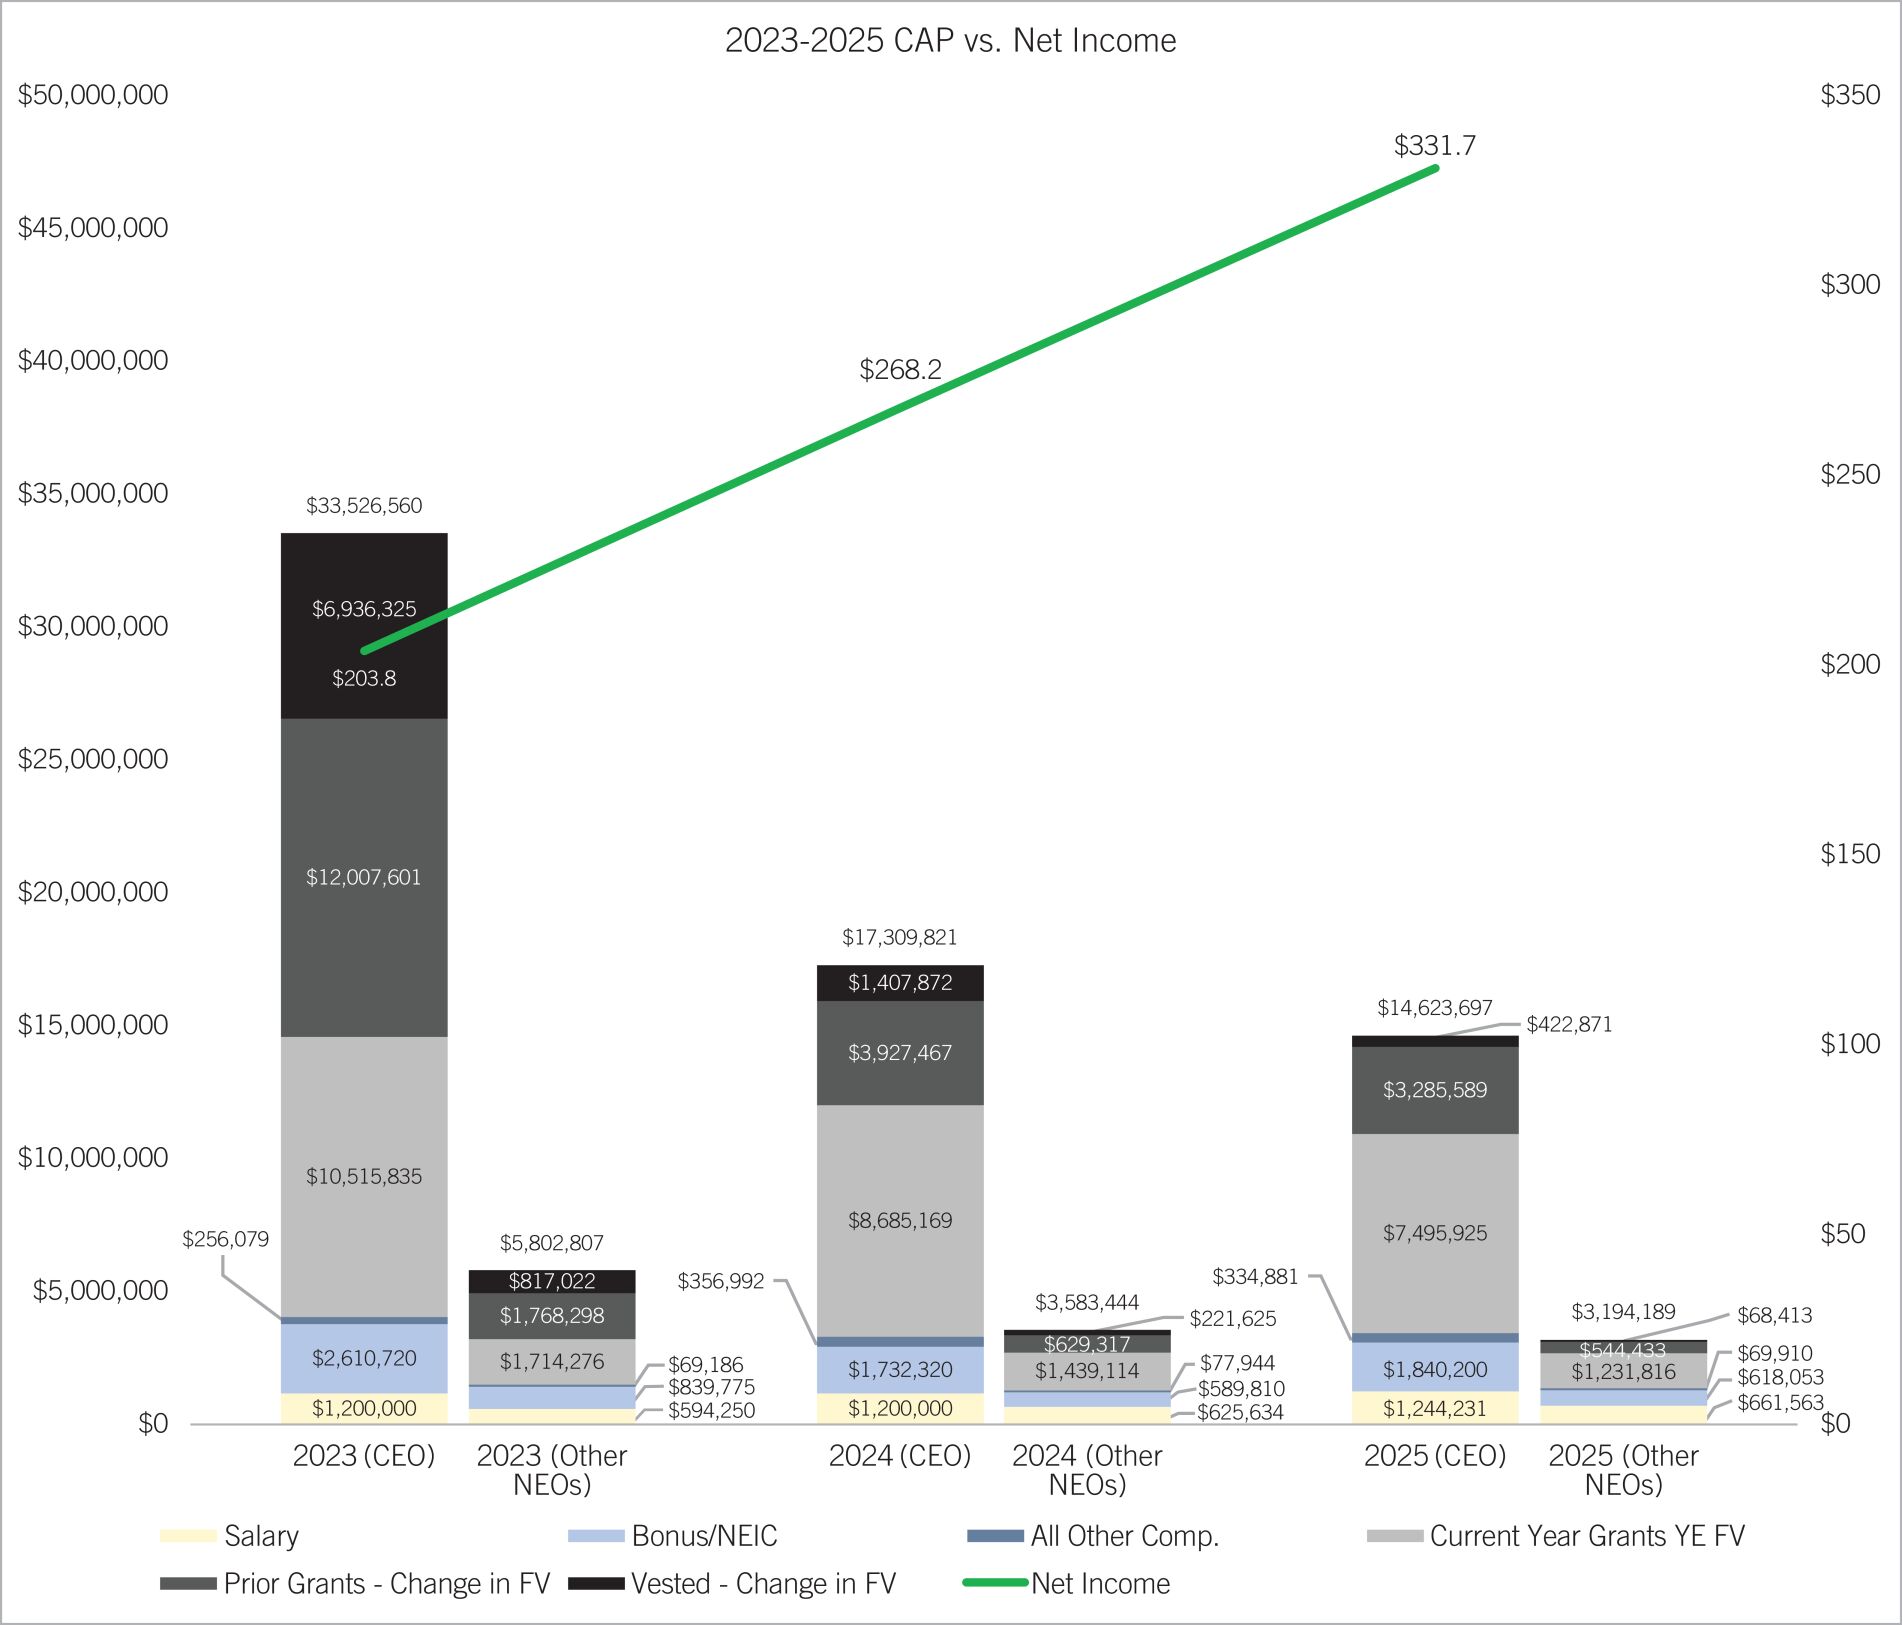
Relationship between CAP and the Company-Selected Measure (Adjusted EPS)
The chart below reflects the relationship between the PEO and Average
Non-PEO
NEO CAP and the Company’s Adjusted EPS for 2023, 2024, and 2025. This metric is used to determine 60% of the earnout of annual incentive program for the PEO and 75% for the other corporate NEOs and is strongly correlated to the Company’s absolute and relative stock price performance, which meaningfully impacts CAP. We consider Adjusted EPS to be among the most important financial measures used to link pay with performance in 2025 because it determines a significant portion of NEOs’ variable, and thus total, compensation each year. 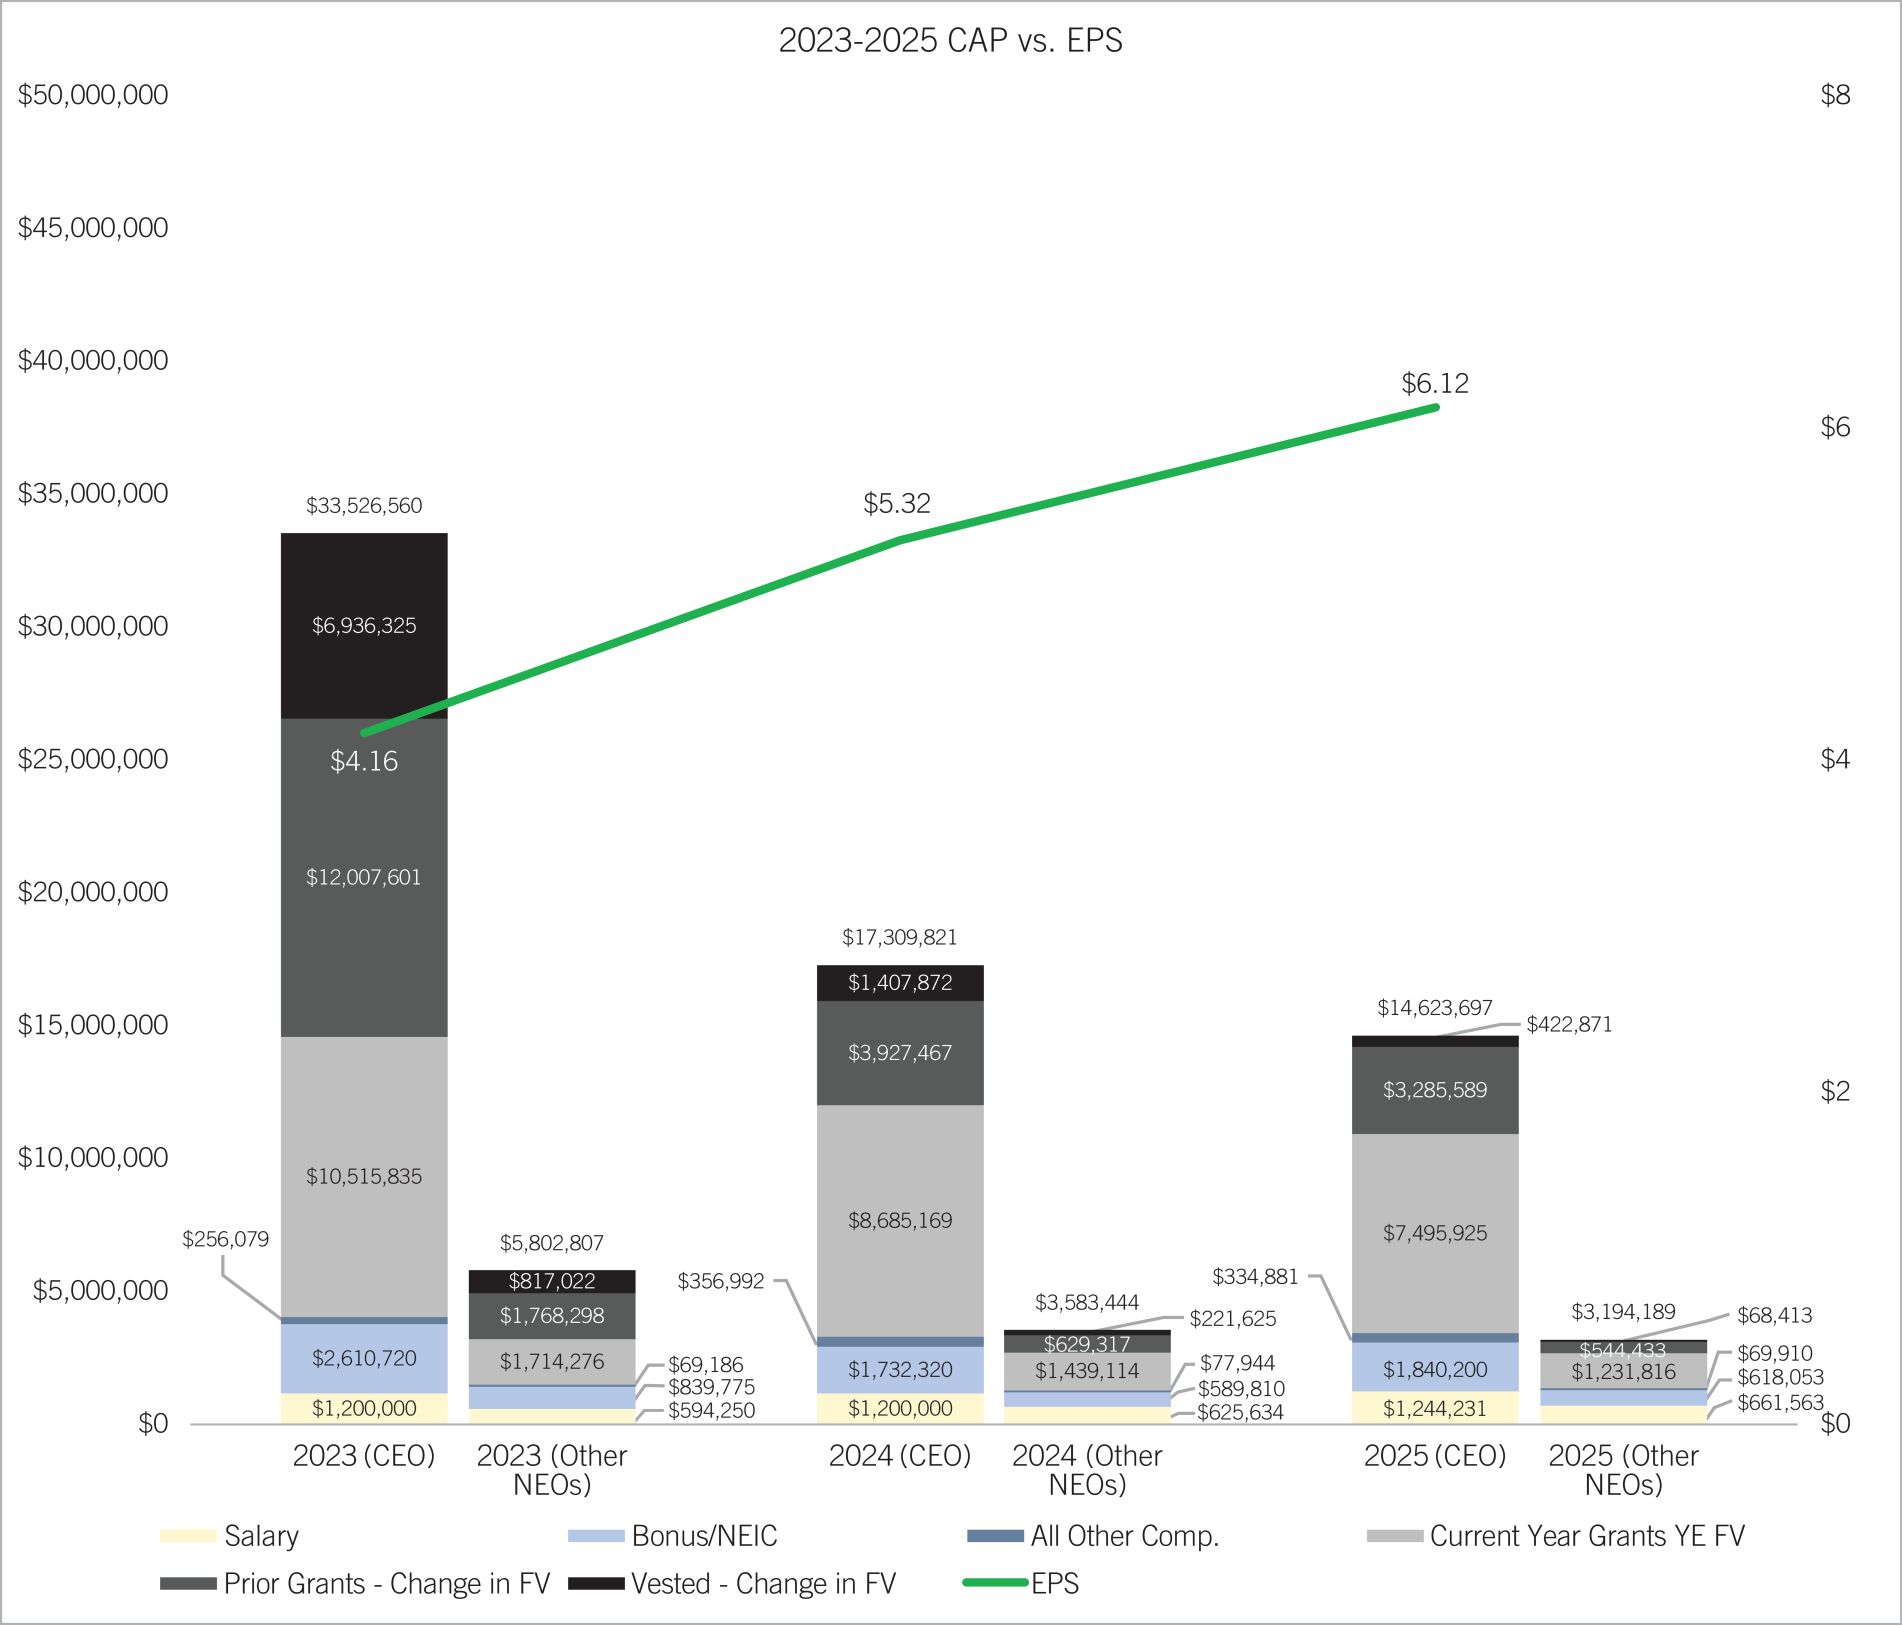
Relationship between CAP and TSR
The chart below reflects the relationship between the PEO and Average
Non-PEO
NEO CAP, the Company’s TSR, Crane NXT’s TSR, and the TSR Peer Group in the above table for 2023, 2024, and 2025 – the S&P 400 MidCap Capital Goods Index, which is also used to determine relative TSR performance for PRSU payouts. As noted above under “Pay versus Performance Calculations and Impact of the Separation” and as illustrated in the graphics above, the equity awards held by the Company’s NEOs following the separation, as reflected in CAP values, are tied to the value of both Crane Company and Crane NXT stock prices and performance, as applicable. The table below shows, in compliance with PVP regulations, the most important metrics used to link CAP to Company performance. These measures, along with others, significantly impact annual compensation decisions and outcomes for the executive team.
Performance Metric |
Impact on CAP | |
Adjusted EPS |
||
| Earnings from continuing operations per diluted share excluding special items | Determines 60% of the annual incentive payout for the Principal Executive Officer (“PEO”) and 75% for other NEOs | |
Adjusted Free Cash Flow |
||
| Cash provided by operating activities, less capital spending, adjusted for special items | Determines 20% of annual incentive payout for the PEO and 25% for other NEOs | |
Relative Total Stockholder Return |
||
| Stock price performance versus a comparator group (S&P 400 MidCap Capital Goods Index) | Determines 100% of the PRSU payout, which represents 55% of the annual LTI grant value for the PEO and 50% for other NEOs | |